XAUUSD — Bulls Control Wave 5XAUUSD — Gold is still holding inside wave 5, but resistance is starting to matter
Gold remains inside a broader bullish structure, and the chart still supports the idea that the market is trading through wave 5 rather than moving into a full reversal.
What makes the current setup more interesting is the mix between technical strength and macro hesitation. On one side, the broader trend is still intact and price is holding inside the ascending channel. On the other, recent Fed comments are kee
Elliott Wave
XAUUSD may be in corrective phase.Gold May Be Entering a Corrective Wave — Strong Data Is Starting to Matter Again
Gold still looks elevated on the chart, but the structure is beginning to suggest that the market may be shifting from impulsive upside into a corrective phase.
A small but important macro note first: the latest New York Fed Empire State Manufacturing Survey did not come in weak. The headline index actually rose to 11.0 in April, versus -0.5 expected and -0.2 prior, while new orders and shipments also improved. Th
XAUUSD: Selling, larger upward move coming.XAUUSD: Gold Pulls Back Under 4800 as Short-Term Pressure Builds
Hello everyone, here is my view on the current XAUUSD setup.
Market Analysis
Gold is currently facing short-term selling pressure after failing to hold above the recent high near 4870, and price is now trading back around the 4800 level. This pullback comes as the US dollar shows a modest recovery, while geopolitical uncertainty remains unresolved but not escalating enough to drive strong safe-haven demand.
From a technical
XAUUSD – Wave 5 forming as macro pressure lowersGold is not just moving — it’s transitioning into a late-stage impulsive structure.
Recent data shows the Fed’s unrealized losses have narrowed to $844.2B, down significantly from $1.06T. While this doesn’t directly shift monetary policy, it signals reduced systemic pressure — creating a more stable backdrop for risk assets and gold to continue trending structurally.
Market Structure & Elliott Wave
Price has completed a clean impulsive sequence from the bottom:
Wave (1) → (2) → (3) expansion
XAUUSD Before PPI — Final Upmove or Sharp Downturn?Gold Before PPI — Elliott Structure Suggests One More Push Higher, but Timing Matters
Gold is moving into a sensitive zone just as PPI news approaches, and that combination matters. When a high-impact release enters the market, price can easily become emotional for a few hours — but structure usually still tells the bigger story.
Right now, the chart continues to suggest that gold is trading inside a developing Elliott sequence, where the market may still be building the final leg of the curre
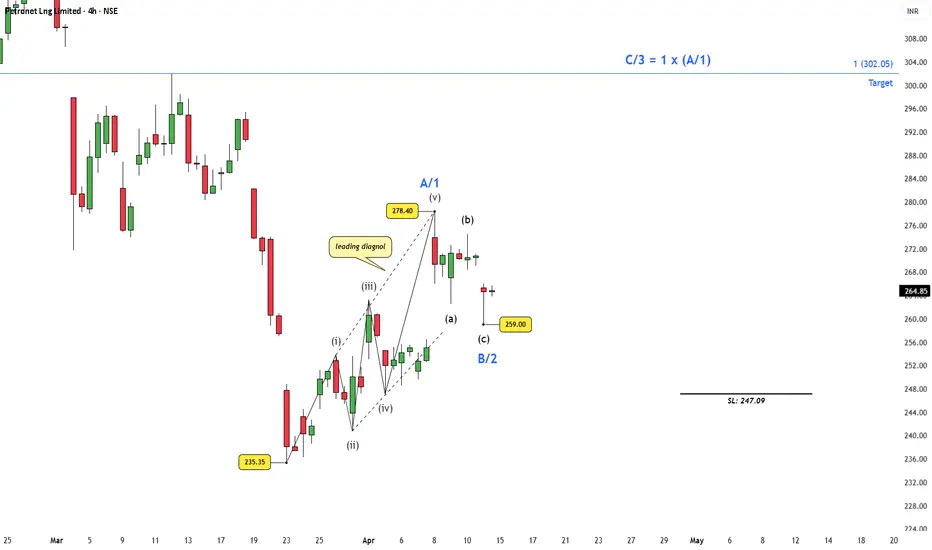
Petronet LNG: Leading Diagonal Signals a Structural BreakoutTechnical Context
The price action on the 4-hour chart for Petronet LNG has established a leading diagonal off the base, followed by a standard corrective pullback. This specific structural sequence dictates two primary pathways for the impending advance: a three-wave zigzag or a five-wave impulsive move. Because a leading diagonal can operate as Wave A of a zigzag or Wave 1 of an impulse, the setup provides dual structural justifications for continued upward momentum.
Bullish Scenario
Th
XAUUSD filled the gap— But the More Important Signal Is What Came After
Gold opened the week with a sharp downside gap, and that kind of move usually creates immediate uncertainty. In many cases, a gap like this can trigger emotional selling and break short-term confidence. But this time, the market responded differently. Instead of accepting lower prices, gold recovered quickly and fully filled the gap, which tells me the first wave of weakness was absorbed rather than expanded.
That matters, because when a marke
Gold Compression – Break AheadGold – Compression under trendline, liquidity building before the next expansion
Gold is no longer trending impulsively — it’s transitioning into a compression phase right beneath a descending trendline. After completing a 5-wave structure and reacting strongly from the high, price is now forming a corrective pattern, with liquidity clearly building on both sides.
📊 Technical Overview
Market rejected from the recent high and is now respecting a descending resistance trendline. Structure shows
XAUUSD Elliott structure indicates critical market turn.Gold Weekly Outlook — Elliott Structure Hints at a Critical Turn
Gold is moving into a very important phase for next week, and the current structure suggests the market may be approaching the final part of a broader corrective cycle rather than starting a fresh impulsive rally.
From an Elliott Wave perspective, the chart is showing a completed or nearly completed wave 4 rebound, with price now reacting into the 0.5–0.618 Fibonacci retracement zone around the 4750 area. This zone is important b
Nifty 50 – Short-Term Elliott Wave ViewThe impulsive rally off the 22,182 lows has played out as below:
Wave (1) & (2) completed
Extended Wave (3) topped near 24,025
Shallow Wave (4) finished as a clean ABC correction (a-b-c), holding perfectly at the 0.236 Fib level (23,675)
We are now inside Wave (5) of the larger Wave A / 1.
Current expectation:
Wave (5) should carry Nifty higher towards the 24,300 – 24,400 zone (blue line target) to complete the entire impulsive sequence of Wave A/1.
Once Wave (5) terminates in the
Stage 2 Brekout. Wave 3 CandidateNSE:BSE Stage 2 Breakout. Breaking out of Cup and Handle Pattern.
Getting Ready for Wave 3 Rally. Strong Rally Can Emerge out of Base Breakout.
The stock Is Showing Bullish Momentum and High Relative strength.
Trend Indicator showing Ultra Bullish Readings.
The Stock can Produce strong Momentum and Fast Rally.
XAUUSD Wave C forming — correction before move?Gold is showing a clear Elliott Wave corrective structure (A–B–C) after completing a strong impulsive move to the upside. Price is now approaching a key sell zone around 4780–4800, aligning with the upper trendline.
Technical structure (Elliott view) Previous impulse (1–5) appears completed Current move forming ABC correction Wave B is testing resistance → potential rejection Wave C likely targeting FVG / liquidity zone ~4520
This suggests a classic correction phase before continuation.
Funda
Nifty Analysis for the week 06 April to 10 April, 2026Wrap up:-
Nifty has completed wave 4 at 23862 and wave 5 at 22182. Therefore, major wave 2 has been completed. Now, major wave 3 is in progress.
In wave 3, internal wave 1 is in progress.
What I’m Watching for the week 06 April to 10 April, 2026🔍
Further, Nifty has now broken upside immediate resistance which is lies in the zone 22485-22672 and therefore, breakout has been confirmed which therefore, confirms completeion of major wave 2. Now, wave 1 of wave 3 is in progress for a probable
AAOI: Elliott Wave & Market Outlook
The stock has entered a "parabolic" phase, likely the Wave 3 of 3 extension, driven by record-breaking orders for 800G and 1.6T transceivers.
Current Momentum: AAOI has surged nearly 200% year-to-date, breaking out of a consolidation zone near $105 with heavy institutional buying.
Upside Target (Short-term): $140.00 (Current "Street High" analyst target and psychological resistance).
Extended Target (2026 Cycle): $160+ if management achieves the guided $1 billion revenue milestone for the ye
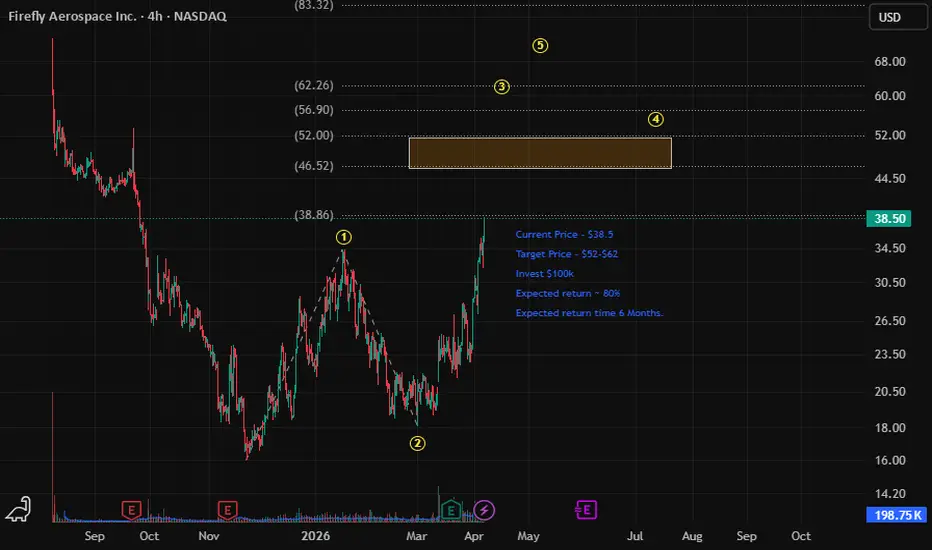
FLY Elliott wave AnalysisFLY Elliott Wave Analysis
Current price action suggests FLY is entering a bullish impulsive phase. After completing a corrective structure, the stock is now gaining momentum toward our Fibonacci extension targets.
Target 1: $50 (Primary)
Target 2: $62 (Extended)
Outlook: Bullish as long as the recent swing low holds. Looking for a clean 5-wave move to the upside.
Risk Management: Invalidation occurs on a break below the Wave 2/B low.
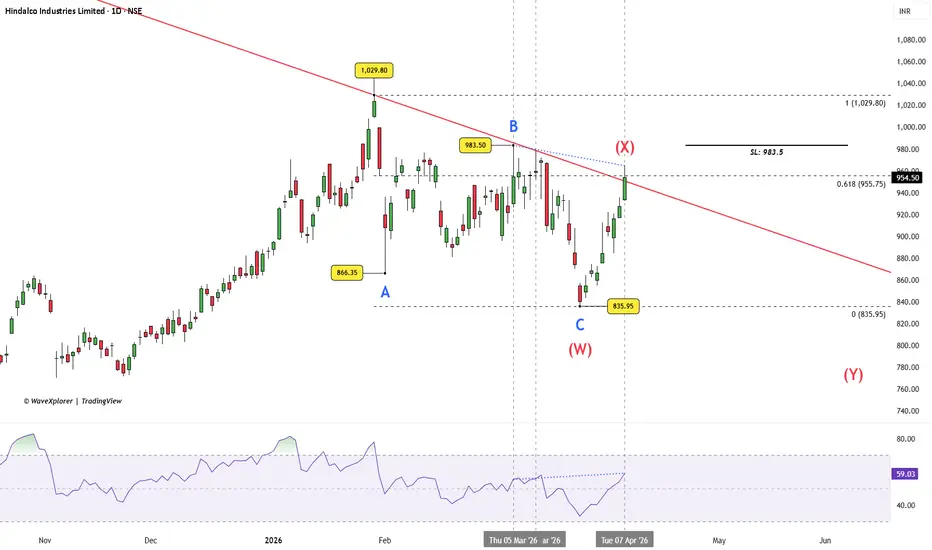
HINDALCO: Structural Rejection and Wave (Y) Downside ProjectionTechnical Context
HINDALCO price action is currently testing a primary resistance confluence following the peak at 1,029.80 . The prevailing structure suggests an unfolding (W)-(X)-(Y) complex correction. Current price levels align with the descending trendline, the 0.618 Fibonacci retracement at 955.75 , and are accompanied by hidden bearish divergence on the daily RSI, indicating underlying momentum exhaustion.
Bearish Scenario
Thesis: The current resistance cluster will hold, compl
TESLA: Does the Bullish Hammer Signal a Structural Reversal?Technical Context
TSLA has printed a bullish hammer at $337.24 , converging with descending parallel channel support and terminating an ABC zigzag decline (Wave W). RSI momentum at 34.70 indicates downside deceleration. As defined in Steve Nison's Japanese Candlestick Charting Techniques , this morphology fulfills the exact prerequisites for a valid, high-probability reversal signal.
Bullish Scenario
The thesis dictates the initiation of an upward connector Wave (X). The hammer's structu
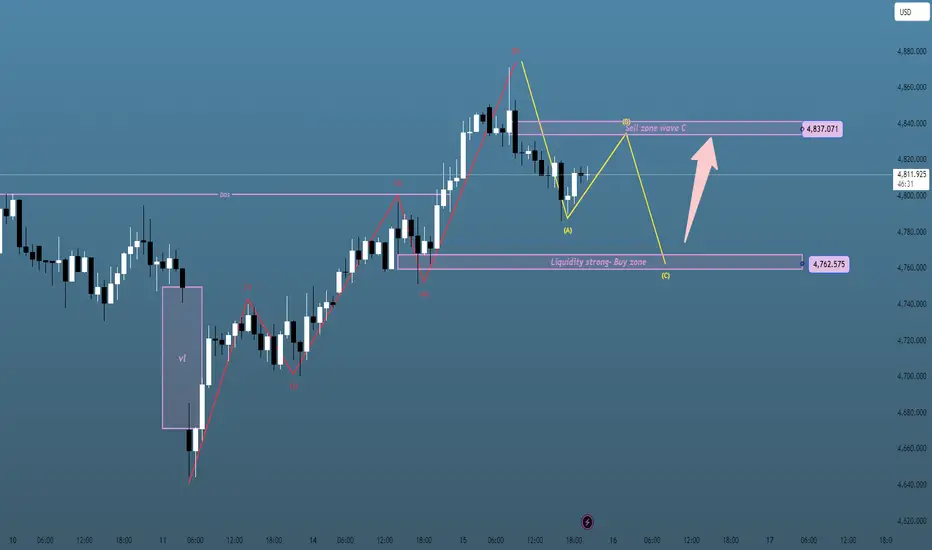
XAUUSD — AB leg looks complete... XAUUSD — AB leg looks complete, and gold may be preparing for the next move lower
Gold is no longer trading in a clean bullish continuation structure.
After the rejection from the recent high, price has shifted into a corrective sequence, and the current chart is starting to fit an ABC downside structure more clearly.
For Kelly, the key point here is that the market appears to have already developed the AB leg, while the latest rebound is struggling below resistance. That keeps the chart vulne
XAUUSD trendline support maintains bullish structureHello everyone, here is my view on the current XAUUSD setup.
Market Analysis
Gold is trading in a constructive structure while broader market uncertainty continues to build. Although April is often seen as a supportive month for equities, the current backdrop is becoming more fragile as investors face three major pressures: inflation risks linked to higher energy prices, weaker expectations for interest rate cuts, and concerns that corporate earnings may not be strong enough to fully support r
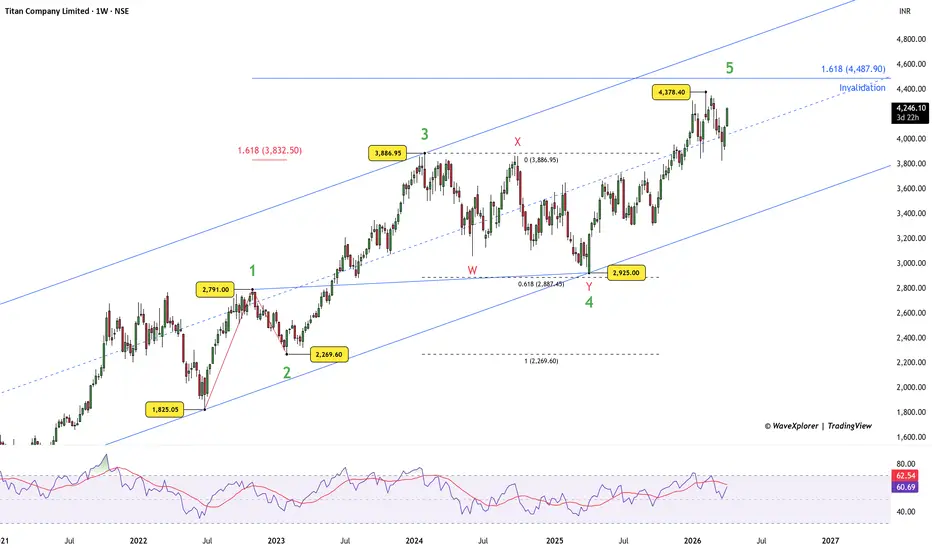
Titan(Weekly) – Wave 5 in Final Stage at All-Time HighsTimeframe: Weekly
Current Price: ₹4,246
Elliott Wave Analysis
From the major low of ₹1,825.05, Titan has completed a clear 5-wave impulsive rally:
Wave 1 : ₹2,791
Wave 2 : ₹2,269.60 (sharp retracement)
Wave 3 : ₹3,886.95 (exact 1.618 extension of Wave 1)
Wave 4 : ₹2,925 (WXY double zigzag)
Wave 5 : currently in progress
Key Levels
Recent high: ₹4,378.40 (possible Wave 5 top)
Wave 5 target (1.618 extension of Wave 1 measured from Wave 4): ₹4,487.90
Bearish invalidation: ₹
XAUUSD — Gold is pulling backXAUUSD — Gold is pulling back, but the bigger structure still needs confirmation
Gold is starting to correct after the latest push into the highs, and the current move is no longer behaving like a clean continuation leg.
At this stage, the chart is shifting from expansion into reaction, and that makes the next few levels much more important than the last rally itself.
For Kelly, this is not the place to chase direction emotionally.
This is the place to read whether the pullback is only a reset
Nifty: 22985. Now we Wait! :)Yet another extreme red day gave us a good upmove.
As discussed earlier - our target of 23.8-24.3k remains open, but at this point we book the short term trades and wait for a pullback to re-enter, while being open to the possibility of a new low to 22050-22100 before the 24k target.