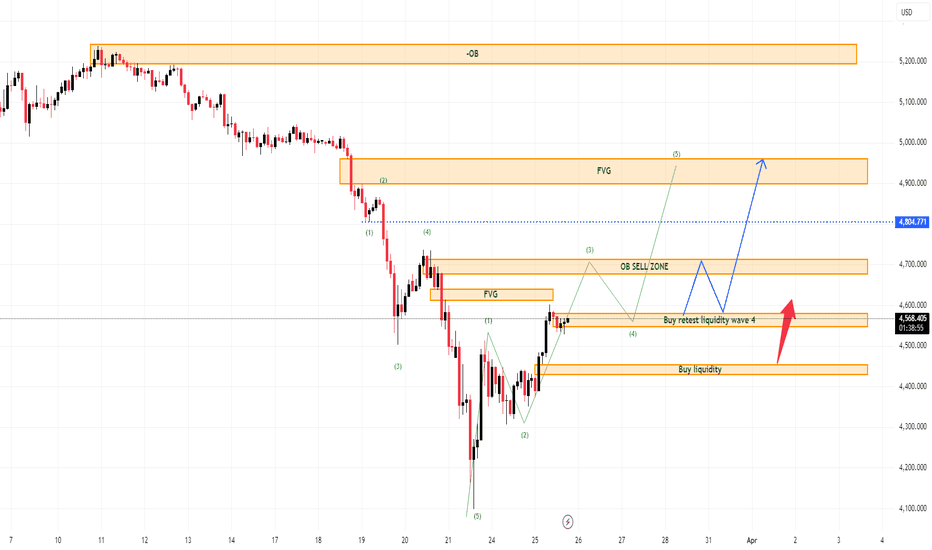
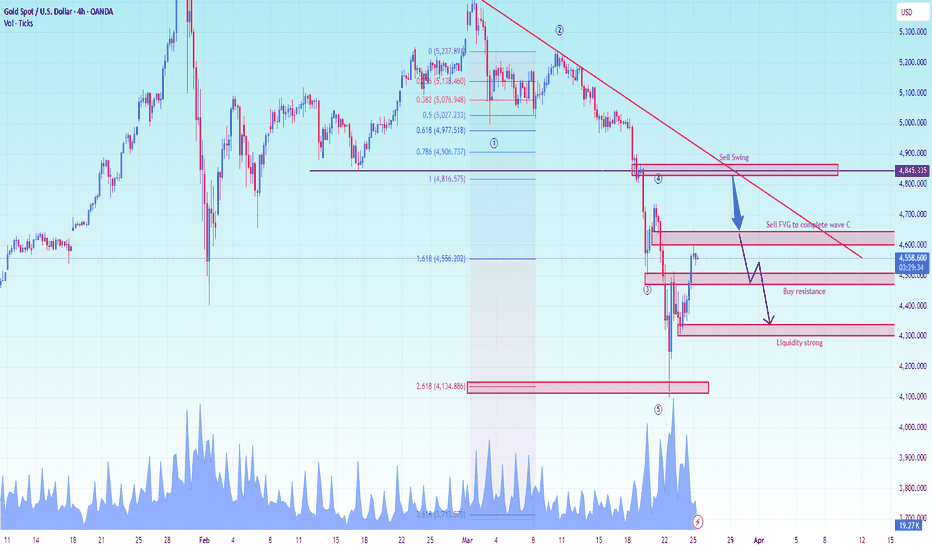
XAUUSD — Gold is still in wave 2 recoverywhile the bigger impulsive leg has not started yet
Gold is continuing to recover from the recent low, but the current move is better read as a wave 2 rebound rather than a full bullish expansion.
That distinction matters, because wave 2 usually carries a corrective character: price can recover with decent momentum, but the move is still vulnerable until the next impulsive leg confirms itself.
For Kelly, this is an important stage.
The market is no longer collapsing, but it is not yet in the st
Elliott Wave
XAUUSD - Elliot Wave completed.Wave C Recovery May Offer a Fresh Sell Opportunity Within the Medium-Term Downtrend
Hello everyone, here is my view on the current XAUUSD setup.
Market Analysis
Gold is still trading inside a medium-term descending channel, which means the broader structure remains bearish despite the recent rebound from the lower zone. On the chart, price has already completed a strong decline and is now entering what looks like a corrective Wave C recovery.
This rebound does not change the main trend yet.
Is Gold Headed Toward 4000 or Even Lower Before Reversal?In the previous article, we were expecting a temporary bounce within a broader bearish structure, not a full trend reversal.
Check here:
Price action is still consistent with that bearish view, but the slope suggests we are still in Wave 3. XAUUSD may form wicks near the lower band of the parallel channel. Wave X has reached wave equality (100% of Wave A). It's possible to see 4000 – 3950 or lower before a reversal. Wave 4 may occur with minimal retracement, as the slope is very strong.
Warning: NIFTY May Not Have Bottomed YetElliott Wave Overview:
NIFTY 50 (spot) is currently forming a corrective structure. There are multiple valid ways to label this chart, but this count is selected based on Elliott Wave alternation guidelines. Corrective structure is a normal flat.
The index appears to have completed wave (X) at 26323.20, and wave (Y) is now unfolding. So far, wave (Y) has retraced approximately 78.6%, while a typical flat correction often extends toward 100% retracement of wave (A).
At present, the market se
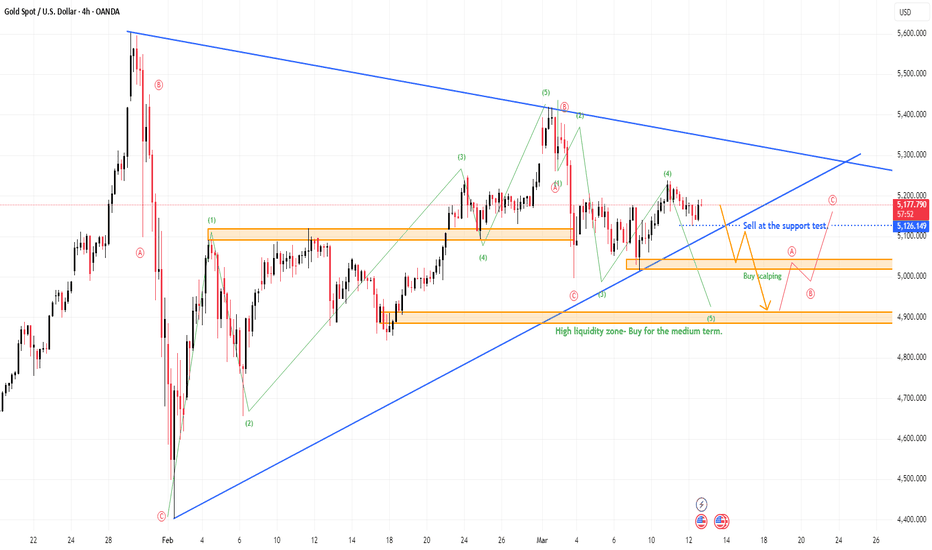
XAUUSD H4: Medium-Term Gold OutlookGold May Recover First, but the Medium-Term Structure Still Favours Further Decline
Gold may still show a recovery bounce from current levels, but the broader structure continues to point lower. Even if price rebounds in the short term, the market is still facing medium-term corrective pressure as expectations for tighter monetary policy from major central banks continue to rise, while spot crude oil in the Middle East has surged towards the 150 USD area, keeping inflation risks elevated.
The
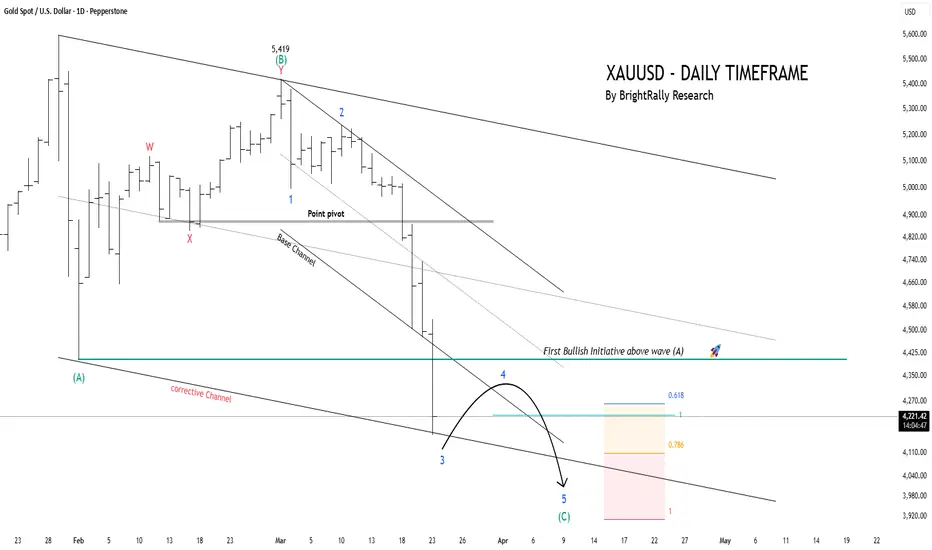
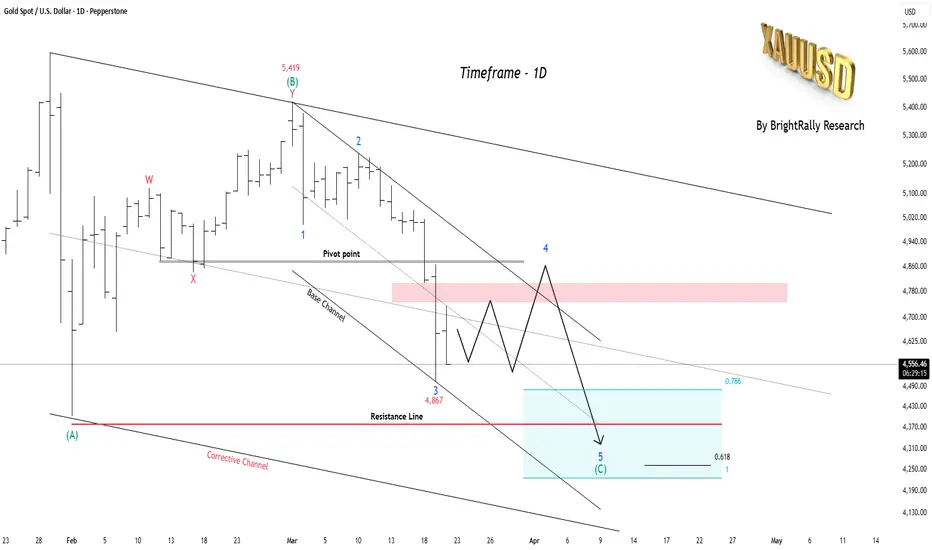
Gold's Final Shakeout Is ComingEWT: DAILY TF
Gold hit a peak of $5419 in early March and has been falling since then. Right now, XAUUSD is trying to move up slightly, but it looks more like a temporary bounce than a real recovery. Gold is forming a flat formation.
Waves 1 through 4 have already played out, and the market now appears to be setting up for the final move: Wave 5 to the downside. After Wave 5 is complete, XAUUSD is likely to start moving upward.
Immediate Resistance: 4800
Immediate Support: 4500
A
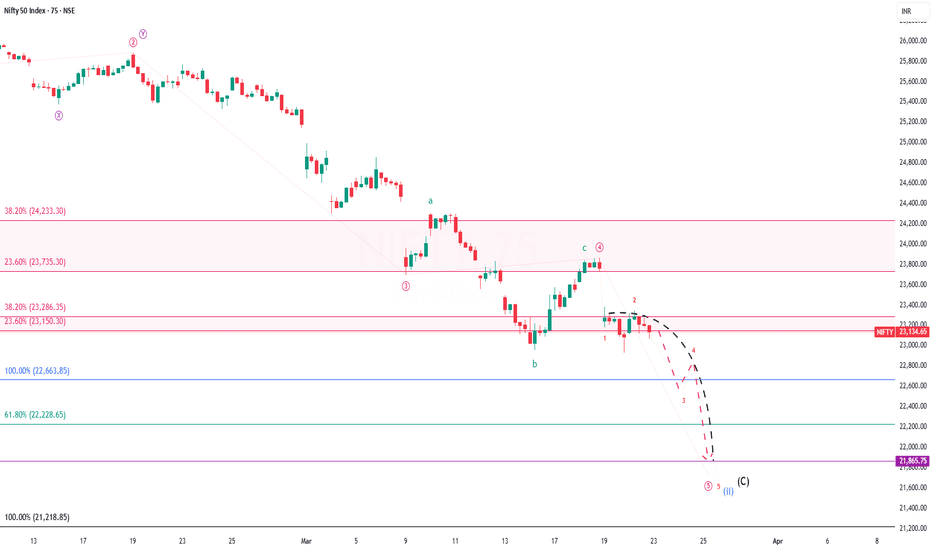
Nifty Weekly Analysis for the week March 23-27, 2026Wrap up:-
As already mentioned earlier, nifty is in wave 4 and final wave 5 is pending. Now, nifty has completed wave 4 at 23862 and currently, wave 5 is in progress.
In wave 5, wave 1 is completed at 23180, wave 2 at 23345, currently wave 3 is in progress and wave 4 & 5 are pending.
What I’m Watching for for the week March 23-27, 2026🔍
Now, upside immediate resistance lies in the zone 23150-23286 and therefore, wave 5 will progress for a probable target of 22663-22228-21865.
Disclaimer
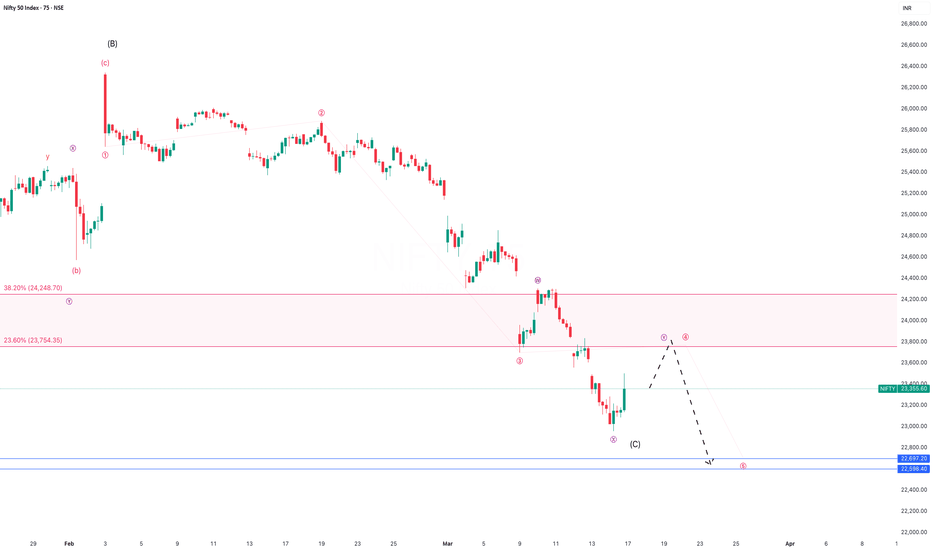
Updated Nifty Weekly Analysis for the week March 16-20, 2026Wrap up:-
As Nifty breaks 23085; earlier pattern has been negated. Now, final target for Nifty is pending and is yet to be achieved in coming days.
Now, currently wave 4 of wave c is in progress and in wave 4 wxy/abc is formed.
What I’m Watching for for the week March 16-20, 2026🔍
Now, upside immediate resistance lies in the zone 23754 to 24248 where in wave 4 is expected to be completed and thereafter, wave 5 will progress for a probable target of 22697-22598.
Disclaimer: Sharing my pe
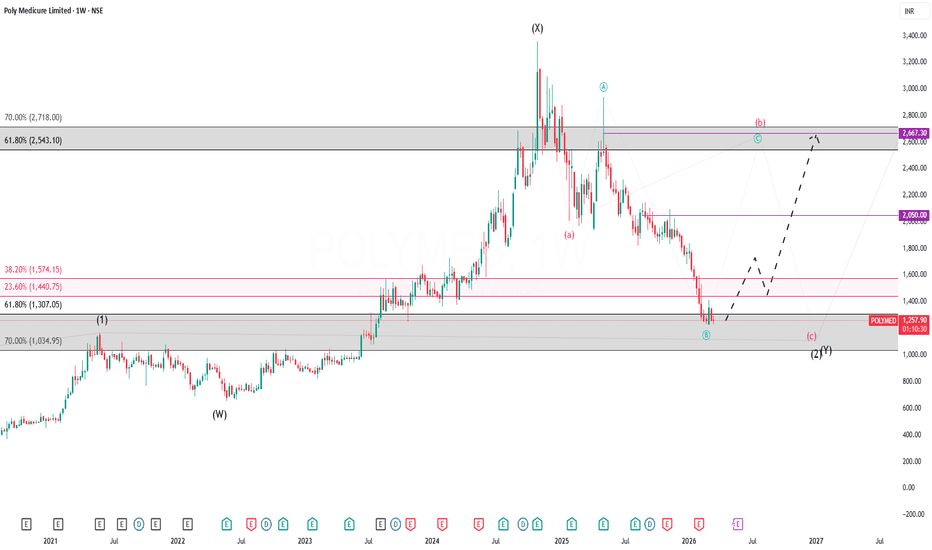
Short term analysis of Poly Medicure Ltd.Wrap up:-
As per chart of Poly Medicure Ltd., it seems that the stock has reached 61.8%-70% of total rise and stock is currently in wave 2 which is in progress and is making a wxy pattern with w is completed at 651, wave x at 3357 and wave y is in progress.
In wave y, wave a is completed at 2008, wave b is in progress and is making a 3-3-5 irregular correction.
What I’m Watching for 🔍
Low Risk Entry Range for the stock is 1034-1307 for a Probable target of 1650-2050-2543-2718.
Disclaim
XAUUSD- Wave 5 Is Nearly DoneXAUUSD (H1) — The downtrend is still dominant, but the better setup may soon shift from selling to reversal trading
Gold is still trading inside a very clear bearish sequence on H1.
The chart continues to print lower highs and lower lows, and the latest breakdown shows that sellers are still controlling the broader move. From a structural point of view, this is still a market under heavy pressure, not a market that has completed reversal confirmation.
However, the chart is now entering a diffe
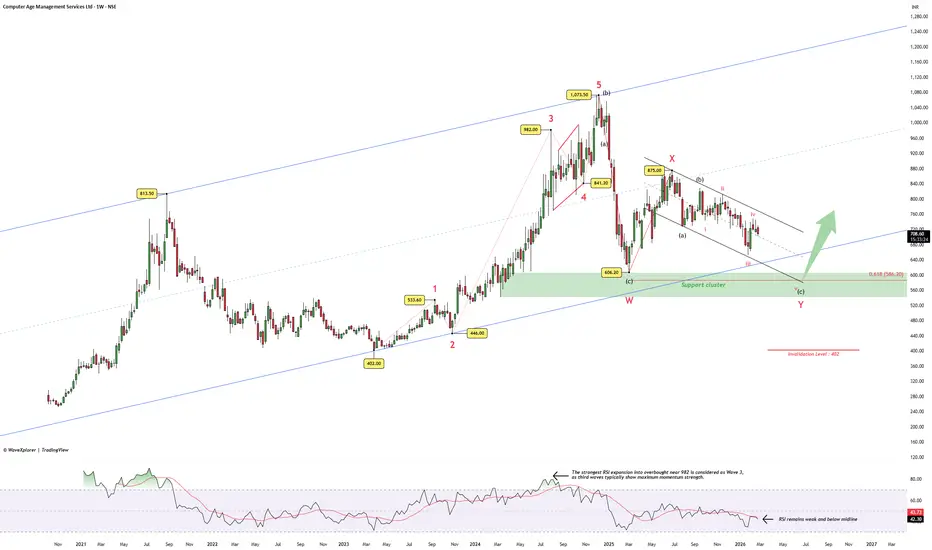
CAMS Weekly: Is Wave Y Ending Near Key Support?Structure Overview
From the lows of 402 , CAMS has formed a clear 5-wave impulsive rally till 1073.50 .
The strongest momentum expansion came near 982 , where RSI entered overbought zone — this is being considered as Wave 3 .
Price was respecting a broader upward trending channel (blue channel) during this entire advance.
After topping at 1073.50 , the stock corrected sharply in an (a)(b)(c) pattern till 606.20 .
The rise from 606.20 to 875 was overlapping and lacked impulsive stren
Apollo Hospitals: Flat Correction Developing After 5-Wave Rally?Structure Overview
On the 4-hour timeframe, Apollo Hospitals Enterprise Ltd. appears to have completed a five-wave impulsive rally from 6696.50 to 7870.50 .
Following this impulse, price declined in three waves toward 7476 , which can be interpreted as wave (A) of a potential flat correction.
From there, price retraced almost entirely back to the prior high near 7870 , forming wave (B). This deep retracement is typical behaviour seen in flat corrections.
If this interpretation holds,
XAUUSD -Wave 3 pressure is building as USD demand firms again Wave 3 pressure is building as USD demand firms again
Gold remains under pressure as the market moves deeper into a bearish impulsive structure, with price now showing signs that wave 3 lower is still in progress.
The macro backdrop is also not helping gold stabilize.
Going into the FOMC decision, the USD is entering with a firmer base. Earlier dollar-hedging flows seen in early February have largely been reversed, while demand for USD cash and short-duration instruments has stayed positive.
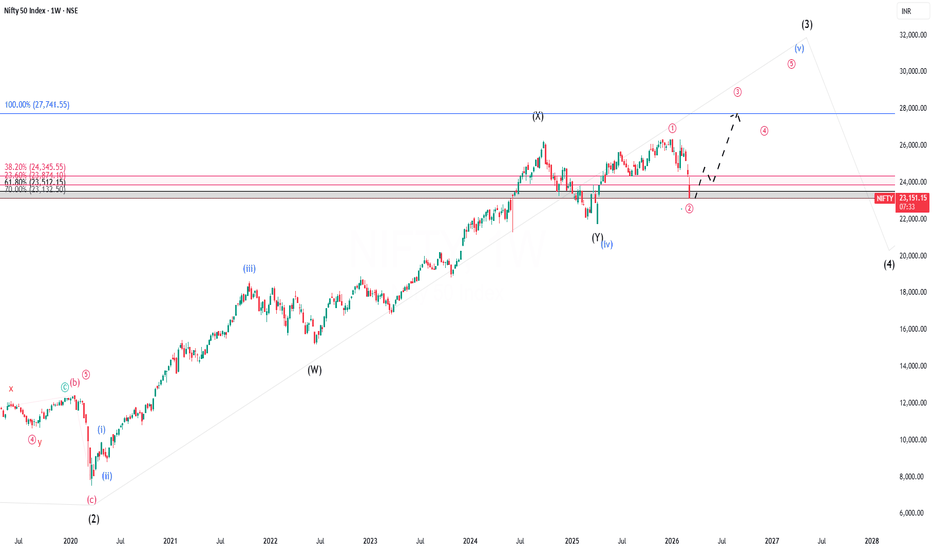
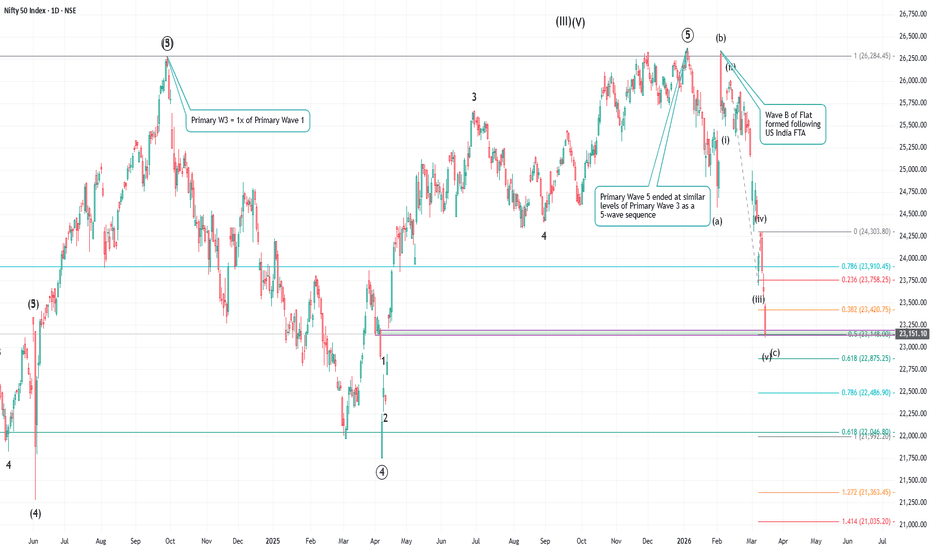
Short Term View for Nifty (Till June/July, 2027)Wrap up:-
Final target for Nifty @23112 has been achieved today i.e. on 13.03.2026.
Now, for a impulsive move i.e. major wave 3 starts after corona on 24.03.2020, in which wave 1 has been completed at 9889, wave 2 at 8806, wave 3 at 18604, wave 4 at 21743 and wave 5 is currently in progress.
In wave 5, wave 1 is completed at 26373, wave 2 at 23112 and wave 3 is currently in progress.
What I’m Watching for Nifty Till December, 2027 🔍
Now, upside resistance lies in the zone 23874 to 24345, b
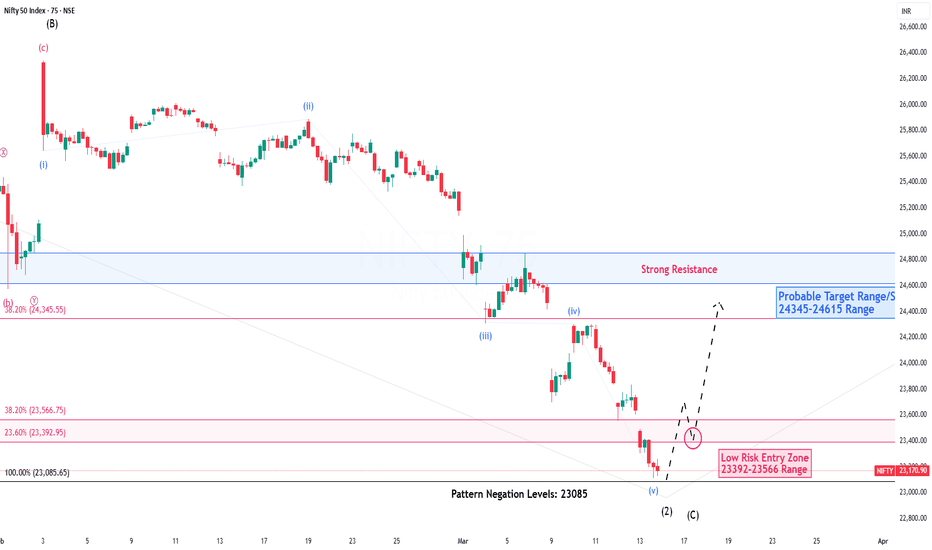
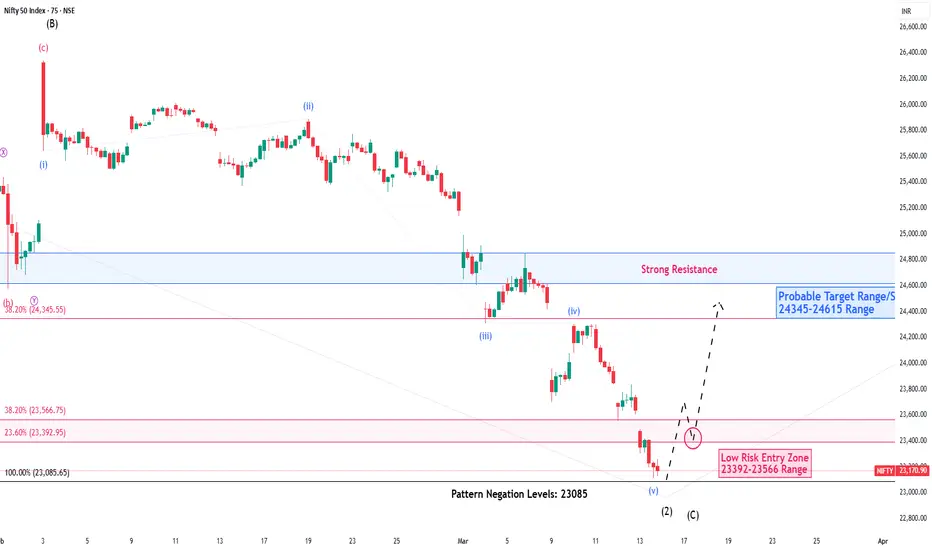
Nifty Weekly Analysis for the week March 16-20, 2026Wrap up:-
Final target for Nifty @23112 has been achieved today i.e. on 13.03.2026.
Now, currently wave 5 of major wave 3 is in progress and in wave 5, wave 1 is completed at 26373, wave 2 at 23112 and wave 3 is currently in progress.
What I’m Watching for for the week March 16-20, 2026🔍
Now, upside immediate resistance lies in the zone 23392 to 23566, breakout above this zone confirms for a starting of wave 3.
In wave 3, wave 1 is in progress and heading towards for a probable target of
Nifty – Where is it heading? - Continuation Post (Sell on rally)
This post is a bit detailed, but important from a structural perspective. All the views expressed are from EWP perspective.
The Nifty correction was not caused by the war — the wave structure had already warned about it. Even if the war was not there, still the correction would have happened at a slower pace.
Please refer to my earlier post on Nifty dated 23 Jan 2026, titled “Nifty 50 – Elliott Wave Update (Daily) – 23 Jan 26”. In that post, I had advised that Nifty has completed an impulse w
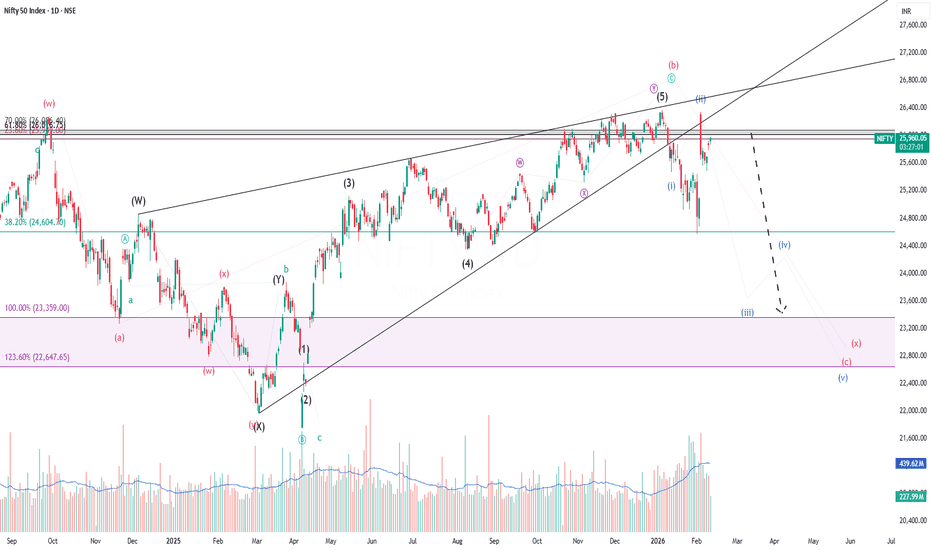
Very Short Term View for Nifty (Till April, 2026)Wrap up:-
Nifty has made breakdown below the rising wedge on 09.01.2026 and thereafter, it is retesting the breakout.
Further, Nifty has made breakdown below 24604 which is 38.6% of total rise i.e. from 21743 to 26373. Thereafter, it is assumed/weightaged that wave 5 has been completed. Now, wave Cis running for a min. target of 23359.
In wave c, wave 1 is completed at 25473, wave 2 at 26341and wave 3 is currently in progress.
What I’m Watching for Till April, 2026 🔍
Nifty is now facing
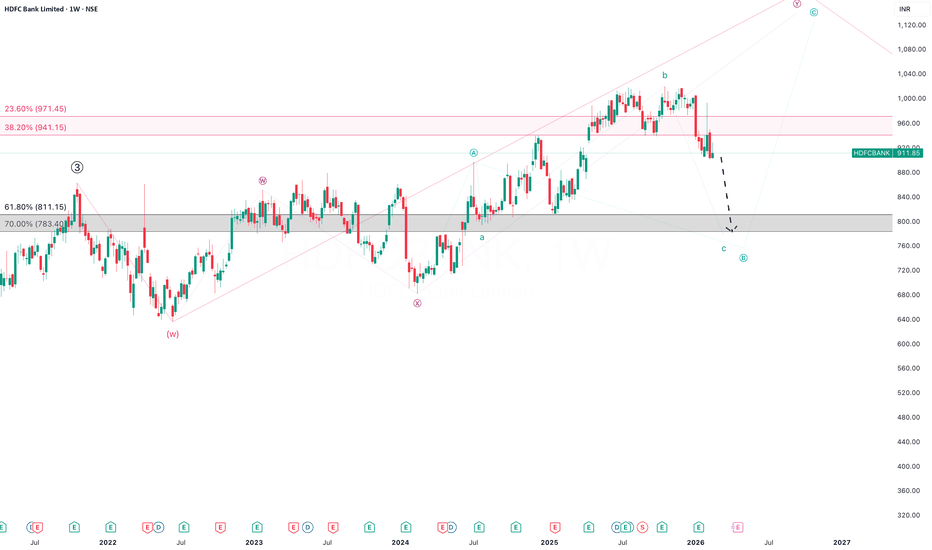
Short term Analysis of HDFC BankWrap up:-
As HDFC Bank is making a wxy pattern in wave 4 and has completed its wave w at 635 and wave x is in progress.
In wave x, it has formed wxy pattern (DZZ correction) and currently, wave y is in progress of which wave a is formed at 897 and wave b is in progress.
In wave b, it has formed a abc pattern (irregular correction) of which wave a is completed at 794, wave b is completed at1020 as HDFC bank given breakout below 941. Now, wave c in progress for a probable target of 811-783.
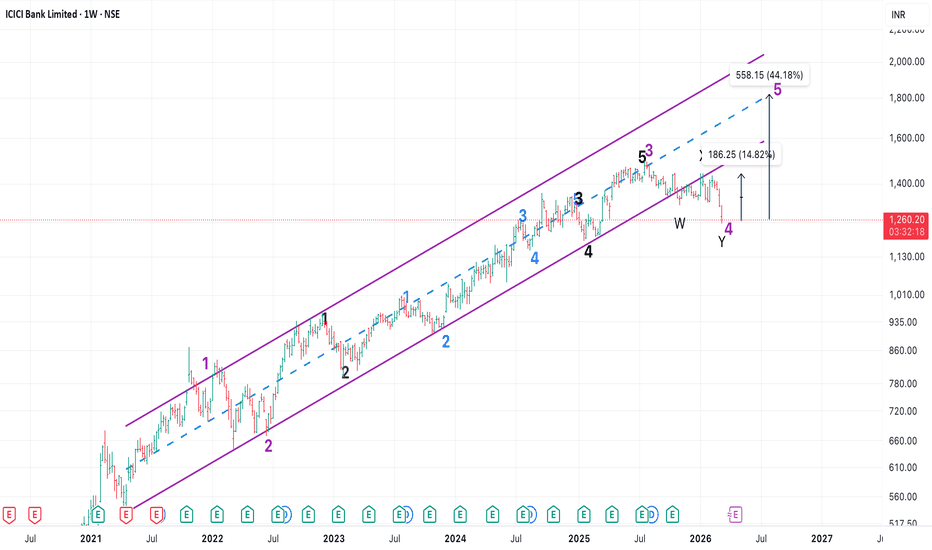
ICICI Bank - Long Trade Loading!ICICI Bank - Leader among Pvt Banks - Took lead and made ATH in March 2025, when rest of the market was at lows.
It completed 3 on weekly in July 2025 and has been in 4 since then.
Current sell off should complete 4 at 1250-1200.
Good levels to go long with target of 1800 long term, 1400 short term.
Maruti Crashes to 12,966 Support – Bounce Incoming or Trap?From the peak of ₹17,370, the correction has unfolded as a clear ABC zigzag:
Wave A: ₹17,370 to ₹14,058 (19 bars / 28 days)
Wave B: Recovery to ₹15,459
Wave C: Decline from ₹15,459 to ₹12,966 today (also 19 bars / 28 days)
Key points:
Wave C matches Wave A exactly in time – often a signal that the correction is nearing its end.
Today's low filled the gap at ₹12,959 and tested the major support level (around ₹12,966–12,959).
The decline aligns with a head-and-shoulders breakdown pa
Bank Nifty Pullback Analysis: Flat Correction or Zigzag?Weekly chart shows completed five-wave impulse from lows near 47,702.90 to 61,764.85. Decline is ABC corrective: wave A to 59,644.55, B deep to ~61,678.80, C down in progress.
Daily timeframe details C as motive impulse: wave (iii) at 54,760.55, current bounce likely wave (iv) corrective (room to 57,400–58,200 Fib retrace of recent leg). Oversold RSI and shooting star suggest short-term relief possible before wave (v) lower.
Targets for C completion cluster near 53,000–54,000 (weekly Fib 0.5–
XAUUSD (H4) — Wave 5 Down Isn’t Done YetGold still hasn’t cleared the noise: wave 5 lower remains on the table, and the safest trigger is a break of the lower trendline
The market is in a difficult phase right now. Political tension and tariff pressure are pulling capital in different directions, the USD is seeing cross-currents, and gold is no longer behaving like a clean safe-haven asset. That is why price action looks noisy: wide swings, weak follow-through, and low confidence in each bounce.
For Kelly, this is not the kind of ma
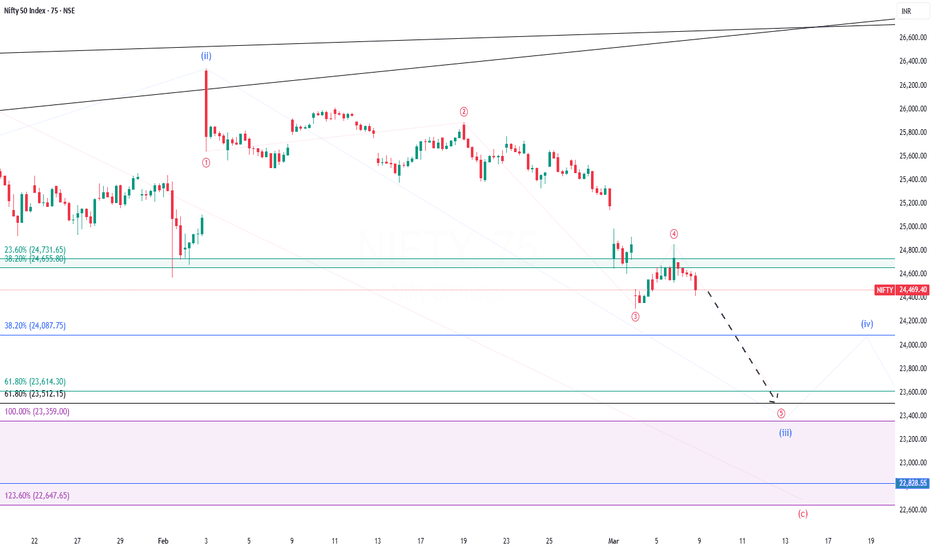
Nifty Weekly Analysis for the week March 09-13, 2026Wrap up:-
Nifty has made breakout below the rising wedge on 09.01.2026 and thereafter, it has retested the breakout on 03.02.2026.
Further, Nifty has made breakdown below 24604 which is 38.6% of total rise i.e. from 21743 to 26373. Therefore, wave 5 has been completed. Now, Major wave C is running for a min. target of 23359-22647.
In wave c, wave 1 is completed at 25473, wave 2 at 26341 and wave 3 is currently in progress.
In wave 3, inner wave 1 is completed at 25641, wave 2 is completed a