Elliott Wave
Nifty Analysis for Nov 12, 2025Wrap-up:
Nifty has completed its major wave B @25715. Now, heading towards its major wave C.
What I’m Watching for Nov 12, 2025 🔍
I’ll be watching for the market to break 38.2% level i.e. 25614; thereafter short nifty below 25555 for a target of 25150 SL 25654 (SL on 25 min. candle close).
Disclaimer: Sharing my personal market view — only for educational purpose not financial advice.
XAG/USD Set for Decline After Finishing Wave YSilver has completed a clear 5-wave upward move, ending near the 51.23 zone, which likely marks the completion of Wave C of the corrective structure. Price action shows rejection from the upper trendline, signaling that buying momentum is fading. This suggests the start of a new A–B–C corrective decline, where Silver could first drop toward 48–47 levels before any temporary bounce. The overall structure remains bearish in the short term unless the price breaks above the 52.76 invalidation zone.
GBPCAD: Bears Ready to Push Into Wave 5GBPCAD has completed a clear 1-2-3 move to the downside, followed by a corrective Wave 4 that has pushed the price higher inside a rising channel. This correction now looks nearly complete, as the price is struggling to break above the resistance. Once Wave 4 is finished, the chart suggests a final drop into Wave 5 toward the lower support zone. That would complete the overall bearish structure before any larger reversal can happen. In simple terms: correction is almost done → one more leg down
VIP Industries – Rising Channel Breakdown, Support Zone in FocusChart Structure
The stock completed a wave 3 advance up to 492.30. What followed is a corrective W–X–Y structure, which probably might test the previous breakout zone around 408–400. This aligns with the 0.382 Fibonacci retracement and previous Wave 1 high, providing strong support.
Key Observations
The corrective leg has unfolded on weak volume, typical of a Wave 4 structure.
Recent breakdown from the rising channel suggests a final (c) leg of Wave Y into the blue support zone.
A possi
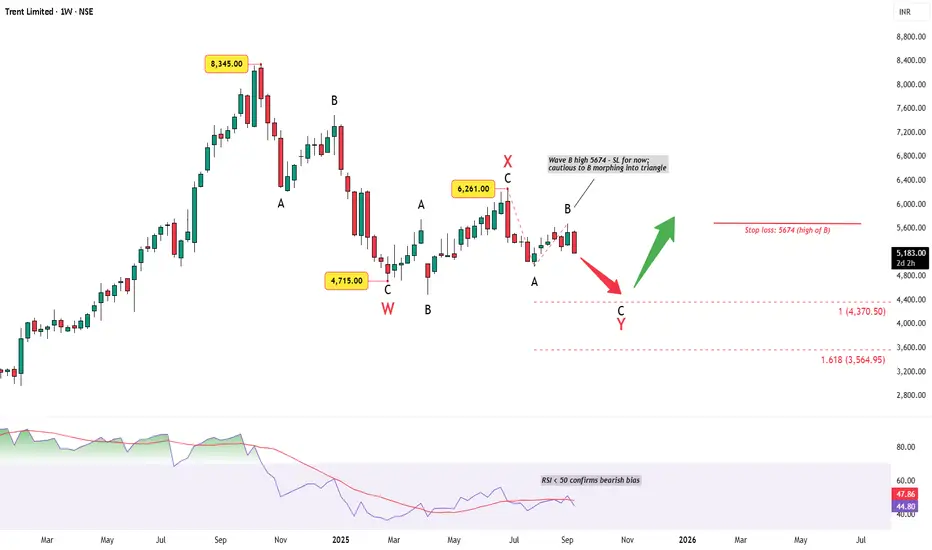
Trent Ltd – Double Zigzag Correction in PlayAfter topping out at ₹8,345, Trent has been locked in a larger corrective structure that now appears to be unfolding as a W–X–Y double zigzag on the weekly chart.
Wave Count
Wave W bottomed at ₹4,715 as a clear ABC.
The rally to ₹6,261 completed Wave X.
Price is now progressing in Wave Y, where:
Wave A has unfolded,
Wave B topped at ₹5,674,
Wave C is expected to continue lower.
Key Levels
Target 1 (1.0 extension): ₹4,370
Target 2 (1.618 extension): ₹3,565
Stop-loss / Inv
Gold Neowave Forecast (10-11-2025)Hello everyone
Sorry for absence as I go in research mode with Neowave and found something interestin, anyway lets talk about gold.
# Gold is started walking again in daily charts and its going or atleast try for the time being to break its all time again.
# I also added a blue box on the chart which is an time box, mean price must cross high within this time limits.
## Stoploss will be 3964 if breaks dont sell just exit.
Rest we will talk in the video along with BTC and Tesla.
Thank You.
Bitcoin_Short Elliot WaveBitcoin appears to be completing an ABC pattern, potentially reaching up to 106,000. I anticipate a downside move below 99,000 once it tests resistance around 106,000. A short position could be considered near that level with a tight stop-loss.Please do your own research before taking any trade decisions.
Canara Bank – Wave V Completed, Time to Exit
Canara Bank has been in a strong uptrend since 3 Mar 2025, forming a clear 5-wave impulse.
Wave 1 peaked on 3 Apr 2025, followed by a simple correction in Wave 2.
Wave 3 peaked on 9 Jun 2025 and extended to a little over 2x the length of Wave 1.
Wave 4 was a zigzag correction, in line with the principle of alternation.
Wave V most likely peaked today (24 Sep 2025) at about 50% of the total length of Wave 1–3.
Internal counts align well, with sub-wave (v) of Wave 5 ending at 61.8% of sub-w
SPX500 – 2H: A Leading Diagonal from the Top?The S&P 500’s 2-hour chart may have just carved a leading diagonal right off the all-time high — a structure often seen at the start of a major new trend.
Each leg fits the contracting wedge geometry:
Wave (1) and (4) overlap, Wave (5) throws slightly under the boundary, and momentum stays fierce through the end — almost too fierce for comfort.
What makes this one interesting is the absence of RSI divergence at the final leg.
That raises the question — is Wave (1) really done, or does it have
DMart(Avenue Supermarts Ltd) – A Correction Inside a CorrectionOn the daily chart, DMart(Avenue Supermarts Ltd) appears to be unfolding a clean (a)-(b)-(c) correction within the ongoing downtrend from ₹4,949.50.
The initial leg down to ₹4,111 unfolded in five waves, marking Wave (a) of the correction. A relief rally is likely next — an expected Wave (b) move that could face resistance around the ₹4,500–₹4,600 zone.
If this view holds, a final Wave (c) decline may complete the pattern near ₹3,300–₹3,400 — aligning with the previous demand area. RSI is tryin
Hero MotoCorp: Wedge Signals Wave 5 ExhaustionAfter a strong five-wave impulse from ₹3,344 to ₹5,717, Hero MotoCorp appears to have completed a textbook rally, with Wave (5) showing all signs of exhaustion.
The final leg developed into a rising wedge , a common terminal pattern that often precedes short-term pullbacks. Momentum loss is also visible on the RSI , which has been forming lower highs within a descending channel — a classic sign of fading strength.
From an Elliott Wave perspective, the advance from Wave 4 (₹4,195) to Wave 5
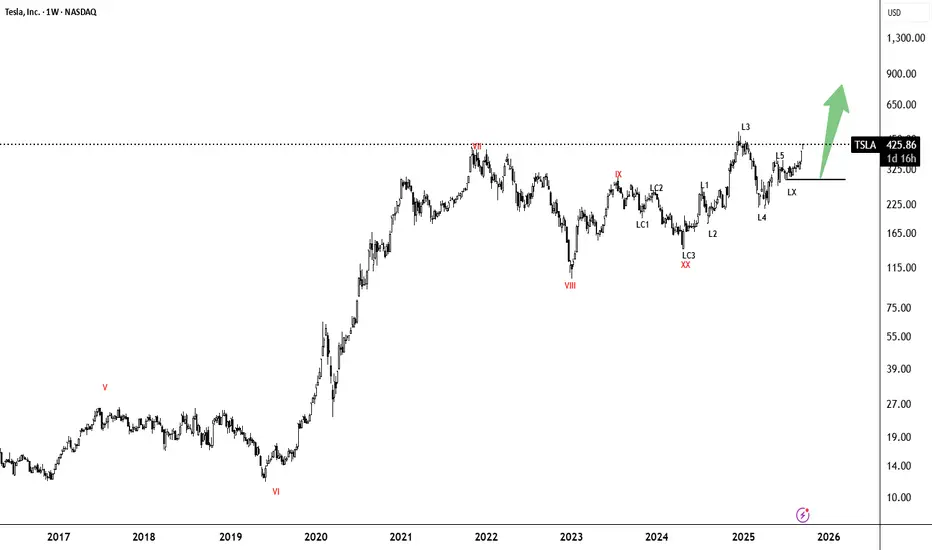
TESLA Bullish Wave CyclesHi everyone
Welcome to intelligent investor, we provide market insights by synchronising and combining all the price action waves from different time frames and gives you single trend.
If you see different keyword in charts, here is the meaning and an explaining video will be made in some time how to read and trade with these waves charts. Still if you have any query , you can leave a comment, i will be happy to answer your query.
Keyword Mean-
S- Short Term Trend
M- Medium Term Trend
L- Long
Bharat Forge Ltd – Flat in Formation, Bulls Still in Command
The impulse from ₹919 - ₹1,362 looks complete, and price is now likely carving a 5-3-5 flat correction as Wave 2.
Wave B has already stretched to the prior Wave 1 peak, keeping regular , expanded , and running flat options open.
Wave C could retrace toward ₹1,192 – ₹1,140 — the 0.382-0.5 fib zone — before the broader uptrend resumes.
Sustained volume and RSI momentum continue to support the larger bullish structure.
A breakout above ₹1,395 invalidates the bearish setup.
Disclaimer:
Godrej Consumer Products: Wave (4) Double Combo Testing SupportWave (4) seems to have evolved as a double combination (W–X–Y), with prices now testing the W–Y trendline support near the 0.618 retracement (~₹1,096).
The structure has been slow and overlapping — typical of a Wave (4) correction.
RSI too rests at channel support , hinting at momentum exhaustion.
A steady hold above this zone could pave the way for Wave (5) , but confirmation is still pending.
Invalidation remains below ₹979.50 .
Strategy:
Watch price behavior near the current support
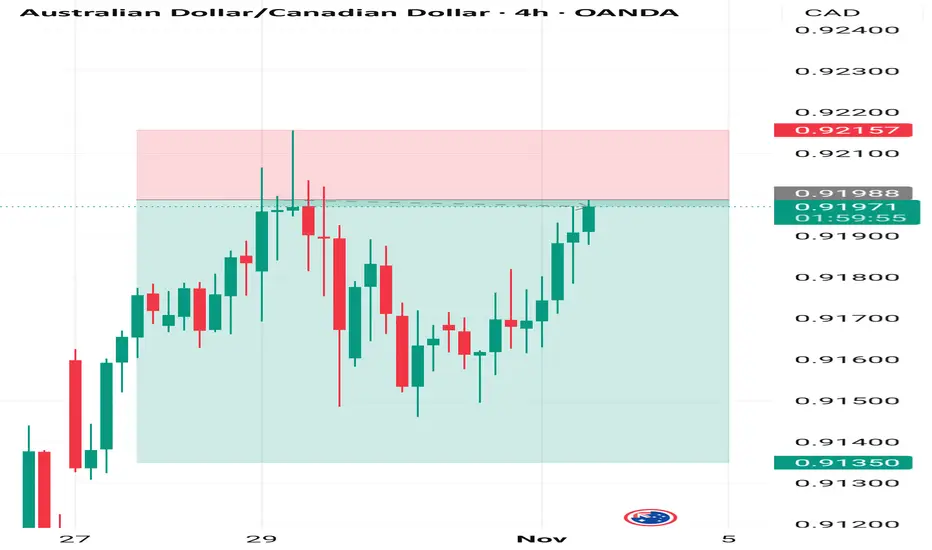
AUD/CAD Approaching Support: Strong Bounce IncomingAUD/CAD has finished a strong 5-wave move to the upside, completing Wave (1)/(A). Since then, price has been moving in a corrective channel and is now forming an A-B-C decline toward the lower support zone. The current structure suggests one more push down to complete Wave C of (2)/(B), where buyers are likely to step back in. Once that final dip finishes, the chart expects a powerful Wave (3)/(C) rally to the upside, targeting new highs. In simple terms: small drop left → correction ends → stro
Netweb Technologies – Riding India’s AI BoomNetweb Technologies just posted another solid quarter — Q2 FY26 profit rose 19.8% YoY to ₹31.4 crore , and revenue climbed 20.9% to ₹303.7 crore .
The company also announced two large AI-infrastructure orders worth ₹2,184 crore , to be executed by FY27 — projects of national importance aimed at strengthening India’s AI compute backbone.
Founded in 1999, Netweb has evolved into one of India’s top high-end computing OEMs , providing full-stack server, storage, and AI-cloud solutions.
With a m
HUDCO - Keep in Radar!Pattern: Continuation Diamond (Bullish)
The stock has been consolidating in a long pattern after an extended uptrend.
This setup signals long-term upside momentum — suitable for investors or position traders rather than short-term trades.
This analysis is for educational and informational purposes only and should not be considered investment advice. Market investments are subject to risks. Please consult your financial advisor before making any investment decisions.
Gold Futures MCX-2H — A Possible Double Zigzag at PlayThe decline from 132,294 unfolded into a clean 5-wave impulse, with Wave 3 extending 1.618 × Wave 1 and Wave 5 measuring nearly equal to Wave 1 — a classic Fibonacci rhythm confirming the completion of Wave W at 117,628.
The ongoing rebound appears corrective, unfolding as an A-B-C structure for Wave X. A move toward the 124–125 k zone could complete Wave C, setting the stage for another 5-3-5 leg lower as Wave Y — potentially mirroring Wave W.
Gold might just be correcting a bit more before i
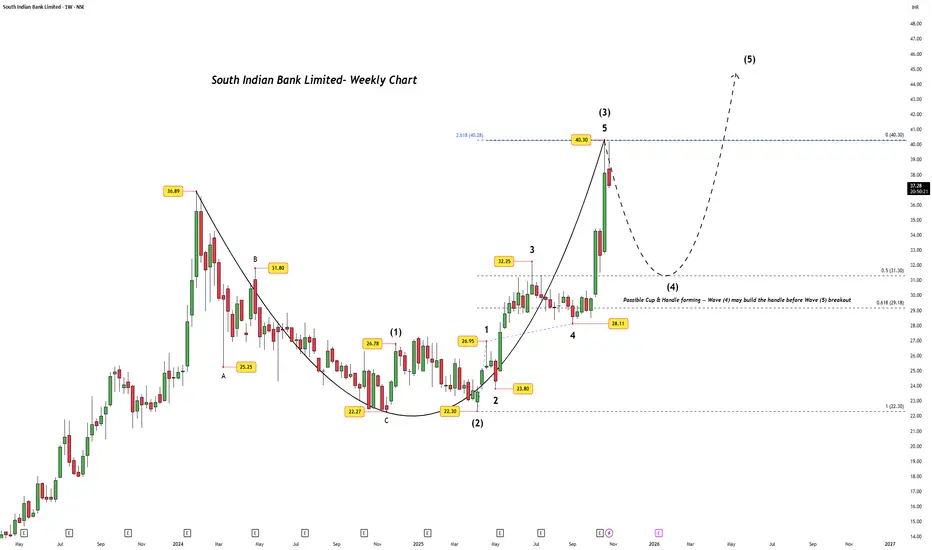
South Indian Bank Ltd — Going South Before It Heads North?After a stellar impulsive rise, South Indian Bank seems to be taking a short trip south — just to refuel for its next northern journey.
The weekly chart unfolds a beautiful Elliott Wave sequence, where Wave 5 of (3) topped precisely at ₹40.30 , aligning exactly with the 2.618 Fibonacci extension of Wave 1 (₹22.30–₹26.95) projected from Wave 4 (₹28.11).
Such precision often signals wave exhaustion — and that’s what we’re seeing now, as prices cool off from the climax of Wave (3). The retra