NIFTY — Bounce Off Major Support, Testing Resistance LadderOverview
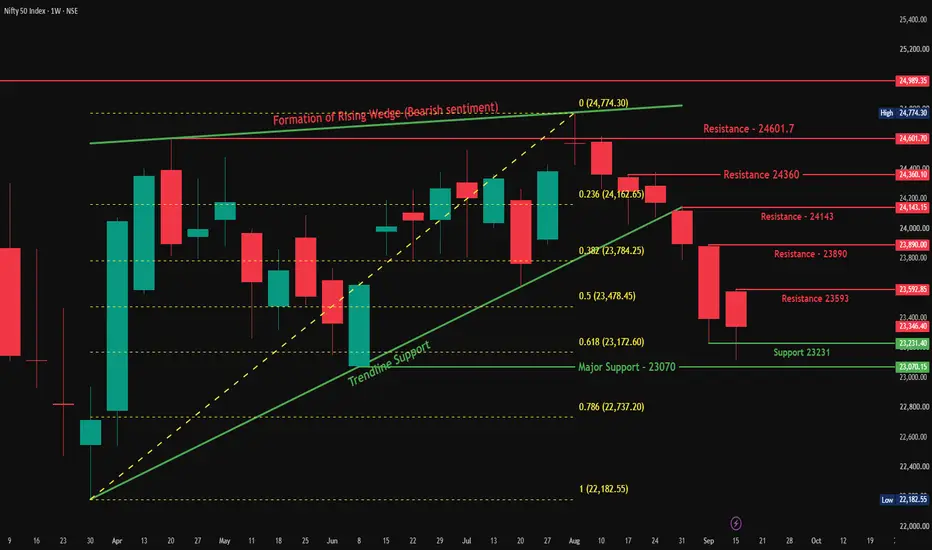
Nifty closed the week at 23,346.40, down 51.70 points or 0.22%, a much smaller decline than recent weeks. Price tested Support 23,231 and held above Major Support (23,070), the confluence zone flagged last week, and has since stabilized within a tight range.
Follow-up on Last Week's View
Last week we flagged the Trendline + 0.618 Fib confluence (23,172) breaking down, with Major Support (23,070) as the next target. That level came close to being tested, with the low landing at 23,116.10, just above Major Support, before buyers stepped in. This week's price action shows the selling pressure easing, with a much smaller weekly decline compared to the prior sharp drops.
Pattern Explanation
Price is now building a small base just above Support 23,231, with a resistance ladder forming overhead: 23,593, then 23,890, then 24,143, and finally the bigger Resistance zone (24,360–24,601.70). Each of these levels will need to be cleared in sequence for the broader downtrend to be meaningfully challenged. The longer-term Rising Wedge breakdown context still applies, so this stabilization needs to be treated as a potential pause rather than a confirmed reversal until more resistance levels are reclaimed.
Key Levels
Resistance Zone: 24,360–24,601.70
Resistance 3: 24,143
Resistance 2: 23,890
Resistance 1: 23,593
Support: 23,231
Major Support: 23,070
Scenarios
Bullish: If Nifty reclaims 23,593 with strength, it would suggest this stabilization is turning into a genuine recovery attempt, opening the path toward 23,890 and 24,143.
Bearish: If Nifty breaks below Support 23,231 and Major Support (23,070), it would confirm the broader downtrend is resuming, with the 0.786 Fib (22,737) as the next level to watch.
Beginner's Lesson
After a sharp decline, a week (or two) of smaller, tighter candles often signals sellers are running out of momentum, at least temporarily. This doesn't automatically mean a trend reversal, it could just be a pause before the next move. The way to tell the difference is watching how price behaves at the first real resistance test, a strong reclaim suggests genuine buying interest, while a weak bounce and quick rejection suggests the pause is just that, a pause.
Conclusion
Nifty is showing early signs of stabilization after a sharp multi-week decline, holding above Major Support and testing a ladder of resistance levels above. A reclaim of 23,593 would be the first sign of a genuine recovery attempt. A break below 23,231 and 23,070 would confirm the downtrend is still in control. This remains a level-to-level market, with the next couple of weeks likely to clarify which scenario is playing out.
This is for educational purposes only and not investment advice. Please do your own research or consult a financial advisor before making any trading decisions. GOLD (XAUUSD) – WEEKLY FIBONACCI ANALYSISBased on the Fibonacci levels marked on your chart, Gold is currently around $4,378, positioned between the 0.786 and 0.618 Fibonacci retracement levels.
🔎 Current Structure
Gold made a strong advance and then entered a correction. The price is now recovering from the $4,000–$4,200 region and is holding above the 0.786 Fib at $4,297.
However, the 0.618 level at $4,576 is the immediate hurdle. The descending trendline shown on your chart is also approaching this area, making $4,576–$4,600 an important confirmation zone.
🟢 Bullish Scenario
A sustained weekly move above $4,576 could open the way toward:
$4,727 → $4,968 → $5,210
The $4,727 (0.5 Fib) level would be the next major resistance after $4,576.
🔴 Bearish Scenario
If Gold gets rejected around $4,576 and falls below $4,297, the correction could extend toward:
$3,942 (Fib 1.0)
A decisive break below $3,942 would significantly weaken the current recovery structure and bring the $2,916 (1.618 extension) into the longer-term Fibonacci picture.
📈 Momentum
RSI is around 50, which is essentially neutral. This means momentum has recovered from the previous weak zone but has not yet established strong bullish momentum.
🎯 My chart-based setup
Bullish confirmation: Weekly close above $4,576
Upside levels: $4,727 → $4,968 → $5,210
Key support: $4,297
Major support: $3,942
So, from the Fibonacci perspective, $4,297–$4,576 is the key decision zone. Holding $4,297 keeps the recovery structure intact, while reclaiming $4,576 would provide stronger bullish confirmation.
💬 Like • Comment • Follow for more setups!
DISCLAIMER:
For educational and informational purposes only. This is my personal technical analysis, not financial or trading advice or a recommendation to buy/sell. Do your own research before trading. Markets involve substantial risk, and all levels, targets and setups are illustrative and not guaranteed. Trade with proper risk management and never rely solely on this analysis.
Trade with logic. Risk with discipline.
Logic Trade Room  Long
Long
XAUUSD Weekly Outlook — Breakout Needs a Retest
Gold is sitting around 4,378 after breaking the H4 descending trendline.
The structure is improving, but price is now testing the 4,385–4,405 immediate resistance area.
The simple read
A pullback toward 4,290–4,320 would be the cleaner test for buyers.
If this zone holds, Gold may recover toward 4,400 first, followed by the major 4,485–4,510 resistance.
A clean break above 4,510 could later expose the H4 resistance around 4,630.
If 4,290 fails, the major swing support near 4,235 becomes important again.
Key price zones
4,385–4,405 — immediate resistance
4,290–4,320 — key pullback support
4,235 — major swing low
4,485–4,510 — major resistance
4,630 — H4 resistance
The trendline break is encouraging, but I prefer a retest before continuation.
Do not chase the breakout.
Wait for the zone.
Can buyers defend 4,30x and open the path toward 4,500? Long 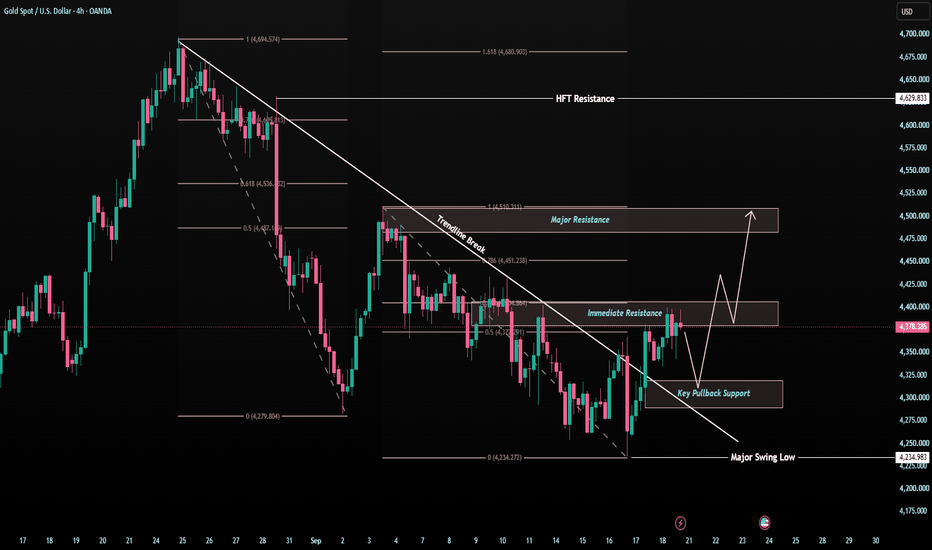
XAUUSD — Weekly Wave 5 Lower Toward 4,060
From Kelly’s view, gold enters next week inside a broader bearish corrective structure. Price is currently trading around 4,378, after recovering from the 4,240–4,250 area, but the rebound is still developing beneath a descending channel and an important sell zone around 4,390–4,410.
The key idea is simple: the current recovery may represent a corrective Wave (4), while the main weekly scenario remains a continuation lower into Wave (5) if sellers defend the upper resistance zone.
⟡ Market structure
Gold remains inside a descending structure after the major peak near 4,680. Recent rebounds have continued to form below important resistance, while the descending channel is still controlling the broader direction.
The current recovery from around 4,240 has pushed price back toward the 4,390–4,410 sell zone, where Fibonacci resistance and the projected Wave (4) completion area overlap.
For next week, 4,334 is the first important support. A clean break below this level could confirm renewed bearish momentum and expose the 4,240–4,255 area.
If that support also fails, the larger Wave (5) projection points toward the 4,045–4,075 zone.
➤ Key levels
◌ Current price area: 4,375–4,385
◌ Main sell zone: 4,390–4,410
◌ Strong resistance: 4,410–4,430
◌ Strong support: 4,334
◌ Secondary support: 4,240–4,255
◌ First target: 4,334
◌ Second target: 4,240–4,255
◌ Main target: 4,045–4,075
◌ Invalidation: Above 4,430
⌁ Elliott Wave view
Wave (1): The first bearish leg pushed price lower from the previous recovery high.
Wave (2): Gold produced a corrective rebound before sellers regained control.
Wave (3): The stronger bearish impulse extended toward the 4,240 area.
Wave (4): The current rebound may be completing near 4,390–4,410, where the descending channel and Fibonacci resistance overlap.
Wave (5): If sellers reject this zone, the final bearish leg could develop toward 4,240 first, followed by the larger 4,045–4,075 target area.
▸ Trading scenario
Preferred bearish scenario
Entry: 4,390–4,410 after bearish confirmation
Stop Loss: Above 4,430
Take Profit 1: 4,334
Take Profit 2: 4,240–4,255
Take Profit 3: 4,045–4,075
The cleaner plan is to wait for rejection from the sell zone rather than chase price lower around current levels. A bearish reaction near 4,390–4,410, followed by a break below 4,334, would strengthen the Wave (5) scenario.
Alternative scenario:
If gold breaks above 4,410–4,430 and holds above the descending structure, the bearish Wave (5) setup may be delayed and price could extend toward the next higher resistance before sellers regain control.
◌ Invalidation
The main bearish scenario would weaken if price gains sustained acceptance above 4,410, and a confirmed break above 4,430 would invalidate the preferred Wave (5) structure for next week.
⌁ Kelly’s view
Kelly’s main view remains bearish for next week while gold stays below 4,390–4,430.
The current rebound may still have room to test the sell zone, but the broader structure favors another bearish leg if sellers defend resistance. 4,334 is the first confirmation level, while 4,240–4,255 remains the next major support before the larger 4,045–4,075 Wave (5) target comes into focus.
Do you think gold will reject the 4,390–4,410 sell zone first, or break 4,334 directly next week? Short 
 Long
Long
NIFTY — Wedge Breakdown Confirmed, Major swing Support in FocusOverview
Nifty closed the week at 23,398.10, down 499.60 points or 2.09%, extending the sharp breakdown from recent weeks. Price has now broken decisively below the entire wedge structure and multiple support zones, with the multi-month rising trendline support the next major level in sight.
Follow-up on Last Week's View
Last week we flagged Nifty needing strength above 24,050 for a bullish case, with a break below the trendline and Immediate Support opening the door lower. That bearish path has played out in full, price broke through 23,818, then 23,600, and this week's low of 23,231.40 has pushed well past the 0.5 Fib level (23,478.45) too, confirming the Rising Wedge has resolved firmly to the downside.
Pattern Explanation
The Rising Wedge breakdown is now well underway, with price cutting through three support-turned-resistance zones in quick succession (23,818, 23,600, and 0.5 Fib at 23,478). The next meaningful level is the rising Trendline Support, which is converging with the 0.618 Fib (23,172.60) in the coming weeks, a genuine confluence zone worth watching closely.
Key Levels
Resistance 3: 23,818
Resistance 2: 23,600
Resistance 1 / 0.5 Fib: 23,478
Support (Trendline + 0.618 Fib confluence): 23,172
Major Support: 23,070.15
Deeper Fib: 0.786 (22,737.20)
Scenarios
Bullish: If Nifty reclaims 23,600 with strength, it would suggest this leg of selling is exhausting, and price could work back toward 23,818 and the 0.382 Fib (23,784).
Bearish: If Nifty closes below the trendline and 0.618 Fib confluence (23,172), it would confirm the breakdown is extending, with Major Support (23,070) as the immediate test, and 0.786 Fib (22,737) as a deeper target if weakness continues.
Beginner's Lesson
A trendline that's held for many months, like this one since March, carries real weight when it's finally tested after a sharp breakdown. The fact that it's now converging with a Fibonacci level (0.618) makes this an even stronger confluence zone. These multi-month structural tests often produce either a strong bounce (since so many traders watch the same level) or a decisive breakdown that accelerates the move, either way, it's a zone worth paying close attention to rather than ignoring.
Conclusion
Nifty has confirmed a clean wedge breakdown, cutting through multiple support zones in just a couple of weeks. The focus now shifts to the Trendline + 0.618 Fib confluence near 23,172, an important test for the broader uptrend structure. Holding this zone would keep the bigger picture intact; losing it would open the door toward deeper Fib levels and Major Support.
This is for educational purposes only and not investment advice. Please do your own research or consult a financial advisor before making any trading decisions. XAUUSD — Bullish Wave Structure Toward 4,490
From Kelly’s view, gold is rebuilding a bullish structure after breaking away from the previous descending trendline. Price is trading around 4,391, and the recent recovery suggests buyers are trying to establish a new impulsive sequence toward the upper Fibonacci resistance zones.
The key idea is simple: the main trend may stay bullish while price continues to form higher lows, with 4,405–4,415 acting as the first important resistance test before a potential expansion toward 4,459 and the 4,488–4,497 area.
⟡ Market structure
Gold has recovered strongly from the 4,240–4,260 swing-low area and is now trading above the former descending trendline.
The short-term structure has shifted toward higher lows, while the projected Elliott Wave path suggests another bullish impulse may be developing.
The first obstacle is the Fibonacci resistance zone around 4,405–4,415. If buyers can absorb selling pressure here, price could continue toward 4,433 and 4,459.
Above that, the major resistance and projected Wave (5) completion zone sits around 4,488–4,497, close to the 2.618 Fibonacci extension.
➤ Key levels
◌ Current price area: 4,390–4,395
◌ Main bullish retest zone: 4,375–4,390
◌ Strong support: 4,335–4,350
◌ First resistance: 4,405–4,415
◌ Key resistance: 4,433
◌ First target: 4,459
◌ Main target: 4,488–4,497
◌ Invalidation: Below 4,335
⌁ Elliott Wave view
Wave (1): The current recovery may extend toward the 4,405–4,415 resistance area.
Wave (2): A controlled pullback toward approximately 4,375–4,390 could follow if buyers take profit near resistance.
Wave (3): If the pullback holds and bullish confirmation appears, the stronger expansion could target 4,459.
Wave (4): Price may then consolidate or retrace toward the 4,430–4,440 area.
Wave (5): The final bullish leg could extend toward 4,488–4,497, where the major Fibonacci resistance and projected Wave (5) target overlap.
▸ Trading scenario
Preferred bullish scenario
Entry: 4,375–4,390 after bullish confirmation
Stop Loss: Below 4,335
Take Profit 1: 4,410–4,415
Take Profit 2: 4,459
Take Profit 3: 4,488–4,497
The cleaner plan is to wait for buyers to defend the projected Wave (2) retracement area rather than chase price directly into Fibonacci resistance.
Alternative scenario:
If gold breaks and holds above 4,415 without a deeper pullback, a confirmed retest of this zone could support continuation toward 4,433–4,459.
◌ Invalidation
The bullish structure would weaken if price loses the 4,335–4,350 support area and begins trading back below the recent higher-low structure. A sustained break below 4,335 would invalidate the preferred bullish wave sequence.
⌁ Kelly’s view
Kelly’s main view remains bullish while gold continues to defend its higher-low structure above 4,335–4,350.
The immediate test is 4,405–4,415. If buyers can break and hold above this Fibonacci resistance, the next wave may open the way toward 4,459, followed by the larger 4,488–4,497 Wave (5) target.
Do you think gold will complete this bullish wave structure toward 4,490, or retest the key support zone first? Long 
 Long
Long
 Long
Long
 Long
Long
Long 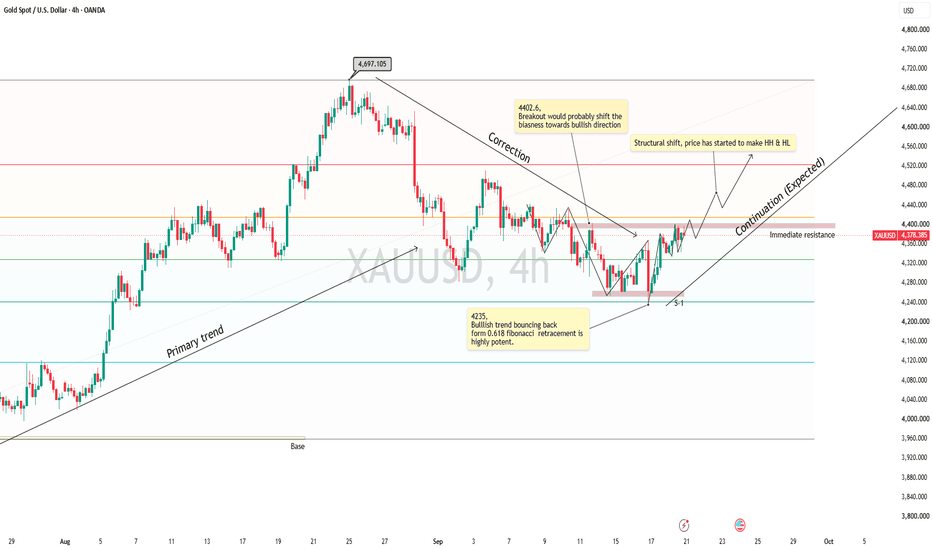
ANGEL ONE LTD – DAILY CHARTPrice is consolidating near the 0.382 Fibonacci level. A sustained move above ₹295.70 may support a bullish move toward the next resistance levels.
🎯 TRADE LEVELS:
🟢 Entry: ₹295.70
🛑 Stop Loss: ₹291.80
🎯 Target 1: ₹300.55
🎯 Target 2: ₹308.35
📌 Wait for candle confirmation. Trail SL as price moves in your favor.
DISCLAIMER :
This content is created by Logic Trade Room for educational and informational purposes only.
It is not financial advice, investment advice, trading advice, or a recommendation to buy or sell any security, index, futures contract, or options contract.
Trading and investing in the stock market involve substantial risk, including the risk of losing your entire invested capital. Past performance does not guarantee future results.
The entry, stop-loss, and target levels mentioned are illustrative chart-based levels and may change with market conditions. No trade setup or market prediction is guaranteed to be accurate.
Always conduct your own research, verify live market prices, and consult a qualified financial advisor before making investment decisions.
Trade with logic. Risk with discipline.
Logic Trade Room  Long
Long
CDSL | 4H Bullish Reversal Setup, Demand Zone + GAP Retest Central Depository Services (India) Ltd. — CDSL
CDSL is currently approaching an important 4H demand/support zone after a sharp correction from the ₹1,430–₹1,440 area.
The recent price action shows a reaction from the lower support zone, with the stock attempting to stabilize around the marked GAP/FVG area. The setup is based on a potential support retest → reversal → move toward higher resistance.
🔍 Technical Structure
🔹 4H demand zone: around ₹1,277–₹1,310
🔹 GAP/FVG zone: around ₹1,300–₹1,330
🔹 Immediate resistance: around ₹1,380
🔹 Major resistance: ₹1,410–₹1,445
🔹 Price is being monitored for a bullish reaction from the support area
🎯 Trade Thesis
The key level to watch is the ₹1,300–₹1,330 zone.
If buyers successfully defend this area and price reclaims the nearby resistance, it could open the possibility of a move toward the ₹1,380 zone, followed by the higher resistance area around ₹1,410–₹1,445.
The idea becomes invalid if price decisively breaks and sustains below the marked demand zone.
Patience is the trade. Wait for confirmation rather than chasing the price.
This is a technical-analysis setup for educational purposes, not a guaranteed prediction. Always manage position size and risk according to your own trading plan.
 Long
Long
BITCOIN (BTC/USD) – DAILY CHART - Fibonacci AnalysisBitcoin is consolidating above the 0.618 Fibonacci support. A sustained breakout above $77,987 may open the way toward higher resistance levels.
🎯 TRADE LEVELS:
🟢 Entry: Above $77,987
🛑 Stop Loss: $74,616
🎯 Target 1: $82,281
🎯 Target 2: $94,681
📌 Wait for daily candle confirmation above resistance. Trail SL as price moves in your favor.
DISCLAIMER :
This content is created by Logic Trade Room for educational and informational purposes only.
It is not financial advice, investment advice, trading advice, or a recommendation to buy or sell any security, index, futures contract, or options contract.
Trading and investing in the stock market involve substantial risk, including the risk of losing your entire invested capital. Past performance does not guarantee future results.
The entry, stop-loss, and target levels mentioned are illustrative chart-based levels and may change with market conditions. No trade setup or market prediction is guaranteed to be accurate.
Always conduct your own research, verify live market prices, and consult a qualified financial advisor before making investment decisions.
Trade with logic. Risk with discipline.
Logic Trade Room Long 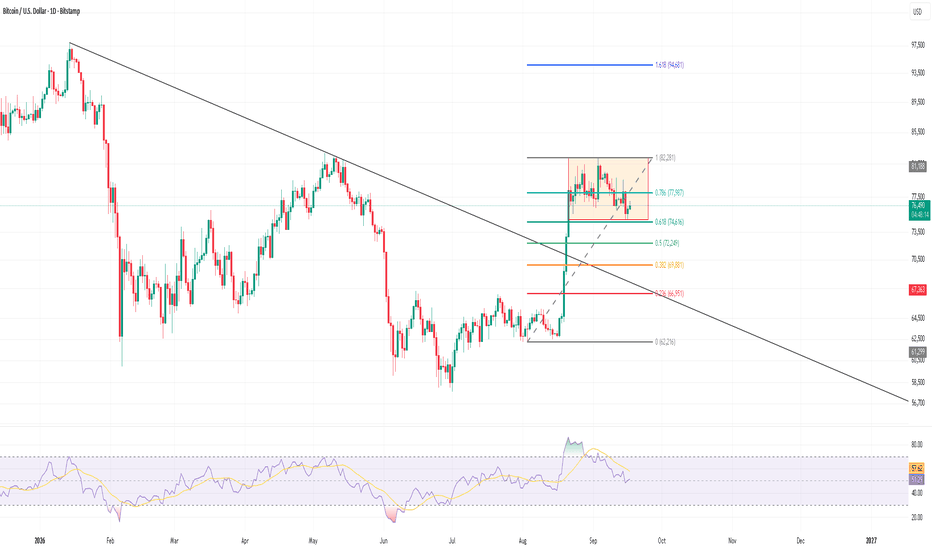
One Chart, Multiple Patterns : Are You Seeing the Full StructureA chart rarely contains just one pattern, one trendline, or one important level.
The real skill is learning how these structures interact.
This historical chart begins with a clear Swing Low and Swing High, allowing us to map the larger move using Fibonacci retracement. I am Using Older than 3 Months chart .
Once plotted, an interesting area appears.
The 50%–61.8% retracement region, highlighted in white, creates an important Fibonacci confluence zone. Remember, 61.8% is a Fibonacci ratio, while 50% is conventionally used by traders as a retracement level.
Now look beyond Fibonacci.
The two descending white lines create a falling channel-like structure, capturing the shorter-term price contraction following the larger upward move.
But zoom out conceptually and another structure appears.
The rising red boundary extending from the swing high forms part of a broader expanding structure. This is where chart reading becomes interesting: the same candles can participate in a smaller pattern while simultaneously sitting inside a much larger one.
And notice where the structures begin interacting.
The lower white boundary repeatedly approaches the highlighted 50%–61.8% Fibonacci zone, bringing price structure and Fibonacci retracement into the same area.
That is the real lesson from this chart.
Technical structures don't have to exist independently.
 Long
Long
S&P 500: Fed Speaks, Chart Hits 0.618The Fed just blinked hawkish — and the market moved almost exactly where the chart said it might.
On September 16, the US Fed raised rates by 25 bps — the first hike in three years. The move itself was already priced in (92% odds going in). What actually shook the market was two words from Fed Chair Kevin Warsh: he said policy needs to support a "timelier return" to the 2% inflation goal. Markets read that as "more hikes are coming, and soon" — and that's what sent the Dow down 630+ points and dragged the S&P 500 lower with it.
Here's where it gets interesting for chart readers: the S&P didn't just fall — it fell and stopped almost exactly at the 0.618 Fibonacci retracement (7,505.98) of the entire rally from the May low. 0.618 is called the "Golden Ratio" for a reason — it shows up everywhere in nature, and in markets it's the most-watched retracement level of all. So many traders have orders sitting near it that it often becomes a self-fulfilling floor or ceiling. That's exactly what played out here.
The wave count on the chart
Zooming out, here's the structure I'm tracking:
Wave (I) → (II) : The May–August move up (I) got corrected by an a-b-c "Running Flat." . Two tells confirm this: wave (b) made a slightly higher high than wave (I), and wave (c) barely dipped below wave (a)'s low before buyers stepped back in. A shallow, reluctant wave (c) is a classic sign the bigger trend is still up — running flats usually show up right before a strong wave 3.
Wave (1) → (2) : After (II) bottomed near 7,313.92, price rallied to 7,816.70 (wave 1), then pulled back — and that pullback is exactly the move the Fed news triggered, landing right on the 0.618 line at 7,505.98.
Why this level matters
7,313.92 (the wave II low) is the line in the sand. As long as price holds above it, this bullish count stays valid. A daily close below it would mean this labeling needs a rethink.
If the count holds
Using the wave (II)-low-to-wave (2)-low as the base of a trend channel, and projecting a simple 1x extension of wave (1) from the wave (2) low, the first target zone lines up around 8,010. Third waves often run further than 1x — so if this move has real strength, a stretch target near 8,300 (1.618x) isn't out of the question either. These are reference zones to watch, not predictions of exact outcomes — wave 3 needs to actually break above 7,816.70 with strong, clean structure before this becomes more than a scenario.
Bottom line
Macro (hawkish Fed) and technicals (Golden Ratio holding, running flat completing) lined up perfectly this week. The structure stays bullish above 7,313.92. Above 7,816.70 with strength would be the next confirmation to watch for.
Disclaimer:
I am not a SEBI registered research analyst. This post is shared only for education and learning purposes, based on my personal reading of the chart. It is not a buy or sell recommendation. Please do your own research or speak to a registered advisor before taking any trading decision.  Long
Long
NIFTY: Two-Sided Trading Plan for Tomorrow | Bearish BiasNIFTY closed at 23,270.60, below the important 50% Fibonacci level at 23,354.50. For tomorrow, the 23,335–23,355 zone is the key decision area.
Why is this a No Trade Zone?
This zone is important because the POC of the last two sessions has been developing around this area, showing significant trading activity.
Additionally, today's high was unable to clear this zone, which makes it an important resistance/decision area.
For this reason, I would avoid taking a trade blindly inside 23,335–23,355. Let price show acceptance or rejection first.
🔴 Bearish Scenario — Preferred Bias
The Developing POC is around 23,287.35.
If NIFTY gives a 15-minute candle close below 23,287 and sustains below the POC, it can provide confirmation for the bearish scenario.
T 1 - 23,255
T 2 - 23,218
T 3 - 23,198–23,180
The key point is that a temporary move below POC is not enough — wait for the 15-minute candle confirmation.
🟢 Bullish Scenario — Confirmation Required
If NIFTY reclaims 23,355–23,360 and gives a 15-minute candle close above the No Trade Zone:
T1 - 23,375–23,400
T2 - 23,410
T3 - 23,480 — 23.6% Fibonacci
Sustained acceptance above the zone would weaken the immediate bearish structure.
Gap-Up / Gap-Down Plan
GAP-UP: Don't chase the opening move. Wait for a retracement toward 23,335–23,355. If the zone holds as support and price confirms strength, the bullish scenario can be considered.
GAP-DOWN: Don't chase the first sell-off. Wait for a retracement toward the No Trade Zone. If the zone acts as resistance and price rejects it, bearish continuation can be considered.
Key Levels
23,480.35 — 23.6% Fib
23,410.75 — 38.2% Fib
23,354.50 — 50% Fib / Key decision level
23,335–23,355 — No Trade Zone
23,287.35 — Developing POC / Bearish trigger
23,218.10 — Lower reference
23,116.10 — Recent swing low
⚡ Tomorrow's Plan
BUY: Confirmation above 23,355–23,360
SELL: Confirmation below 23,287, or rejection from the No Trade Zone after a gap
AVOID: Chasing the initial gap or trading blindly inside 23,335–23,355
Personal bias: Bearish.
But the market decides — let price confirm the direction.
Educational market structure and trading plan for discussion only. Not investment advice. XAUUSD — Bullish Recovery Toward 4,410Gold is showing a bullish recovery after reacting strongly from the lower liquidity area. From Kelly’s view, the chart suggests that XAUUSD may be forming a new upside Elliott Wave structure after breaking out from the lower side of the previous bearish channel.
The key idea is simple: if gold continues to hold above the Buy zone liquidity, the recovery structure can continue toward the next resistance levels.
⟡ Market structure
Gold is currently trading around 4,310–4,318, after bouncing from the Buy zone liquidity near 4,275–4,290. This reaction shows that buyers are trying to defend the lower support area and build a new bullish base.
The first resistance to watch is around 4,340–4,355, marked as the short-term sell scalping area. If gold breaks above this zone, the next important level is the strong resistance near 4,367.
A clean move above 4,367 would strengthen the bullish structure and open the way toward the 4,405–4,415 Resistance done wave 5 zone. If momentum continues, the larger upside target remains near 4,485–4,500.
➤ Key levels
◌ Current price area: 4,310–4,318
◌ Buy zone liquidity: 4,275–4,290
◌ Short-term resistance: 4,340–4,355
◌ Strong resistance: 4,367
◌ Main wave 5 target: 4,405–4,415
◌ Extended bullish target: 4,485–4,500
◌ Bullish invalidation: below 4,255
⌁ Elliott Wave view
The chart shows a possible bullish Elliott Wave recovery.
Wave (1) may have started from the lower liquidity area and pushed price toward 4,317.
Wave (2) may have completed after the retest near 4,275–4,290.
If this buy zone holds, wave (3) may continue toward 4,340–4,355 and 4,367.
Wave (4) could create a short pullback after testing resistance.
Wave (5) may then extend toward 4,405–4,415.
If buyers remain strong above that area, gold may later attempt the larger resistance zone around 4,485–4,500.
▸ Trading scenario
Preferred bullish scenario
Entry: Buy around 4,275–4,290 if price gives bullish confirmation from the liquidity zone
Stop Loss: Below 4,255
Take Profit 1: 4,340–4,355
Take Profit 2: 4,367
Take Profit 3: 4,405–4,415
Take Profit 4: 4,485–4,500
Alternative entry
If gold breaks above 4,340–4,355 and retests this area as support, buyers may look for continuation toward 4,367 and 4,405–4,415.
◌ Invalidation
The bullish view becomes weaker if gold breaks below 4,255 and fails to reclaim the buy liquidity zone. In that case, the recovery structure may fail and price could return to the lower bearish channel.
⌁ Kelly’s view
Kelly’s main view is bullish while gold holds above 4,275–4,290. The market is showing a strong reaction from the lower liquidity area, and the current pullback may only be preparation for the next upside wave.
If buyers defend the buy zone and price breaks above 4,340–4,355, gold may continue toward 4,367, then 4,405–4,415. The larger bullish target remains near 4,485–4,500 if momentum expands.
Do you think gold will break above 4,367 first, or retest the buy zone once more before the next rally? Long 
XAUUSD — Breakout Is Done, Can 4,317 Hold?
Gold is trading around 4,337 after a strong M30 recovery from the 4,278 area.
Price has pushed back above the previous short-term structure and is now holding above the breakout zone near 4,317.
The recovery is encouraging, but the market is approaching an important Fed decision.
Rate expectations remain elevated, Treasury yields are still near 5%, and the U.S. dollar remains firm. Gold has still managed to recover, showing that buyers are not completely giving up control.
But a breakout candle alone is not enough.
The retest is the real test.
The simple read
M30 has started to shift away from the previous bearish structure.
Gold first reacted from the 4,278 OB area and then built a strong bullish leg back above 4,317.
That level now changes role.
Instead of resistance, 4,317 becomes the first breakout support buyers need to defend.
The current price near 4,337 is already around the 0.786 Fibonacci area of the latest recovery leg, so I would not chase the move here.
The cleaner setup would be a controlled pullback.
If Gold returns toward 4,317 and buyers defend the zone, the bullish recovery structure remains healthy.
The first upside test is around 4,354.
This is the nearest visible resistance and the first level where short-term sellers may react.
If buyers can break and hold above 4,354, the next important area becomes 4,390–4,400, with 4,396 as the major resistance decision level.
Above that sits the larger 4,425–4,431 upper resistance zone.
That is where the recovery would face a much stronger test.
Key price zones
Current price area: 4,337
Breakout support: around 4,317
Order Block support: around 4,278
Major structure support: 4,253–4,258
First resistance test: around 4,354
Major resistance: around 4,396
Upper resistance: around 4,431
Bullish pressure improves above: 4,354
Recovery structure weakens below: 4,317
Trading plan
Buy reaction scenario
If Gold pulls back toward 4,317:
I will watch whether buyers can defend the breakout structure.
A clean rejection, slowing downside momentum or a strong reclaim from this area can support another bullish leg toward 4,354.
If 4,354 then breaks and holds, attention can shift toward 4,396.
The important point is not to chase price at 4,337.
Wait for the retest.
Sell reaction scenario
If Gold reaches 4,354 but cannot hold above it:
A short-term rejection may rotate price back toward 4,317.
This would not automatically destroy the recovery structure as long as breakout support continues to hold.
The larger seller test remains around 4,396.
Breakout scenario
If Gold clears 4,354 with strong acceptance:
The M30 recovery becomes more convincing.
4,396 becomes the next major target and decision zone.
A clean break above 4,396 could then expose the upper resistance around 4,431.
Breakdown scenario
If 4,317 fails with clear bearish continuation:
The breakout loses quality.
I would then watch the 4,278 OB as the next important buyer reaction area.
Below that, 4,253–4,258 remains the major structure support.
The short-term structure is improving.
But the easy part of the bounce may already be behind us.
4,317 is the level buyers need to protect.
4,354 is the first seller test.
4,396 is the major breakout decision.
4,431 is the upper recovery objective. Long 
 Long
Long