Long
Long
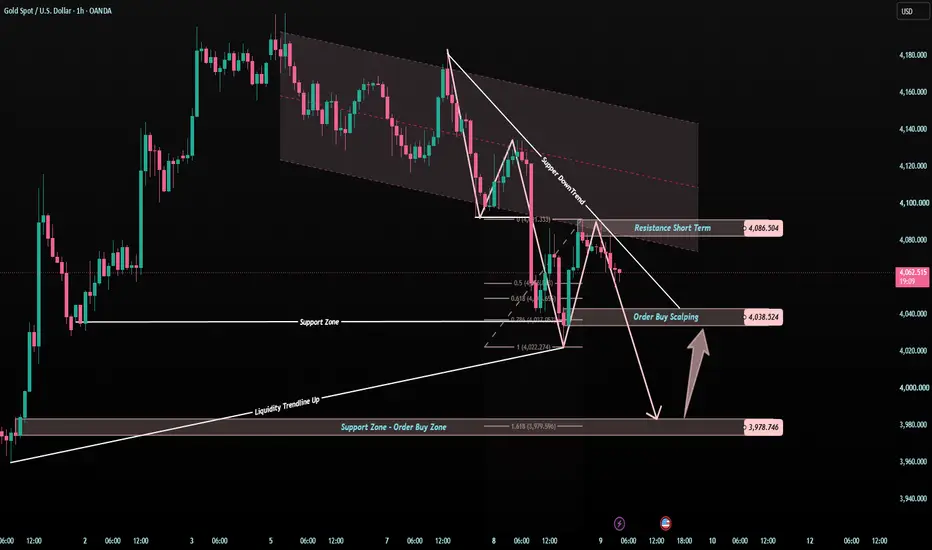
XAUUSD — Is 3,978 the Trap Zone?Gold is still under pressure, but this is exactly where the chart becomes more interesting.
Price is trading below the short-term downtrend line and has not been able to reclaim the 4,086 resistance zone.
That means sellers are still controlling the short-term structure.
But after a strong correction, the best question is not:
“Should I sell now?”
The better question is:
“Where could buyers react next?”
For me, today’s chart has two important downside zones.
The first one is 4,038.
The deeper and more important one is 3,978.
Market structure
Gold is still moving inside a short-term bearish correction.
The descending trendline is pressing price lower.
As long as gold stays below 4,086, the recovery attempt remains weak.
The current price area around 4,055 - 4,065 is not the cleanest place to chase.
It is already between resistance and support.
That is why patience matters here.
Key price zones
Current price area: 4,055 - 4,065
Short-term resistance: 4,086
First buy reaction zone: 4,038
Major support / order buy zone: 3,978
Bearish pressure weakens above: 4,086
Trading plan
📉 If gold stays below 4,086
The correction can continue.
The first area to watch is 4,038.
If this level fails, gold may continue toward 3,978.
I do not want to chase the sell late.
I prefer waiting for price to reach a better reaction zone.
📈 If gold reacts from 4,038
A short-term bounce may appear.
But this is only a reaction setup unless gold can reclaim 4,086.
Without a clear reaction, there is no reason to force a buy.
📈 If gold reaches 3,978
This is the zone I will watch most carefully.
It is a deeper support area and a possible order buy reaction zone.
If buyers defend 3,978 with clear price action, gold may try to build a stronger recovery.
If 3,978 fails, the chart needs more time before the bullish structure can return.
Tiara’s View
Sometimes the cleanest trade is not at the current price.
It is waiting lower, where the market has a real reason to react.
Today, 4,038 is the first test.
But 3,978 is the zone that could decide whether gold is only correcting or starting a deeper breakdown.
Main view:
Gold remains under correction while below 4,086.
I am watching 4,038 first, then 3,978 for the stronger reaction.
Confirmation first.
Trade second.
No confirmation = no trade.
Do you think gold will defend 4,038, or is 3,978 the real trap zone?  Short
Short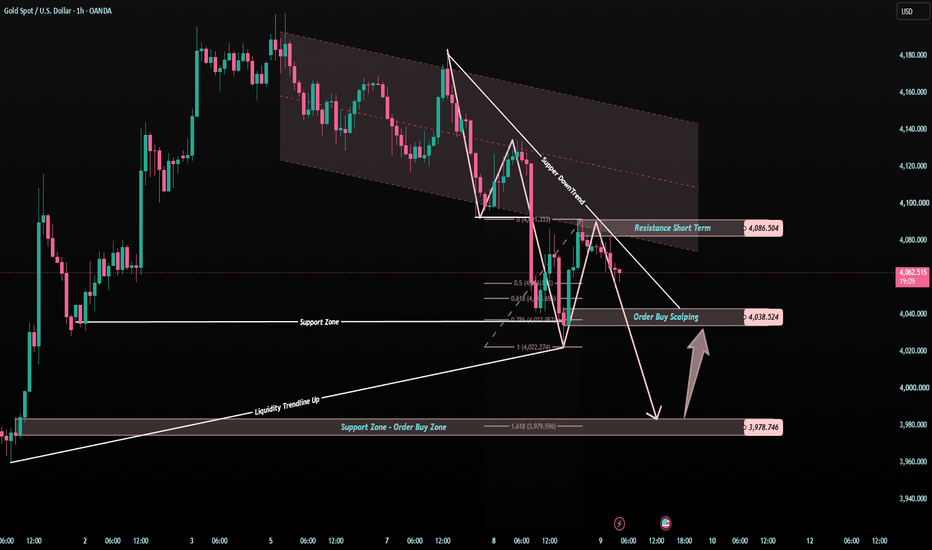
XAUUSD — Corrective Recovery After Rejecting $4,022 Low
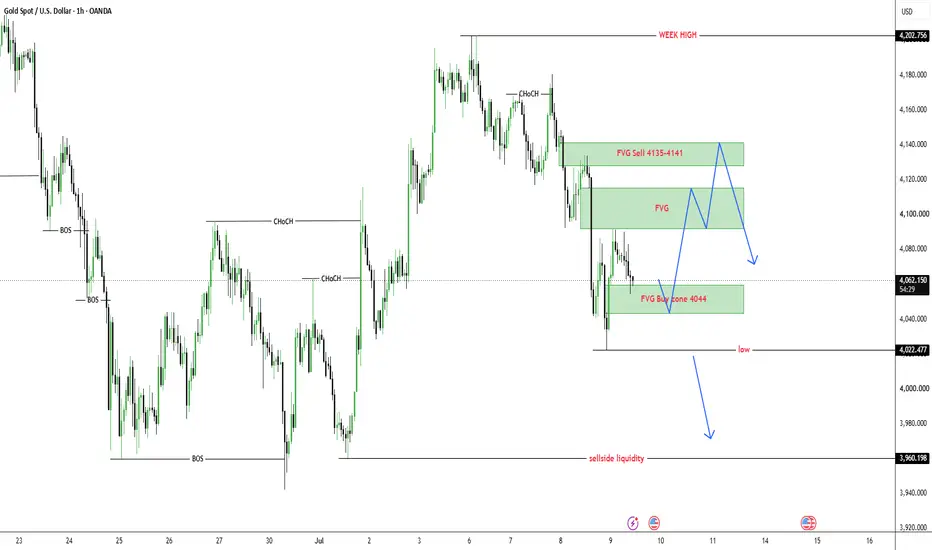
Gold is trading around $4,062 after rejecting the lower area near $4,022. The market failed to continue the immediate downside move, so today gold may first create a corrective recovery before deciding the next larger direction.
From an SMC perspective, gold has already swept the lower liquidity near $4,022 and reacted from the FVG buy zone around $4,044–$4,060. This reaction shows that sellers may be losing short-term momentum, but the overall structure is not fully bullish yet. Price still needs to reclaim the upper FVG areas before a stronger recovery can be confirmed.
The main plan for today is to watch how gold reacts after the rejection from $4,022. If price holds above the FVG buy zone and forms bullish confirmation, gold may correct higher toward the middle FVG area first, then the FVG sell zone around $4,135–$4,141. That upper zone remains important because sellers may defend the structure there.
Buy setup 1
Condition:
Gold holds above the FVG buy zone around $4,044–$4,060 and forms bullish rejection with lower timeframe MSS / CHOCH.
Entry: $4,044–$4,060
SL: below $4,022
TP1: $4,090
TP2: $4,110–$4,115
TP3: $4,135–$4,141
Buy setup 2
Condition:
If gold breaks above the middle FVG area and retests it as support, the corrective recovery can continue toward the upper sell zone.
Entry: above $4,115 after breakout retest
SL: below $4,080
TP1: $4,135–$4,141
TP2: $4,160
TP3: $4,202 weekly high
Sell setup 1
Condition:
Gold reaches the FVG sell zone around $4,135–$4,141 and shows clear bearish rejection.
Entry: $4,135–$4,141 after rejection
SL: above $4,160
TP1: $4,090
TP2: $4,044–$4,060
TP3: $4,022
Sell setup 2
Condition:
If gold fails to hold above $4,022 and breaks the low cleanly, the correction view becomes invalid and sell-side liquidity may become the next target.
Entry: below $4,022 after breakdown retest
SL: above $4,060
TP1: $4,000
TP2: $3,980
TP3: $3,960 sell-side liquidity
Key levels
Current price area: $4,062
FVG buy zone: $4,044–$4,060
Rejected low: $4,022
Middle FVG reaction zone: $4,090–$4,115
FVG sell zone: $4,135–$4,141
Short-term resistance: $4,160
Weekly high liquidity: $4,202
Sell-side liquidity: $3,960
Bullish correction confirmation: clean break above $4,115
Stronger bullish confirmation: clean break above $4,141
Bearish continuation confirmation: clean break below $4,022
My current view is that gold may correct higher today after rejecting the decline at $4,022. The Prime Gold plan is to avoid selling low after the sweep and wait for either a buy confirmation around $4,044–$4,060 or a clearer sell reaction from $4,135–$4,141. If the $4,022 low breaks cleanly, the downside path toward $3,960 becomes active again.
No confirmation, no trade.
Long 
MASON XAUUSD – Intraday Bearish Bias Below Ichimoku
XAUUSD is trading around 4,057 after losing short-term bullish momentum. Price is now moving below the Ichimoku structure, while the recovery attempt is still weak and has not confirmed a bullish reversal.
The priority view for today remains sell with the short-term bearish structure, especially if gold retests the nearby sell zone and fails to break back above Ichimoku resistance.
Technical View
Gold is currently trading below the Ichimoku cloud and below the short-term resistance structure. This shows that buyers have lost control for now, and the market is still under bearish pressure in the intraday view.
The recent drop from the 4,130–4,140 area created a clear bearish impulse. After that, price only recovered weakly into the 4,060–4,075 zone, which is marked as the sell zone on the chart.
This sell zone is important because it sits near the Fibonacci reaction area and under the Ichimoku resistance. If price rejects from this area, it may confirm another lower high before continuing lower.
The 4,035–4,040 area is the first short-term liquidity reaction zone. If gold breaks below this level, selling pressure may continue toward the buy scalping liquidity area around 4,015–4,025.
The 3,984 level is also important because it is marked as a short-term price reaction zone. If bearish momentum remains strong, this area may become the next intraday target before price moves toward the deeper key support around 3,945–3,955.
Key Zones
Current price: 4,057
Sell zone: 4,060–4,075
Ichimoku resistance area: 4,130–4,147
Short-term liquidity: 4,035–4,040
Buy scalping liquidity: 4,015–4,025
Price reaction zone: 3,984
Key support zone: 3,945–3,955
Invalidation: above 4,095
Trading Plan
Sell Priority: 4,060–4,075
Condition: wait for bearish rejection, failed recovery above the sell zone, or price staying below the Ichimoku structure.
SL: above 4,095
TP1: 4,035–4,040
TP2: 4,015–4,025
TP3: 3,984
Final target: 3,945–3,955
Alternative Scenario
If gold breaks below 4,035 directly, wait for a retest of this level as resistance before looking for sell continuation toward 4,015 and 3,984.
Buy View
Buy is not the priority while price remains below the Ichimoku structure and under the sell zone. A short-term buy scalp may appear around 4,015–4,025 or 3,984, but it needs clear bullish confirmation first.
Final View
Overall, gold is still moving inside a short-term bearish structure. The cleaner plan is to wait for price to retest the 4,060–4,075 sell zone and watch for rejection. As long as gold stays below Ichimoku and below 4,095, the downside path toward 4,035, 4,015, and 3,984 remains in focus.
Will gold reject from the sell zone again, or break above Ichimoku to weaken the intraday bearish view?
Short 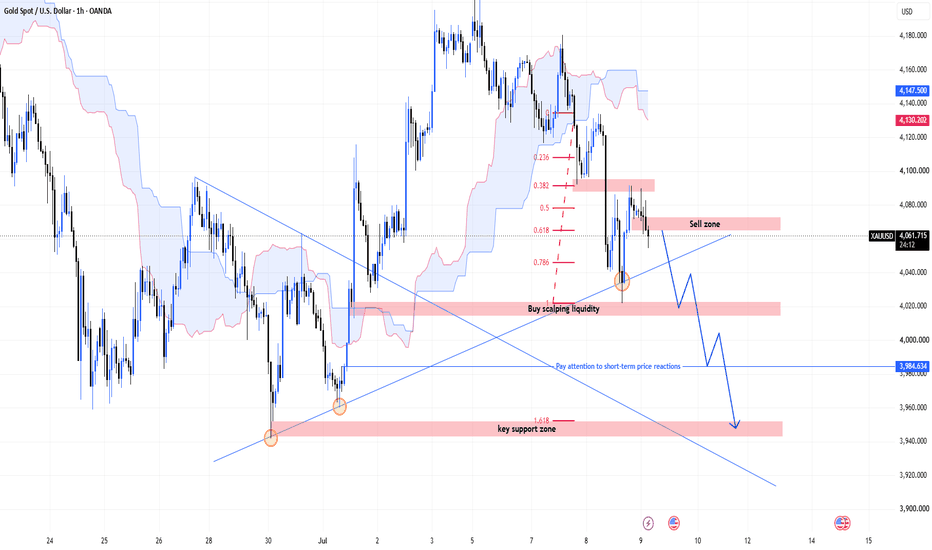
MASON XAUUSD – Short-Term Sell Bias Below Ichimoku
XAUUSD is trading around 4,125 after failing to show a clear bullish continuation. Price is still under the Ichimoku resistance area, and the buying pressure looks weak around the current recovery zone.
The priority view remains sell with the short-term trend, especially if gold retests the sell order liquidity zone near the descending trendline and Fibonacci area.
Technical View
Gold is currently moving below the Ichimoku structure, which shows that buyers have not fully regained control. The cloud and Ichimoku lines above price are acting as dynamic resistance, so any recovery should still be treated carefully.
The recent bounce from 4,096 shows that buyers reacted from support, but the move is not strong enough to confirm a clean bullish reversal. Price is still below the trendline resistance, and the structure remains corrective.
The 4,135–4,145 area is the key sell order liquidity zone on the chart. This zone is important because it aligns with the descending trendline, Fibonacci reaction area, and short-term Ichimoku resistance. If gold reaches this area and rejects, it may confirm another lower high before continuation lower.
The 4,096 level is the nearest support. If price breaks below this area, bearish pressure may continue toward the Fibonacci 50 reaction zone around 4,070–4,080.
The deeper downside target is around 4,035–4,045, which is marked as the next target zone on the chart. This area becomes more likely if gold loses 4,096 and fails to recover above the sell zone.
Key Zones
Current price: 4,125
Sell order liquidity zone: 4,135–4,145
Ichimoku resistance area: 4,151–4,156
Nearest support: 4,096
Fibonacci 50 reaction zone: 4,070–4,080
Downside target: 4,035–4,045
Major resistance: 4,221
Invalidation: above 4,156
Trading Plan
Sell Priority: 4,135–4,145
Condition: wait for bearish rejection, failed breakout above the trendline, or price staying below the Ichimoku resistance area.
SL: above 4,156
TP1: 4,096
TP2: 4,070–4,080
TP3: 4,035–4,045
Alternative Scenario
If gold breaks below 4,096 directly, wait for a retest of this level as resistance before looking for sell continuation toward 4,070 and 4,035.
Buy View
Buy is not the priority while price remains below the Ichimoku structure and descending trendline. A short-term buy reaction may appear near 4,070–4,080, but it needs clear bullish confirmation first.
Final View
Overall, gold has not confirmed a strong bullish reversal yet. Price is still under Ichimoku pressure, and the cleaner plan is to watch for sell confirmation around 4,135–4,145. If this zone rejects, the next downside focus remains 4,096, 4,070, and 4,035.
Will gold reject from the trendline and Ichimoku zone, or break above 4,156 to weaken the short-term sell view?
Short 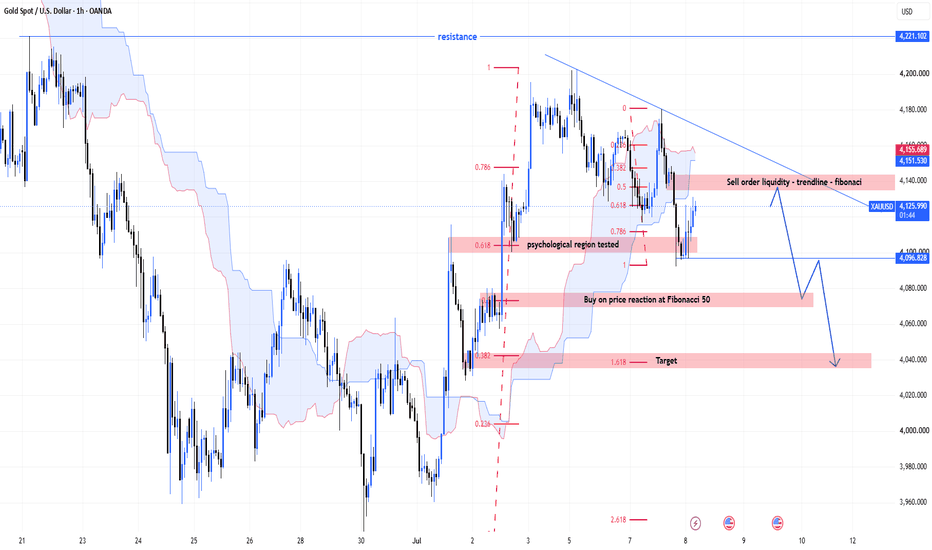
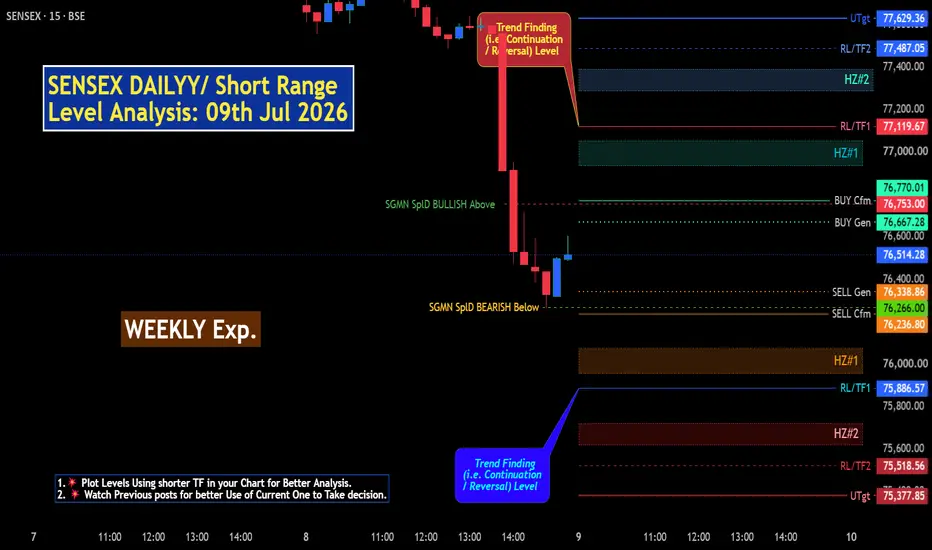
SENSEX Weekly EXP/ Short Range Level Analysis: 09th Jul 2026🔕 SGMN SplD BULLISH Above => 76753.
🔕 SGMN SplD Bearish BELOW => 76266.
Mentioned analysis based on 2 consecutive candle close in 15 min Time Frame.
━━━━━🟥🟧🟨🟩🟦🟪⬛━━━━━
💥Level Interpretation / description:
✍🏻L#1: If the candle crossed & stays above the “Buy Gen”, it is treated / considered as Bullish bias. Cfm=> Confirmation.
L#2: Possibility / Probability of REVERSAL near 🔕RL/TF1 & 🔔RL/TF2
L#3: If the candle stays above “Sell Gen” but below “Buy Gen”, it is treated / considered as Sidewise. Aggressive Traders can take Long position near “Sell Gen” either retesting or crossed from Below & vice-versa i.e. can take Short position near “Buy Gen” either retesting or crossed downward from Above.
L#4: If the candle crossed & stays below the “Sell Gen”, it is treated / considered a Bearish bias.
L#5: Possibility / Probability of REVERSAL near 🔕RL/TF1 & 🔔RL/TF2
HZB (Buy side) & HZS (Sell side) => Hurdle Zone,
✍🏻 *** Specialty of “HZB#1, HZB#2 HZS#1 & HZS#2” is Sidewise (behaviour in Nature)
Rest Plotted and Mentioned on Chart
Color code Used:
Green, BLUE =. Positive bias.
Safron, RED =. Negative bias.
RED in Between Green means Trend Finder / Momentum Change
/ CYCLE Change and Vice Versa.
Notice One thing: HOW LEVELS are Working.
Use any Momentum Indicator / Oscillator or as you "USED to" to Take entry.
━━━━━🟥🟧🟨🟩🟦🟪⬛━━━━━
⚠️ DISCLAIMER:
The information, views, and ideas shared here are purely for educational and informational purposes only. They are not intended as investment advice or a recommendation to buy, sell, or hold any financial instruments. I am not a SEBI-registered financial adviser.
Trading and investing in the stock market involves risk, and you should do your own research and analysis. You are solely responsible for any decisions made based on this research.
"🔔As HARD EARNED MONEY IS YOUR's, So DECISION SHOULD HAVE TO BE YOUR's".
━━━━━🟥🟧🟨🟩🟦🟪⬛━━━━━
❇️ Follow notification about periodical View
💥 Do Comment for Stock WEEKLY Level Analysis.🚀
📊 Do you agree with this view?
✈️ HIT THE PLANE ICON if this technical observation resonates with you. It will Motivate me.
━━━━━🟥🟧🟨🟩🟦🟪⬛━━━━━
💡 If You LOOKING any CHART & want for Level and ANALYZE?
Share your desired stock names in the comments below! I will try to analyze the chart Levels, patterns and share my technical view (so far my Knowledge).
If Viewers think It can identify meaningful setups. Looking forward to hearing from all of you — let's keep this discussion going and help each other make better trading decisions.
___________🔕^^^⚫⚪^🙏🏼🙏🏼🙏🏼^⚪⚫^^^🔔___________ SENSEX Weekly EXP/ Short Range Level Analysis: 09th Jul 2026 NIFTY DAILY / Short Range Level Analysis for 09th Jul 2026🔕 SGMN SplD BULLISH Above => 23958.
🔕 SGMN SplD Bearish BELOW => 23809.
Mentioned analysis based on 2 consecutive candle close in 15 min Time Frame.
━━━━━🟥🟧🟨🟩🟦🟪⬛━━━━━
💥Level Interpretation / description:
✍🏻L#1: If the candle crossed & stays above the “Buy Gen”, it is treated / considered as Bullish bias. Cfm=> Confirmation.
L#2: Possibility / Probability of REVERSAL near 🔕RL/TF1 & 🔔RL/TF2
L#3: If the candle stays above “Sell Gen” but below “Buy Gen”, it is treated / considered as Sidewise. Aggressive Traders can take Long position near “Sell Gen” either retesting or crossed from Below & vice-versa i.e. can take Short position near “Buy Gen” either retesting or crossed downward from Above.
L#4: If the candle crossed & stays below the “Sell Gen”, it is treated / considered a Bearish bias.
L#5: Possibility / Probability of REVERSAL near 🔕RL/TF1 & 🔔RL/TF2
HZB (Buy side) & HZS (Sell side) => Hurdle Zone,
✍🏻 *** Specialty of “HZB#1, HZB#2 HZS#1 & HZS#2” is Sidewise (behaviour in Nature)
Rest Plotted and Mentioned on Chart
Color code Used:
Green, BLUE =. Positive bias.
Safron, RED =. Negative bias.
RED in Between Green means Trend Finder / Momentum Change
/ CYCLE Change and Vice Versa.
Notice One thing: HOW LEVELS are Working.
Use any Momentum Indicator / Oscillator or as you "USED to" to Take entry.
━━━━━🟥🟧🟨🟩🟦🟪⬛━━━━━
⚠️ DISCLAIMER:
The information, views, and ideas shared here are purely for educational and informational purposes only. They are not intended as investment advice or a recommendation to buy, sell, or hold any financial instruments. I am not a SEBI-registered financial adviser.
Trading and investing in the stock market involves risk, and you should do your own research and analysis. You are solely responsible for any decisions made based on this research.
"🔔As HARD EARNED MONEY IS YOUR's, So DECISION SHOULD HAVE TO BE YOUR's".
━━━━━🟥🟧🟨🟩🟦🟪⬛━━━━━
❇️ Follow notification about periodical View
💥 Do Comment for Stock WEEKLY Level Analysis.🚀
📊 Do you agree with this view?
✈️ HIT THE PLANE ICON if this technical observation resonates with you. It will Motivate me.
━━━━━🟥🟧🟨🟩🟦🟪⬛━━━━━
💡 If You LOOKING any CHART & want for Level and ANALYZE?
Share your desired stock names in the comments below! I will try to analyze the chart Levels, patterns and share my technical view (so far my Knowledge).
If Viewers think It can identify meaningful setups. Looking forward to hearing from all of you — let's keep this discussion going and help each other make better trading decisions.
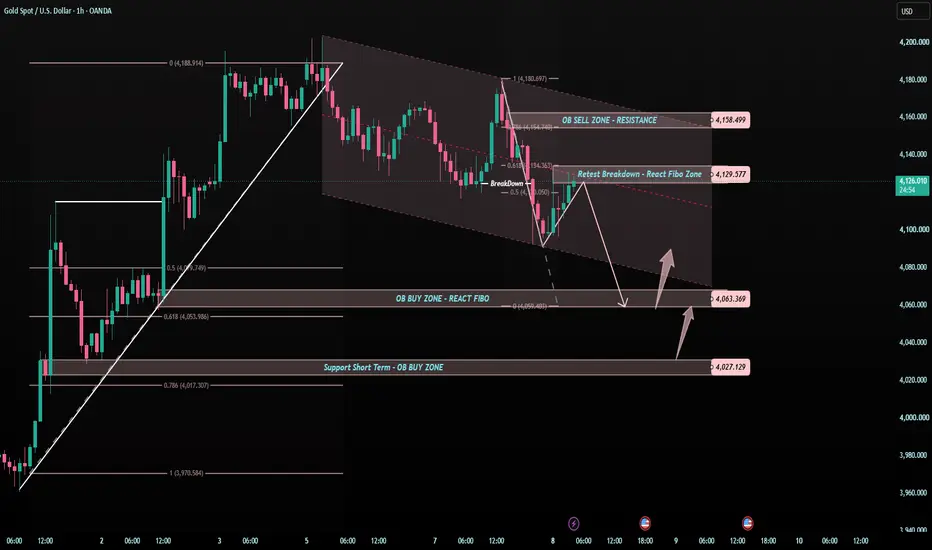
___________🔕^^^⚫⚪^🙏🏼🙏🏼🙏🏼^⚪⚫^^^🔔___________ XAUUSD — Gold Tests the Breakdown ZoneGold is now trading around 4,120 - 4,130 after a sharp rejection from the previous upper structure.
Price has broken down from the short-term recovery move and is now retesting the breakdown area near 4,129.
This is an important moment.
Because gold is not at a clean buy zone yet.
It is sitting near a retest resistance area, while the stronger support zone is still lower.
THE SIMPLE READ
Gold is currently moving inside a short-term bearish correction channel.
The current reaction zone is around 4,129, which also lines up with the Fibo retest area.
As long as gold stays below 4,158, the correction can still continue.
The main buy reaction zone I’m watching is 4,063.
If price reaches 4,063 and buyers defend it, gold may attempt a recovery again.
If 4,063 fails, the next important support is 4,027.
WHAT THE CHART IS TELLING US
4,158 is the OB sell zone and short-term resistance.
This is the area gold needs to reclaim before the bullish structure becomes stronger again.
4,129 is the current retest breakdown zone.
Price may react here, but this is not the strongest buy area.
4,063 is the main OB buy zone with Fibo reaction.
This is the zone where I want to watch buyer behaviour more carefully.
4,027 is the deeper short-term support zone.
If gold corrects deeper, this area becomes the last important support for the current recovery structure.
KEY PRICE ZONES
Current price area: 4,120 - 4,130
Retest breakdown zone: 4,129
Short-term resistance: 4,158
Main OB buy zone: 4,063
Deeper support zone: 4,027
Bullish recovery becomes stronger above: 4,158
TRADING PLAN
📉 Bearish Correction Scenario
If gold stays below 4,129 - 4,158:
The correction can continue toward 4,063.
I do not want to chase the move late.
The cleaner plan is to wait for price to reach the stronger support zone.
📈 Buy Reaction Scenario
If gold reaches 4,063 and shows a clear bullish reaction:
Buyers may try to push price back toward 4,129.
If gold reclaims 4,129, the next resistance to watch is 4,158.
A stronger bullish view only becomes clearer above 4,158.
No reaction from 4,063 = no buy.
📉 Deeper Pullback Scenario
If 4,063 breaks clearly:
Gold may continue lower toward 4,027.
This is the deeper support zone on the chart.
If 4,027 also fails, the short-term recovery structure becomes weaker.
Tiara’s Tip:
A retest is not always a buy signal.
Sometimes the market retests the broken zone only to continue lower.
That is why I prefer waiting for price to reach the real decision zone.
For today, that zone is 4,063 - 4,027.
Main view:
Gold is still correcting while below 4,158.
The cleanest area to watch is not the current price, but the reaction around 4,063 - 4,027.
Confirmation first.
Trade second.
No confirmation = no trade.
Is gold only retesting before another drop, or preparing a deeper support reaction? Short 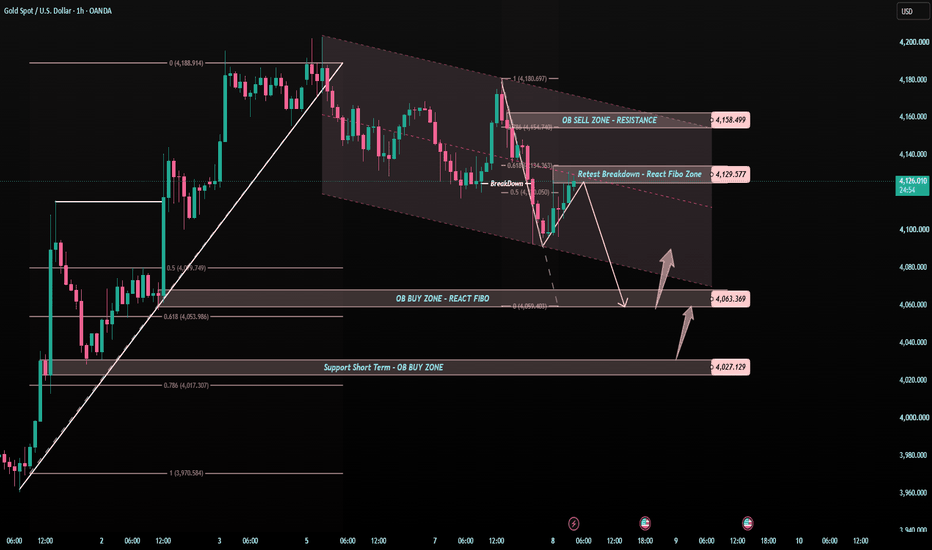
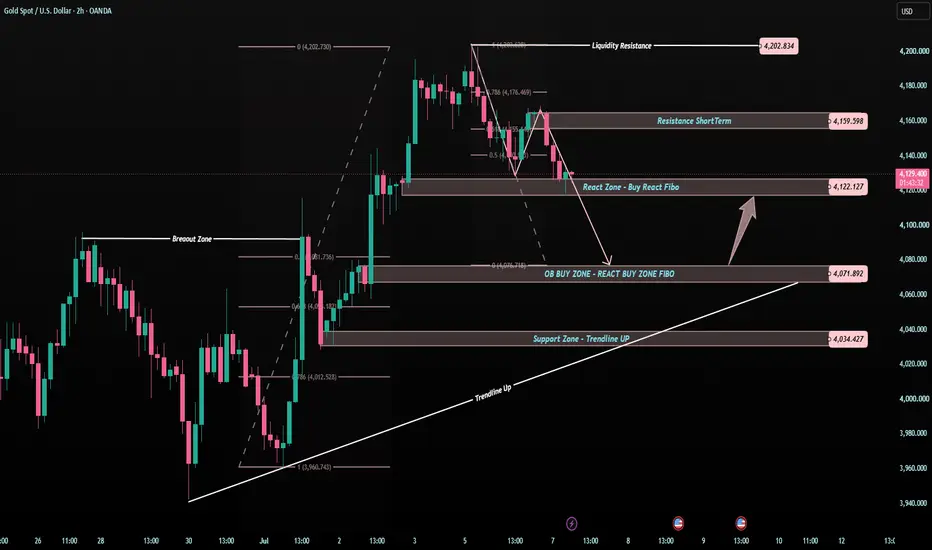
Gold Is Falling, But the Best Zone Is Still BelowGold is now showing the correction we expected after rejecting the upper liquidity area.
Price failed to stay strong above 4,159 and is now moving around the 4,122 reaction area.
But for me, this is not the most important zone yet.
The real decision area is lower.
The zone I’m watching today is 4,071.
WHY THIS MOVE MATTERS
Gold rejected from the 4,202 liquidity resistance.
Then price lost momentum below 4,159.
That tells me the short-term correction is still active.
But a correction does not always mean the trend is broken.
Sometimes the market simply needs to return to a stronger support area before buyers decide again.
That is why I do not want to chase the sell late.
I want to see how price reacts when it reaches the real buy zone.
KEY PRICE ZONES
Current price area: 4,120 - 4,130
Short-term resistance: 4,159
Current reaction area: 4,122
Main buy reaction zone: 4,071
Trendline support: 4,034
Liquidity resistance: 4,202
TRADING PLAN
📉 If gold stays below 4,159
The correction can continue.
The next important downside area remains 4,071.
This is the zone where I want to watch buyer reaction more carefully.
📈 If gold reacts from 4,071
A bullish reaction from this area may support a recovery back toward 4,122 and 4,159.
A stronger upside view only becomes cleaner if gold reclaims 4,159.
No reaction from 4,071 = no buy.
📉 If 4,071 breaks
Gold may continue lower toward 4,034.
This is the deeper support zone connected with the rising trendline.
If 4,034 fails, the recovery structure becomes weaker.
Tiara’s View
Today is not about guessing the bottom.
It is about waiting for the market to reach the right zone.
Gold is correcting, but the main buy area is still around 4,071 - 4,034.
If buyers defend this area, the recovery structure can stay alive.
If they do not, the chart needs more time.
Main view:
Below 4,159, gold can still pull back.
Around 4,071 - 4,034, I will wait for confirmation.
No confirmation = no trade.
Is gold only retesting before another recovery, or is this correction getting deeper?
Short 
SENSEX DAILYY/ Short Range Level Analysis: 08th Jul 2026.🔕 SGMN SplD BULLISH Above => 78365.
🔕 SGMN SplD Bearish BELOW => 78008.
Mentioned analysis based on 2 consecutive candle close in 15 min Time Frame.
━━━━━🟥🟧🟨🟩🟦🟪⬛━━━━━
💥Level Interpretation / description:
✍🏻L#1: If the candle crossed & stays above the “Buy Gen”, it is treated / considered as Bullish bias. Cfm=> Confirmation.
L#2: Possibility / Probability of REVERSAL near 🔕RL/TF1 & 🔔RL/TF2
L#3: If the candle stays above “Sell Gen” but below “Buy Gen”, it is treated / considered as Sidewise. Aggressive Traders can take Long position near “Sell Gen” either retesting or crossed from Below & vice-versa i.e. can take Short position near “Buy Gen” either retesting or crossed downward from Above.
L#4: If the candle crossed & stays below the “Sell Gen”, it is treated / considered a Bearish bias.
L#5: Possibility / Probability of REVERSAL near 🔕RL/TF1 & 🔔RL/TF2
HZB (Buy side) & HZS (Sell side) => Hurdle Zone,
✍🏻 *** Specialty of “HZB#1, HZB#2 HZS#1 & HZS#2” is Sidewise (behaviour in Nature)
Rest Plotted and Mentioned on Chart
Color code Used:
Green, BLUE =. Positive bias.
Safron, RED =. Negative bias.
RED in Between Green means Trend Finder / Momentum Change
/ CYCLE Change and Vice Versa.
Notice One thing: HOW LEVELS are Working.
Use any Momentum Indicator / Oscillator or as you "USED to" to Take entry.
━━━━━🟥🟧🟨🟩🟦🟪⬛━━━━━
⚠️ DISCLAIMER:
The information, views, and ideas shared here are purely for educational and informational purposes only. They are not intended as investment advice or a recommendation to buy, sell, or hold any financial instruments. I am not a SEBI-registered financial adviser.
Trading and investing in the stock market involves risk, and you should do your own research and analysis. You are solely responsible for any decisions made based on this research.
"🔔As HARD EARNED MONEY IS YOUR's, So DECISION SHOULD HAVE TO BE YOUR's".
━━━━━🟥🟧🟨🟩🟦🟪⬛━━━━━
❇️ Follow notification about periodical View
💥 Do Comment for Stock WEEKLY Level Analysis.🚀
📊 Do you agree with this view?
✈️ HIT THE PLANE ICON if this technical observation resonates with you. It will Motivate me.
━━━━━🟥🟧🟨🟩🟦🟪⬛━━━━━
💡 If You LOOKING any CHART & want for Level and ANALYZE?
Share your desired stock names in the comments below! I will try to analyze the chart Levels, patterns and share my technical view (so far my Knowledge).
If Viewers think It can identify meaningful setups. Looking forward to hearing from all of you — let's keep this discussion going and help each other make better trading decisions.
___________🔕^^^⚫⚪^🙏🏼🙏🏼🙏🏼^⚪⚫^^^🔔___________ BANKNIFTY DAILY / Short Range Level Analysis for 08th Jul 2026🔕 SGMN SplD BULLISH Above => 58361.
🔕 SGMN SplD Bearish BELOW => 58049.
Mentioned analysis based on 2 consecutive candle close in 15 min Time Frame.
━━━━━🟥🟧🟨🟩🟦🟪⬛━━━━━
💥Level Interpretation / description:
✍🏻L#1: If the candle crossed & stays above the “Buy Gen”, it is treated / considered as Bullish bias. Cfm=> Confirmation.
L#2: Possibility / Probability of REVERSAL near 🔕RL/TF1 & 🔔RL/TF2
L#3: If the candle stays above “Sell Gen” but below “Buy Gen”, it is treated / considered as Sidewise. Aggressive Traders can take Long position near “Sell Gen” either retesting or crossed from Below & vice-versa i.e. can take Short position near “Buy Gen” either retesting or crossed downward from Above.
L#4: If the candle crossed & stays below the “Sell Gen”, it is treated / considered a Bearish bias.
L#5: Possibility / Probability of REVERSAL near 🔕RL/TF1 & 🔔RL/TF2
HZB (Buy side) & HZS (Sell side) => Hurdle Zone,
✍🏻 *** Specialty of “HZB#1, HZB#2 HZS#1 & HZS#2” is Sidewise (behaviour in Nature)
Rest Plotted and Mentioned on Chart
Color code Used:
Green, BLUE =. Positive bias.
Safron, RED =. Negative bias.
RED in Between Green means Trend Finder / Momentum Change
/ CYCLE Change and Vice Versa.
Notice One thing: HOW LEVELS are Working.
Use any Momentum Indicator / Oscillator or as you "USED to" to Take entry.
━━━━━🟥🟧🟨🟩🟦🟪⬛━━━━━
⚠️ DISCLAIMER:
The information, views, and ideas shared here are purely for educational and informational purposes only. They are not intended as investment advice or a recommendation to buy, sell, or hold any financial instruments. I am not a SEBI-registered financial adviser.
Trading and investing in the stock market involves risk, and you should do your own research and analysis. You are solely responsible for any decisions made based on this research.
"🔔As HARD EARNED MONEY IS YOUR's, So DECISION SHOULD HAVE TO BE YOUR's".
━━━━━🟥🟧🟨🟩🟦🟪⬛━━━━━
❇️ Follow notification about periodical View
💥 Do Comment for Stock WEEKLY Level Analysis.🚀
📊 Do you agree with this view?
✈️ HIT THE PLANE ICON if this technical observation resonates with you. It will Motivate me.
━━━━━🟥🟧🟨🟩🟦🟪⬛━━━━━
💡 If You LOOKING any CHART & want for Level and ANALYZE?
Share your desired stock names in the comments below! I will try to analyze the chart Levels, patterns and share my technical view (so far my Knowledge).
If Viewers think It can identify meaningful setups. Looking forward to hearing from all of you — let's keep this discussion going and help each other make better trading decisions.
___________🔕^^^⚫⚪^🙏🏼🙏🏼🙏🏼^⚪⚫^^^🔔___________ NIFTY DAILY / Short Range Level Analysis for 08th Jul 2026🔕 SGMN SplD BULLISH Above => 24430.
🔕 SGMN SplD Bearish BELOW => 24334.
Mentioned analysis based on 2 consecutive candle close in 15 min Time Frame.
━━━━━🟥🟧🟨🟩🟦🟪⬛━━━━━
💥Level Interpretation / description:
✍🏻L#1: If the candle crossed & stays above the “Buy Gen”, it is treated / considered as Bullish bias. Cfm=> Confirmation.
L#2: Possibility / Probability of REVERSAL near 🔕RL/TF1 & 🔔RL/TF2
L#3: If the candle stays above “Sell Gen” but below “Buy Gen”, it is treated / considered as Sidewise. Aggressive Traders can take Long position near “Sell Gen” either retesting or crossed from Below & vice-versa i.e. can take Short position near “Buy Gen” either retesting or crossed downward from Above.
L#4: If the candle crossed & stays below the “Sell Gen”, it is treated / considered a Bearish bias.
L#5: Possibility / Probability of REVERSAL near 🔕RL/TF1 & 🔔RL/TF2
HZB (Buy side) & HZS (Sell side) => Hurdle Zone,
✍🏻 *** Specialty of “HZB#1, HZB#2 HZS#1 & HZS#2” is Sidewise (behaviour in Nature)
Rest Plotted and Mentioned on Chart
Color code Used:
Green, BLUE =. Positive bias.
Safron, RED =. Negative bias.
RED in Between Green means Trend Finder / Momentum Change
/ CYCLE Change and Vice Versa.
Notice One thing: HOW LEVELS are Working.
Use any Momentum Indicator / Oscillator or as you "USED to" to Take entry.
━━━━━🟥🟧🟨🟩🟦🟪⬛━━━━━
⚠️ DISCLAIMER:
The information, views, and ideas shared here are purely for educational and informational purposes only. They are not intended as investment advice or a recommendation to buy, sell, or hold any financial instruments. I am not a SEBI-registered financial adviser.
Trading and investing in the stock market involves risk, and you should do your own research and analysis. You are solely responsible for any decisions made based on this research.
"🔔As HARD EARNED MONEY IS YOUR's, So DECISION SHOULD HAVE TO BE YOUR's".
━━━━━🟥🟧🟨🟩🟦🟪⬛━━━━━
❇️ Follow notification about periodical View
💥 Do Comment for Stock WEEKLY Level Analysis.🚀
📊 Do you agree with this view?
✈️ HIT THE PLANE ICON if this technical observation resonates with you. It will Motivate me.
━━━━━🟥🟧🟨🟩🟦🟪⬛━━━━━
💡 If You LOOKING any CHART & want for Level and ANALYZE?
Share your desired stock names in the comments below! I will try to analyze the chart Levels, patterns and share my technical view (so far my Knowledge).
If Viewers think It can identify meaningful setups. Looking forward to hearing from all of you — let's keep this discussion going and help each other make better trading decisions.
___________🔕^^^⚫⚪^🙏🏼🙏🏼🙏🏼^⚪⚫^^^🔔___________ NIFTY DAILY / Short Range Level Analysis for 08th Jul 2026 XAUUSD — Bullish Structure Holding, Buy Setup Still Priority
Gold is trading around $4,128 after forming a short-term correction from the upper reaction zone. The main structure remains bullish because price is still holding above the rising trendline and the recent market structure continues to show multiple CHOCH and BOS signals to the upside.
From an SMC perspective, gold has already shifted from the previous bearish leg into a recovery structure. The current movement looks more like accumulation and correction rather than a confirmed bearish reversal. Price is now moving inside a smaller descending correction, and this accumulation phase may continue until the US session before the next stronger move appears.
The main zone to watch is the $4,100–$4,110 buy zone test liquidity. This area is important because it sits below the current price, aligns with the correction structure, and may act as the final liquidity test before buyers attempt to push gold higher again. As long as price holds above this zone, the bullish recovery structure remains valid.
Buy setup 1
Condition:
Gold pulls back into the $4,100–$4,110 buy zone test liquidity and forms bullish rejection with lower timeframe MSS / CHOCH.
Entry: $4,100–$4,110
SL: below $4,080
TP1: $4,150
TP2: $4,175–$4,190
TP3: $4,220
TP4: $4,280
Buy setup 2
Condition:
If gold breaks above the short-term descending correction line and retests it as support, bullish continuation remains valid without waiting for a deeper pullback.
Entry: above $4,150 after breakout retest
SL: below $4,120
TP1: $4,175–$4,190
TP2: $4,220
TP3: $4,280
Sell scalping setup
Condition:
Selling is not the main priority. A sell scalp is only valid if gold reaches the $4,175–$4,190 OB sell scalping zone and shows clear bearish rejection.
Entry: $4,175–$4,190 after rejection
SL: above $4,210
TP1: $4,150
TP2: $4,128
TP3: $4,100–$4,110
Key levels
Current price area: $4,128
Main buy zone test liquidity: $4,100–$4,110
Short-term FVG reaction zone: $4,150–$4,160
OB sell scalping zone: $4,175–$4,190
Buy-side liquidity: $4,220
Main bullish target: $4,280
Bullish continuation confirmation: clean break above $4,150
Stronger bullish confirmation: clean break above $4,190
Bullish invalidation: clean 2H close below $4,080
My current view is that gold remains in a bullish structure, but the market may continue to accumulate before the US session. The Prime Gold plan is to avoid chasing price in the middle range and wait for either a pullback into $4,100–$4,110 or a clean breakout above the correction line before looking for buy confirmation. As long as the buy zone holds, the priority remains buying toward $4,175, $4,220 and potentially $4,280.
No confirmation, no trade.
Long 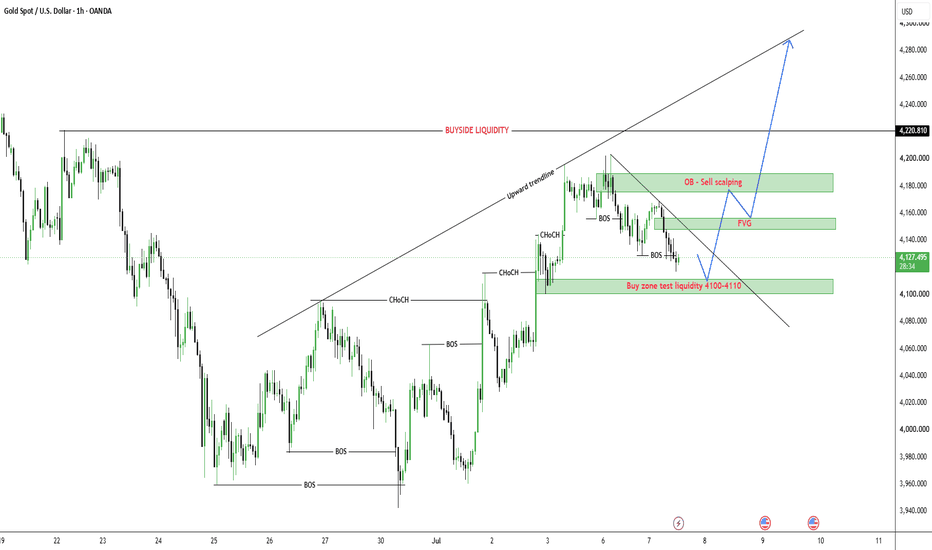
XAUUSD — Gold Is Not Weak, But This Is Not a Clean Buy YetGold is holding a much better structure than before.
After the recovery from the lower area, price is now staying above the rising trendline and moving close to the first resistance zone around 4,188.
This tells me one thing:
Buyers are still present.
But the market is not giving the cleanest entry at the current price.
Gold is now sitting between resistance and support.
That means the next best trade may come from patience, not prediction.
THE SIMPLE READ
Gold remains constructive while price stays above the rising trendline and the 4,068 support area.
The current price is around 4,160 - 4,170.
The first important resistance is 4,188.
If gold breaks and holds above 4,188, buyers may try to continue toward the higher sell / volume zone at 4,302.
But if gold fails to break 4,188, a pullback toward 4,125 may come first.
If 4,125 does not hold, the deeper decision zone is 4,068.
WHAT THE CHART IS SHOWING
Gold has already moved away from the lower structure.
The recovery is clear, but price is now trading just below a resistance zone.
This is where many traders get trapped.
They see the bullish structure and enter too late.
But smart price action needs a cleaner location.
4,188 is the first resistance and OB sell scalping zone.
This is where gold may either break higher or create a short-term rejection.
4,125 is the first buy reaction zone.
If price pulls back into this area and buyers react, the bullish structure may stay healthy.
4,068 is the main OB buy zone.
This is the deeper support that protects the recovery structure.
4,302 is the higher sell / volume zone.
If gold confirms above 4,188, this becomes the next major upside reaction area.
KEY PRICE ZONES
Current price area: 4,160 - 4,170
First resistance zone: 4,188
Buy reaction zone: 4,125
Main OB buy zone: 4,068
Higher sell / volume zone: 4,302
Bullish structure weakens below: 4,068
TRADING SCENARIOS
📈 Bullish Breakout Scenario
If gold breaks and holds above 4,188:
The bullish recovery becomes stronger.
Price may continue toward 4,302.
A clean buy setup would need breakout confirmation or a retest above 4,188.
I would not chase without confirmation.
📈 Pullback Reaction Scenario
If gold rejects from 4,188 first:
I will watch 4,125 as the first support area.
If buyers defend this zone, gold may attempt another push toward 4,188.
If price drops deeper, 4,068 becomes the key zone to watch.
A strong reaction from 4,068 could keep the larger bullish recovery alive.
📉 Bearish Correction Scenario
If gold fails at 4,188 and breaks below 4,125:
The market may continue correcting toward 4,068.
If 4,068 also breaks, the bullish structure becomes much weaker.
A sell idea only makes sense after clear rejection and confirmation.
Tiara’s Tip:
A bullish chart does not always mean a good buy entry.
Sometimes the market is bullish, but the price is already too close to resistance.
That is why I prefer waiting for one of two things:
A confirmed breakout above 4,188.
Or a clean pullback into 4,125 - 4,068.
Main view:
Gold is still holding a constructive structure.
But 4,188 is the first real test.
Break above 4,188 = continuation chance toward 4,302.
Reject from 4,188 = wait for support reaction around 4,125 - 4,068.
No confirmation = no trade.
What do you think — 🟢 breakout to 4,302 or 🔴 pullback before the next move? Long 
XAUUSD: Recovery Structure Maintains Above SupportGold is still holding a constructive recovery structure after the strong rebound from the lower zone. From Kelly’s view, price has already completed an impulsive recovery leg and is now moving into a corrective phase before the next possible upside move.
The key idea is simple: gold may pull back first, but the bullish recovery structure remains valid while support holds.
⟡ Market structure
The chart shows gold recovered strongly from the lower area near 3,960–3,980, then pushed higher into the 4,180–4,200 resistance zone. After reaching this upper area, price started to slow down and consolidate, which suggests that the market may need a corrective pullback before continuing higher.
The nearest strong support is around 4,155. As long as gold stays above this area, buyers still have control in the short term.
Below current price, the chart highlights two important reaction zones: the buy scalping wave A area around 4,120–4,130, and the deeper buy zone where the ABC correction may end around 4,065–4,080.
➤ Key levels
◌ 4,180–4,200: current resistance and recent rejection area
◌ 4,155: strong support and short-term decision level
◌ 4,120–4,130: buy scalping wave A zone
◌ 4,065–4,080: main buy zone and possible ABC completion area
◌ 4,221: upside target if recovery continues
◌ Below 4,065: area where the bullish recovery setup weakens
⌁ Elliott Wave view
From an Elliott Wave perspective, gold appears to have completed a short-term bullish 5-wave move from the lower base.
After a 5-wave recovery, the market often forms an ABC correction before the next larger move develops. The current structure may now be forming wave A lower, followed by a wave B rebound, then wave C into the main buy zone.
If wave C finishes around 4,065–4,080 and buyers defend that area, gold may begin a new upside sequence towards 4,155 first, then 4,221 if momentum expands.
▸ Trading scenario
Preferred scenario: wait for price to correct into the buy zone and show bullish confirmation.
Entry zone: 4,065–4,080 if bullish confirmation appears
Stop loss: below the confirmed reaction low or below 4,050
Take profit 1: 4,120–4,130
Take profit 2: 4,155
Take profit 3: 4,221
Alternative scenario: if gold breaks below 4,065 with strong bearish pressure, the ABC recovery setup weakens. In that case, price may need to build a new base before the bullish continuation becomes reliable again.
⌁ Kelly’s view
For Kelly, this is a buy-the-correction structure, not a chase-the-top setup. Gold already reacted strongly from the lower zone, but price is now near resistance, so waiting for a cleaner pullback makes more sense.
If the ABC correction holds above the buy zone, the recovery structure can continue.
Gold is still building a bullish recovery.
The better setup may come after a controlled pullback into support.
Share your view below. Short 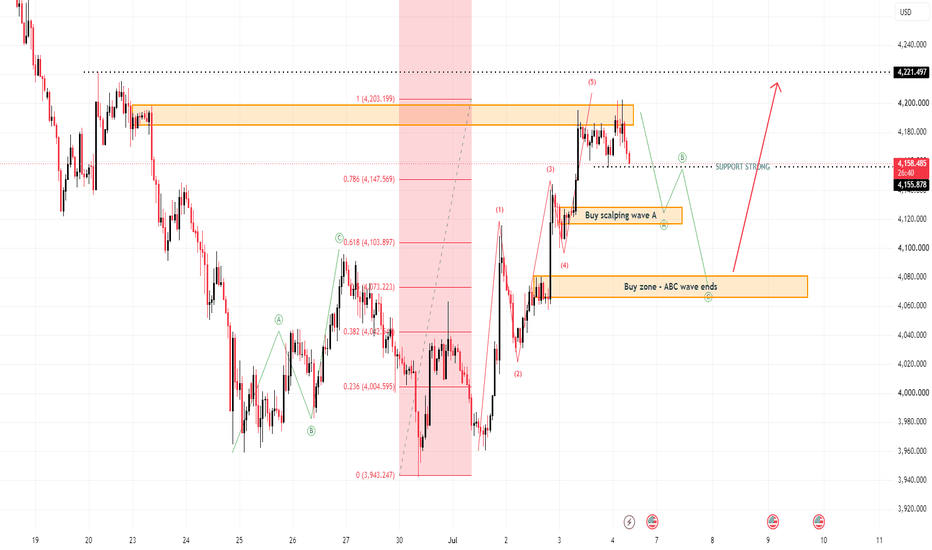
The Breakout Is Real, But the Market May Test Patience FirstXAUUSD — The Breakout Is Real, But the Market May Test Patience First
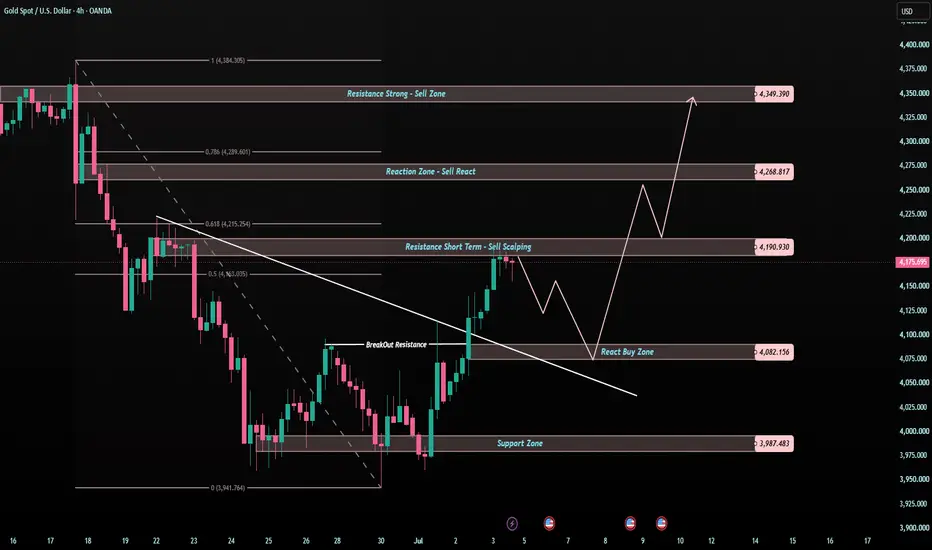
Gold has changed its short-term behaviour.
After several days of bearish pressure, price has finally broken above the descending trendline and is now pushing into the first resistance area around 4,190.
This is a positive sign for buyers.
But it is also a danger zone for traders who chase too late.
The market has already moved far from the lower support.
So now, the cleaner question is not:
“Should I buy now?”
The better question is:
“Can gold confirm above 4,190, or will it pull back first?”
THE SIMPLE READ
Gold is recovering after a clear trendline breakout.
The current price area is around 4,170 - 4,180.
The first major decision zone is 4,190.
If gold breaks and holds above 4,190, the recovery may continue toward 4,268.
If momentum stays strong, 4,349 becomes the next higher resistance zone.
But if gold rejects from 4,190, a pullback toward 4,082 may appear before the next clean move.
WHAT I SEE ON THE CHART
The bearish trendline has been broken.
That tells us sellers are no longer controlling the chart the same way they did before.
But gold is now close to the resistance short-term sell zone.
This means buyers still need confirmation.
4,190 is the first resistance zone.
This is where price may either confirm continuation or create a pullback.
4,082 is the react buy zone.
If gold pulls back, this is the area where buyers may try to defend the breakout structure.
3,987 is the deeper support zone.
If 4,082 fails, this level becomes important again.
4,268 is the next reaction zone.
If gold breaks above 4,190 with strength, this is the next upside area to watch.
4,349 is the strong resistance zone.
This is the larger upper target if the bullish recovery continues.
KEY PRICE ZONES
Current price area: 4,170 - 4,180
First decision zone: 4,190
React buy zone: 4,082
Deeper support: 3,987
Next upside reaction: 4,268
Strong resistance: 4,349
Bullish structure weakens below: 4,082
TRADING PLAN
📈 Continuation Scenario
If gold breaks and holds above 4,190:
→ Buyers may continue toward 4,268
→ If momentum remains strong, 4,349 becomes the next major zone
→ Buy idea only after breakout confirmation or a clean retest
→ No confirmation = no trade
📈 Pullback Buy Scenario
If gold rejects from 4,190 first:
→ I will watch for a pullback toward 4,082
→ If buyers defend 4,082, the recovery structure can stay valid
→ A bullish reaction from this zone may support another push higher
→ Invalidation: price breaks below 4,082 and fails to reclaim it
📉 Rejection Scenario
If gold fails at 4,190 and sellers step in strongly:
→ Price may correct back toward 4,082
→ If 4,082 breaks, 3,987 becomes the next support zone
→ Sell reaction idea only after clear rejection confirmation
Tiara’s Tip:
A breakout can show direction.
But the retest shows quality.
When price breaks a trendline, I do not want to chase the first emotional move.
I want to see whether buyers can protect the structure after the breakout.
For now, 4,190 is the first test.
If gold confirms above it, the path toward 4,268 becomes cleaner.
If gold rejects, 4,082 may become the most important support to watch.
Main view:
Gold is improving after the trendline breakout, but confirmation around 4,190 is still needed.
Break and hold above 4,190 = continuation chance.
Reject from 4,190 = wait for pullback reaction around 4,082.
No confirmation = no trade.
What do you think — 🟢 gold continues toward 4,268 or 🔴 pulls back before the next push? Long 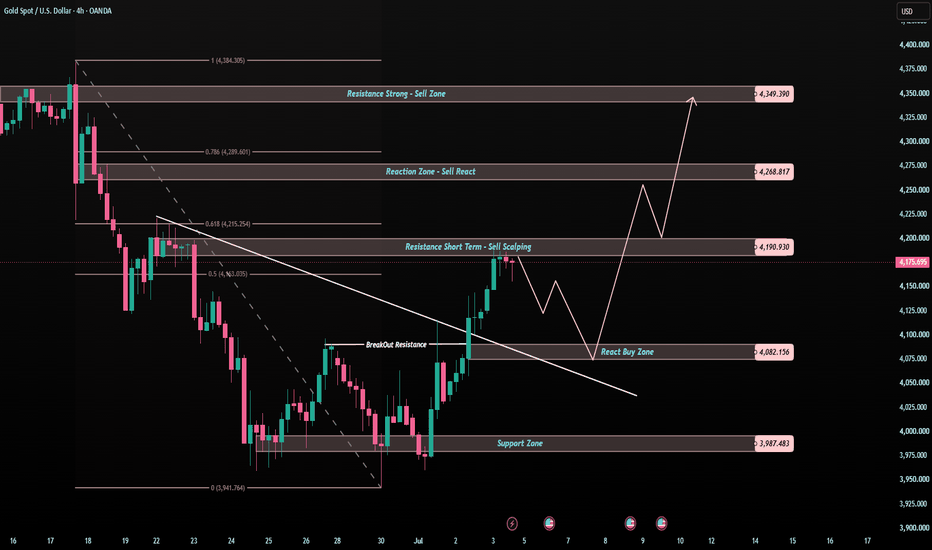
NIFTY WEEKLY EXP. Level Analysis for 07th Jul 2026🔕 SGMN SplD BULLISH Above => 24489.
🔕 SGMN SplD Bearish BELOW => 24375.
Mentioned analysis based on 2 consecutive candle close in 15 min Time Frame.
━━━━━🟥🟧🟨🟩🟦🟪⬛━━━━━
💥Level Interpretation / description:
✍🏻L#1: If the candle crossed & stays above the “Buy Gen”, it is treated / considered as Bullish bias. Cfm=> Confirmation.
L#2: Possibility / Probability of REVERSAL near 🔕RL/TF1 & 🔔RL/TF2
L#3: If the candle stays above “Sell Gen” but below “Buy Gen”, it is treated / considered as Sidewise. Aggressive Traders can take Long position near “Sell Gen” either retesting or crossed from Below & vice-versa i.e. can take Short position near “Buy Gen” either retesting or crossed downward from Above.
L#4: If the candle crossed & stays below the “Sell Gen”, it is treated / considered a Bearish bias.
L#5: Possibility / Probability of REVERSAL near 🔕RL/TF1 & 🔔RL/TF2
HZB (Buy side) & HZS (Sell side) => Hurdle Zone,
✍🏻 *** Specialty of “HZB#1, HZB#2 HZS#1 & HZS#2” is Sidewise (behaviour in Nature)
Rest Plotted and Mentioned on Chart
Color code Used:
Green, BLUE =. Positive bias.
Safron, RED =. Negative bias.
RED in Between Green means Trend Finder / Momentum Change
/ CYCLE Change and Vice Versa.
Notice One thing: HOW LEVELS are Working.
Use any Momentum Indicator / Oscillator or as you "USED to" to Take entry.
━━━━━🟥🟧🟨🟩🟦🟪⬛━━━━━
⚠️ DISCLAIMER:
The information, views, and ideas shared here are purely for educational and informational purposes only. They are not intended as investment advice or a recommendation to buy, sell, or hold any financial instruments. I am not a SEBI-registered financial adviser.
Trading and investing in the stock market involves risk, and you should do your own research and analysis. You are solely responsible for any decisions made based on this research.
"🔔As HARD EARNED MONEY IS YOUR's, So DECISION SHOULD HAVE TO BE YOUR's".
━━━━━🟥🟧🟨🟩🟦🟪⬛━━━━━
❇️ Follow notification about periodical View
💥 Do Comment for Stock WEEKLY Level Analysis.🚀
📊 Do you agree with this view?
✈️ HIT THE PLANE ICON if this technical observation resonates with you. It will Motivate me.
━━━━━🟥🟧🟨🟩🟦🟪⬛━━━━━
💡 If You LOOKING any CHART & want for Level and ANALYZE?
Share your desired stock names in the comments below! I will try to analyze the chart Levels, patterns and share my technical view (so far my Knowledge).
If Viewers think It can identify meaningful setups. Looking forward to hearing from all of you — let's keep this discussion going and help each other make better trading decisions.
___________🔕^^^⚫⚪^🙏🏼🙏🏼🙏🏼^⚪⚫^^^🔔___________ XAUUSD — Early Week Pullback Before Bullish Recovery
Gold is trading around $4,167 after recovering strongly from the lower liquidity area. Price is now testing the short-term descending trendline, so the market may first create a pullback before the next bullish continuation attempt.
From an SMC perspective, gold has already swept the lower liquidity twice and created a recovery structure from the bottom. The current move is approaching a trendline reaction area, so an early-week rejection is possible. However, as long as price holds above the $4,095–$4,101 FVG buy zone, the recovery structure can still remain valid.
The main plan for the beginning of the week is to avoid chasing gold at the current price. If price rejects from the trendline area, gold may first pull back toward the $4,095–$4,101 buy zone. This zone is the key area where buyers may defend the structure before pushing price back toward $4,269, $4,283 and the strong liquidity area around $4,382.
Sell scalping setup
Condition:
Gold rejects from the descending trendline area around the current price and fails to break above the short-term resistance.
Entry: $4,167–$4,195 after bearish rejection
SL: above $4,230
TP1: $4,120
TP2: $4,095–$4,101
TP3: $4,029
Buy setup 1
Condition:
Gold pulls back into the FVG buy zone around $4,095–$4,101 and forms bullish rejection with lower timeframe MSS / CHOCH.
Entry: $4,095–$4,101
SL: below $4,029
TP1: $4,167
TP2: $4,269
TP3: $4,283
TP4: $4,382
Buy setup 2
Condition:
If gold breaks above the descending trendline and retests it as support, bullish continuation remains valid without waiting for a deep pullback.
Entry: above $4,195 after breakout retest
SL: below $4,120
TP1: $4,269
TP2: $4,283
TP3: $4,382
Sell setup
Condition:
Selling is not the main priority after a deep pullback. A stronger sell setup is only valid if gold reaches the $4,269–$4,283 FVG sell scalping zone and shows clear bearish rejection.
Entry: $4,269–$4,283 after rejection
SL: above $4,330
TP1: $4,195
TP2: $4,167
TP3: $4,095–$4,101
Key levels
Current price area: $4,167
Short-term trendline resistance: $4,167–$4,195
FVG buy zone: $4,095–$4,101
Sell-side liquidity: $4,029
FVG sell scalping zone: $4,269–$4,283
Strong liquidity: $4,382
Higher FVG resistance: $4,420–$4,455
Bullish continuation confirmation: clean break above $4,195
Bullish target confirmation: clean break above $4,283
Bullish invalidation: clean 2H close below $4,029
My current view is that gold may drop first at the beginning of the week before building another bullish recovery. The Prime Gold plan is to wait for price to pull back into the FVG buy zone around $4,095–$4,101, confirm bullish reaction, then follow the move toward the upper liquidity zones.
No confirmation, no trade.
Long 
MASON XAUUSD – Gold Holds Bullish Structure At Weekly Open
XAUUSD is trading around 4,181 at the start of the week after holding above the recent breakout structure. Price remains inside the rising trendline channel and above the Ichimoku support area, so the short-term bias is still bullish.
The priority view remains buy on pullback, especially if gold retests the 4,172–4,177 buy order zone and continues to hold above the key support area.
Technical View
Gold is still showing a bullish structure after the strong recovery from the 3,960 area. The market has created higher highs and higher lows, which shows that buyers are still controlling the short-term direction.
Price is currently moving inside a rising trendline channel. This channel is important because it shows the path of the bullish momentum. As long as gold holds above the lower trendline, the upside structure remains valid.
Ichimoku also supports the bullish view. Price is trading above the Ichimoku structure, while the cloud and Ichimoku lines below price may now act as dynamic support. This means pullbacks are still healthier than chasing price at resistance.
The 4,172–4,177 area is the key buy order zone on the chart. If gold pulls back into this zone and forms bullish rejection, it may confirm another higher low before continuing higher.
The 4,155 area is the key support zone. If price stays above this level, buyers still have the advantage. A breakdown below 4,155 would weaken the bullish structure and may create a deeper correction.
The main upside target remains the psychological resistance zone around 4,270–4,280, which also aligns with the Fibonacci 2.618 extension area. This is the next major zone where price may react.
Key Zones
Current price: 4,181
Buy order zone: 4,172–4,177
Key support zone: 4,155
Ichimoku support area: 4,093–4,052
Short-term resistance: 4,190–4,200
Psychological resistance zone: 4,270–4,280
Fibonacci extension target: 2.618
Invalidation: below 4,155
Trading Plan
Buy Priority: 4,172–4,177
Condition: wait for bullish rejection, higher low formation, or price holding above the rising trendline and Ichimoku structure.
SL: below 4,155
TP1: 4,200
TP2: 4,240
TP3: 4,270–4,280
Alternative Scenario
If gold breaks above 4,200 directly, wait for a retest of this level as support before looking for continuation toward 4,240 and the psychological resistance zone.
Sell View
Sell is not the priority while price stays above the rising trendline, the buy order zone, and the Ichimoku structure. A sell setup only becomes safer if gold breaks below 4,155 and fails to recover back above the key support zone.
Final View
Overall, gold continues to hold a bullish structure at the start of the week. The cleaner plan is to wait for a pullback into the 4,172–4,177 buy zone instead of chasing price near resistance. If this zone holds, the next upside focus remains 4,200, 4,240, and 4,270–4,280.
Will gold retest the buy order zone first, or continue directly toward the psychological resistance area?
Long 
 Long
Long
TATAELXSI: Descending Channel Meets 200-Month EMAOverview
Tata Elxsi — one of India's premium technology and design services companies — has been in a significant correction since its all-time high of ₹10,760 in 2021. On the Monthly timeframe, a clear Descending Channel has formed, and price is now approaching a critical confluence zone where the Channel Lower Band meets the 200 Monthly EMA at ₹3,283.
This analysis covers multiple timeframes to present a complete picture of where TATAELXSI stands structurally.
The Descending Channel — Monthly View
Since the ATH of ₹10,760 in July 2021, TATAELXSI has been declining within a well-defined Descending Channel — two parallel downward-sloping red lines containing every major swing high and low over the past 4+ years.
The upper boundary has capped every rally attempt. The lower boundary has provided support at each major low. Price is currently sitting near the lower boundary of this channel at ₹3,678 — the most critical support zone within the channel structure.
The Fibonacci Structure
The Fibonacci retracement is drawn from the ATH of ₹10,760 (0) to the pre-rally base of ₹499 (1) — measuring the entire bull run.
Key levels:
0.236 — ₹8,338 (broken)
0.382 — ₹6,840 (broken)
0.5 — ₹5,630 (broken)
0.618 — ₹4,419 (broken)
Current price ₹3,678 — between 0.618 and 0.786
0.786 — ₹2,695 (next major Fibonacci support below)
Price has already broken through the 0.618 Fibonacci level — a deep retracement that signals significant long-term correction.
The Critical Confluence — Channel Lower Band + 200 Monthly EMA
The most important observation on this chart is the approaching confluence of two independent structures:
🔴 Descending Channel Lower Band — the structural support within the channel, currently near ₹3,500–3,600 and declining
🟢 200 Monthly EMA at ₹3,283 — rising from below, approaching current price
These two levels are converging toward each other in the ₹3,283–3,500 zone — creating a powerful confluence support area that price is approaching rapidly.
(See Weekly chart below for a closer view of the channel structure)
The EMA Context
📉 50 Monthly EMA at ₹5,534 — price is far below, acting as major resistance
📉 200 Monthly EMA at ₹3,283 — rising from below, approximately ₹395 below current price
Price trading below the 50 Monthly EMA confirms the long-term bearish structure. The approaching 200 Monthly EMA represents the last major dynamic support on the monthly timeframe.
The Weekly & Daily View — Zooming In
The same Descending Channel is clearly visible on both the Weekly and Daily timeframes — confirming this is not just a monthly artifact but a genuine multi-timeframe structural pattern.
Weekly View:
Channel boundaries are sharper and more precise on the weekly
50 Weekly EMA at ₹4,877 — price well below, confirming medium-term bearish trend
200 Weekly EMA at ₹5,711 — acting as major overhead resistance
This week's candle showing -8.67% — significant selling pressure accelerating the move toward the channel lower boundary
Daily View:
50 Daily EMA at ₹4,784 — price trading well below
200 Daily EMA at ₹4,146 — also above current price
All three timeframes (Daily, Weekly, Monthly) show price below all major EMAs — a rare triple EMA breakdown signaling strong bearish momentum
The confluence is significant — when the same pattern appears on Daily, Weekly, and Monthly simultaneously, the structural significance multiplies. It tells you this is not random noise — it is a genuine long-term trend that demands respect.
Key Levels
🔴 ATH / Pattern Origin — 10,760
🔴 50 Monthly EMA Resistance — 5,534
🔴 0.618 Fibonacci (broken) — 4,419
🟡 Current Price — 3,678
🟢 Channel Lower Band — ~3,500 (dynamic, declining)
🟢 200 Monthly EMA — 3,283 (critical confluence)
🟢 0.786 Fibonacci Support — 2,695
Two Scenarios
🟢 Scenario A — Confluence Holds
Price reaches the Channel Lower Band + 200 Monthly EMA confluence zone (₹3,283–3,500) and finds strong long-term buyers. This would represent a historically significant support test — a potential major reversal zone for TATAELXSI. First recovery target would be the 0.618 Fibonacci at ₹4,419, then progressively higher levels.
🔴 Scenario B — Confluence Breaks
Price breaks below the 200 Monthly EMA at ₹3,283 on a monthly closing basis. This would be a major structural breakdown — signaling a shift toward the 0.786 Fibonacci support at ₹2,695 as the next reference level. A monthly close below ₹3,283 would be historically significant for TATAELXSI.
Beginner's Lesson — Why the 200 Monthly EMA Matters
The 200 EMA on the Monthly timeframe is one of the most watched indicators by long-term investors and institutional traders. It represents the average price over approximately 16–17 years of monthly data — making it a genuine long-term trend indicator.
When a quality stock trades below its 200 Monthly EMA, it typically signals one of two things:
A deep value opportunity — if the stock recovers and reclaims the EMA
A fundamental trend shift — if the stock continues declining below it
This is why the approaching 200 Monthly EMA + Channel Lower Band confluence deserves close attention — the reaction from this zone will tell us which scenario is unfolding.
Important: Monthly timeframe setups play out over months to years — this is not a short-term trade setup. Always combine technical analysis with fundamental research before making long-term investment decisions.
Conclusion
TATAELXSI is approaching one of the most significant technical confluences in its listed history — the Descending Channel Lower Band meeting the 200 Monthly EMA near ₹3,283. Whether this zone holds or breaks will define the stock's trajectory for years to come.
Watch the monthly close carefully over the coming months — it will tell the next chapter.
For educational purposes only. Not financial advice. Always manage your risk.
SENSEX DAILYY/ Short Range Level Analysis: 06th Jul 2026🔕 SGMN SplD BULLISH Above => 77964.
🔕 SGMN SplD Bearish BELOW => 77572.
Mentioned analysis based on 2 consecutive candle close in 15 min Time Frame.
━━━━━🟥🟧🟨🟩🟦🟪⬛━━━━━
💥Level Interpretation / description:
✍🏻L#1: If the candle crossed & stays above the “Buy Gen”, it is treated / considered as Bullish bias. Cfm=> Confirmation.
L#2: Possibility / Probability of REVERSAL near 🔕RL/TF1 & 🔔RL/TF2
L#3: If the candle stays above “Sell Gen” but below “Buy Gen”, it is treated / considered as Sidewise. Aggressive Traders can take Long position near “Sell Gen” either retesting or crossed from Below & vice-versa i.e. can take Short position near “Buy Gen” either retesting or crossed downward from Above.
L#4: If the candle crossed & stays below the “Sell Gen”, it is treated / considered a Bearish bias.
L#5: Possibility / Probability of REVERSAL near 🔕RL/TF1 & 🔔RL/TF2
HZB (Buy side) & HZS (Sell side) => Hurdle Zone,
✍🏻 *** Specialty of “HZB#1, HZB#2 HZS#1 & HZS#2” is Sidewise (behaviour in Nature)
Rest Plotted and Mentioned on Chart
Color code Used:
Green, BLUE =. Positive bias.
Safron, RED =. Negative bias.
RED in Between Green means Trend Finder / Momentum Change
/ CYCLE Change and Vice Versa.
Notice One thing: HOW LEVELS are Working.
Use any Momentum Indicator / Oscillator or as you "USED to" to Take entry.
━━━━━🟥🟧🟨🟩🟦🟪⬛━━━━━
⚠️ DISCLAIMER:
The information, views, and ideas shared here are purely for educational and informational purposes only. They are not intended as investment advice or a recommendation to buy, sell, or hold any financial instruments. I am not a SEBI-registered financial adviser.
Trading and investing in the stock market involves risk, and you should do your own research and analysis. You are solely responsible for any decisions made based on this research.
"🔔As HARD EARNED MONEY IS YOUR's, So DECISION SHOULD HAVE TO BE YOUR's".
━━━━━🟥🟧🟨🟩🟦🟪⬛━━━━━
❇️ Follow notification about periodical View
💥 Do Comment for Stock WEEKLY Level Analysis.🚀
📊 Do you agree with this view?
✈️ HIT THE PLANE ICON if this technical observation resonates with you. It will Motivate me.
━━━━━🟥🟧🟨🟩🟦🟪⬛━━━━━
💡 If You LOOKING any CHART & want for Level and ANALYZE?
Share your desired stock names in the comments below! I will try to analyze the chart Levels, patterns and share my technical view (so far my Knowledge).
If Viewers think It can identify meaningful setups. Looking forward to hearing from all of you — let's keep this discussion going and help each other make better trading decisions.
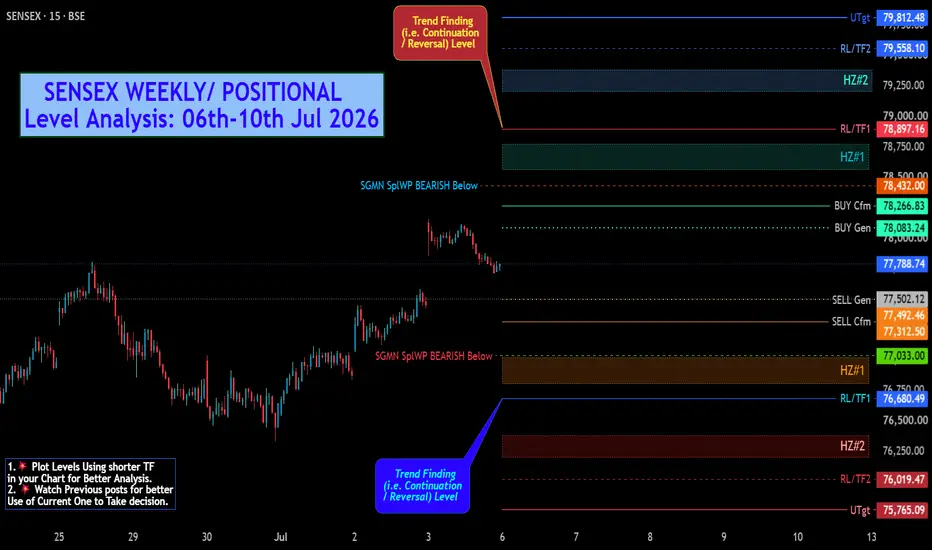
___________🔕^^^⚫⚪^🙏🏼🙏🏼🙏🏼^⚪⚫^^^🔔___________ SENSEX WEEKLY/ POSITIONAL Level Analysis: 06th-10th Jul 2026🔔 SGMN SplD BULLISH Above => 78432.
🔔 SGMN SplD Bearish BELOW => 77033.
Mentioned analysis based on 2 consecutive candle close in 15 min Time Frame.
━━━━━🟥🟧🟨🟩🟦🟪⬛━━━━━
💥Level Interpretation / description:
✍🏻L#1: If the candle crossed & stays above the “Buy Gen”, it is treated / considered as Bullish bias. Cfm=> Confirmation.
L#2: Possibility / Probability of REVERSAL near 🔕RL/TF1 & 🔔RL/TF2
L#3: If the candle stays above “Sell Gen” but below “Buy Gen”, it is treated / considered as Sidewise. Aggressive Traders can take Long position near “Sell Gen” either retesting or crossed from Below & vice-versa i.e. can take Short position near “Buy Gen” either retesting or crossed downward from Above.
L#4: If the candle crossed & stays below the “Sell Gen”, it is treated / considered a Bearish bias.
L#5: Possibility / Probability of REVERSAL near 🔕RL/TF1 & 🔔RL/TF2
HZB (Buy side) & HZS (Sell side) => Hurdle Zone,
✍🏻 *** Specialty of “HZB#1, HZB#2 HZS#1 & HZS#2” is Sidewise (behaviour in Nature)
Rest Plotted and Mentioned on Chart
Color code Used:
Green, BLUE =. Positive bias.
Safron, RED =. Negative bias.
RED in Between Green means Trend Finder / Momentum Change
/ CYCLE Change and Vice Versa.
Notice One thing: HOW LEVELS are Working.
Use any Momentum Indicator / Oscillator or as you "USED to" to Take entry.
━━━━━🟥🟧🟨🟩🟦🟪⬛━━━━━
⚠️ DISCLAIMER:
The information, views, and ideas shared here are purely for educational and informational purposes only. They are not intended as investment advice or a recommendation to buy, sell, or hold any financial instruments. I am not a SEBI-registered financial adviser.
Trading and investing in the stock market involves risk, and you should do your own research and analysis. You are solely responsible for any decisions made based on this research.
"🔔As HARD EARNED MONEY IS YOUR's, So DECISION SHOULD HAVE TO BE YOUR's".
━━━━━🟥🟧🟨🟩🟦🟪⬛━━━━━
❇️ Follow notification about periodical View
💥 Do Comment for Stock WEEKLY Level Analysis.🚀
📊 Do you agree with this view?
✈️ HIT THE PLANE ICON if this technical observation resonates with you. It will Motivate me.
━━━━━🟥🟧🟨🟩🟦🟪⬛━━━━━
💡 If You LOOKING any CHART & want for Level and ANALYZE?
Share your desired stock names in the comments below! I will try to analyze the chart Levels, patterns and share my technical view (so far my Knowledge).
If Viewers think It can identify meaningful setups. Looking forward to hearing from all of you — let's keep this discussion going and help each other make better trading decisions.
___________🔕^^^⚫⚪^🙏🏼🙏🏼🙏🏼^⚪⚫^^^🔔___________