XAUUSD — Is This Recovery Another Selling Opportunity?
Gold is trading around 4,143, attempting to stabilize after another sharp rejection from the 4,190 region. Buyers are showing some reaction near the recent lows, but I'm not convinced this is the beginning of a meaningful reversal.
The market has already lost its short-term bullish structure. What matters now is whether the next recovery can reclaim it.
Looking at the combination of Smart Money Concepts (SMC) and Fibonacci, the chart presents an interesting setup. Gold is recovering beneath
Fibonacci Extension
XAUUSD: Trendline Break or Bull Trap?
Market Context
Gold is starting to show a stronger reaction from the lower demand area after several weeks of bearish pressure.
The main trend has been bearish, with price moving inside a descending structure and respecting the downward trendline multiple times. However, the latest reaction from the lower channel area is important because buyers have finally created a short-term CHoCH and pushed price back above the immediate bearish pressure zone.
This does not mean gold has fully turned b
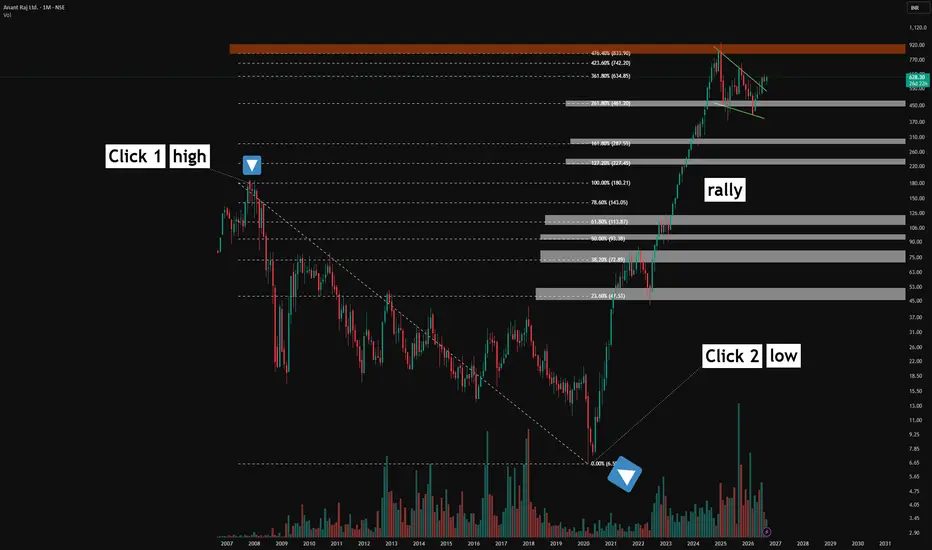
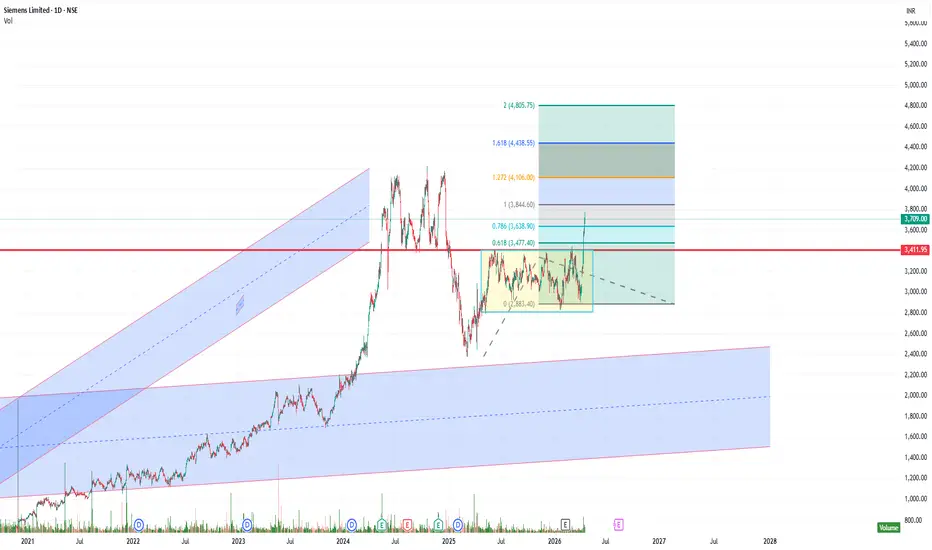
A Masterclass in Fibonacci ExtensionsAll price action shown in this chart is historical and older than three months. This post is purely educational and observational in nature. It is not a forecast or a trading recommendation.
Setting Up the Fibonacci Tool
To build this study, the Fibonacci tool was anchored using two clicks on the monthly timeframe. The first click, marked as Click 1, was placed at the swing high. The second click, marked as Click 2, was placed at the swing low, capturing the full downtrend that unfolded on t
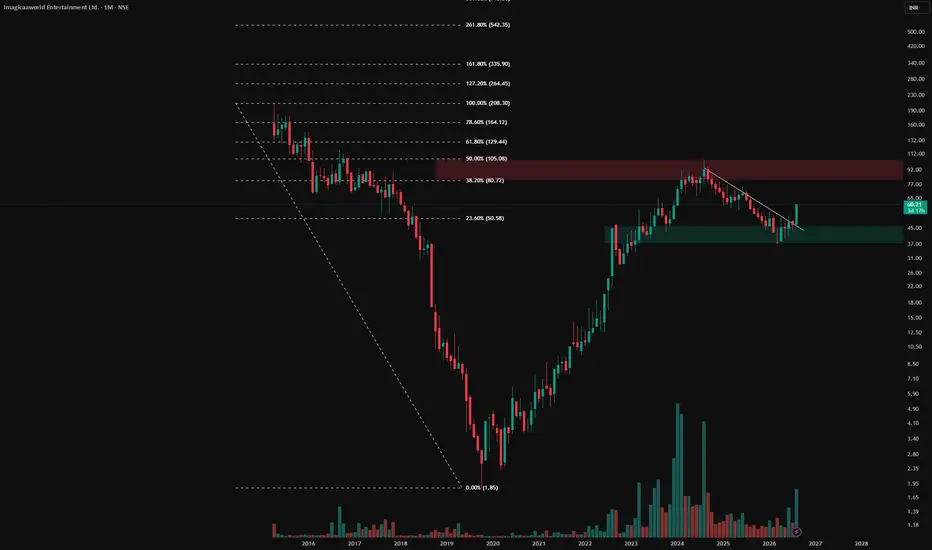
Flipping the Fibonacci ( Concept and Price action ) This post is educational and observational in nature based on historical price action. It is not a forecast or a trading recommendation.
The Reverse Fibonacci Approach
In a typical Fibonacci retracement, the swing low is anchored as the zero point and the swing high as the one point, measuring a retracement within an upward move. In this chart, that logic has been reversed. Since this stock is in a downtrend, the swing high has been anchored as the zero point and the swing low as the one poi
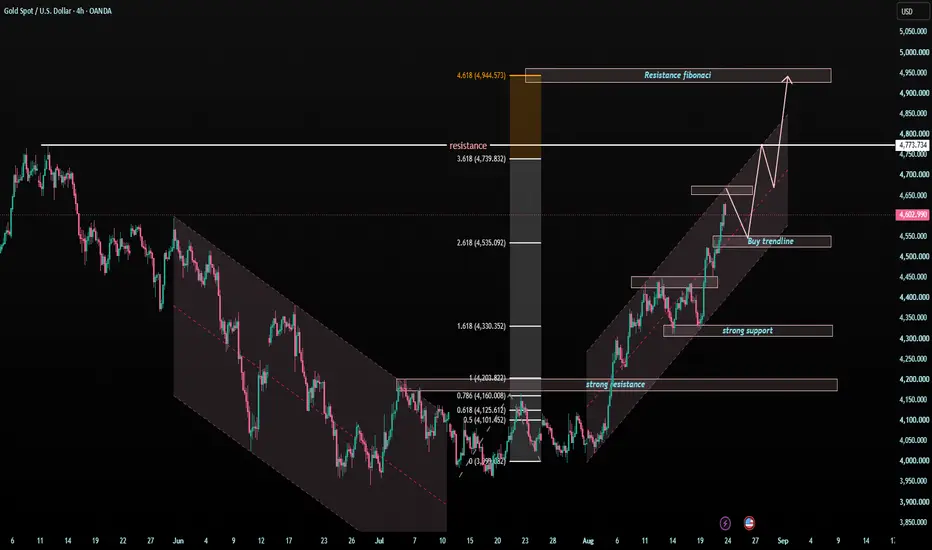
XAUUSD — 4,550 Holds, 4,945 Opens?XAUUSD — 4,550 Holds, 4,945 Opens?
Gold is now trading inside a strong bullish recovery channel after breaking away from the old bearish structure.
The market has already shifted from accumulation into expansion, and price is now holding around 4,600.
The trend is clearly bullish.
But after a strong move, the best plan is still not to chase the candle.
The simple read
Gold is currently moving above the buy trendline area.
As long as price holds above the 4,535 - 4,550 support zone, buyers
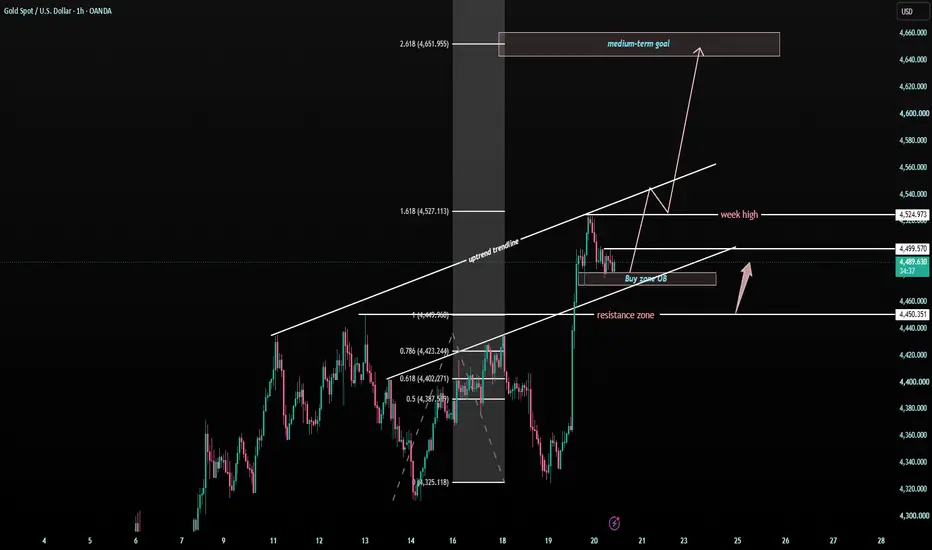
XAUUSD — 4,500 Is the Gate to 4,650?🌸 XAUUSD — 4,500 Is the Gate to 4,650?
Gold is showing a strong bullish structure after breaking above the previous resistance zone.
The market pushed sharply from the lower support area and is now trading around 4,480 - 4,500, right under the short-term breakout line.
This is where the chart becomes very interesting.
The trend is bullish.
But after a strong move, I still do not want to chase the candle.
I want to see if buyers can defend the new structure.
The simple read
4,500 is the f
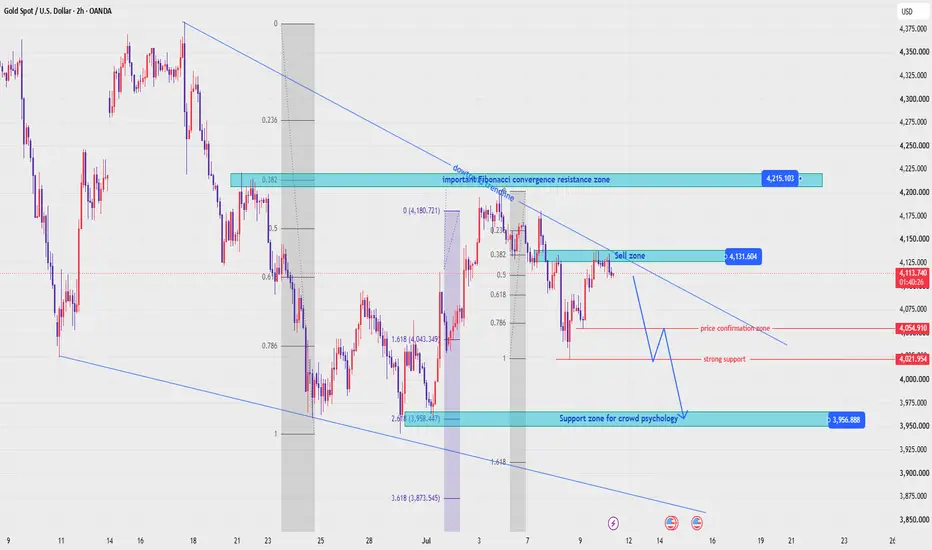
XAUUSD — Bearish Continuation Toward Fibonacci Target
Fundamental Analysis
Gold remains sensitive to USD momentum, Treasury yields, and upcoming U.S. macro data. For next week, the technical bias still leans bearish while price stays below the major descending structure.
Technical Analysis
On the 4H chart, XAUUSD is trading around 4,017 after losing momentum under the downtrend trendline. The nearest sell reaction zone is around 4,050 - 4,070, where price may retest the Fibonacci sell area before another downside move. If this zone rejects price
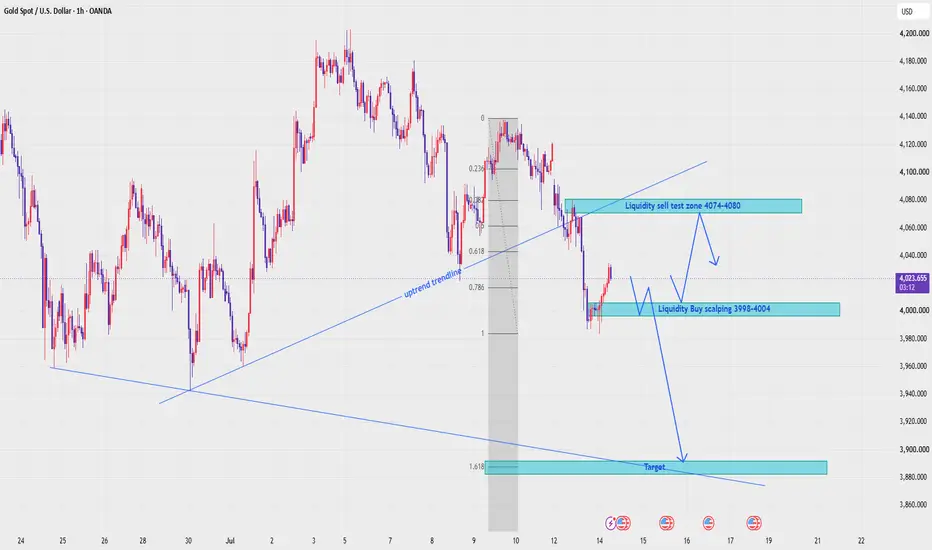
XAUUSD — Bearish Pressure Below Liquidity Sell Zone
Fundamental Analysis
Gold remains sensitive to USD momentum, Treasury yields, and upcoming U.S. macro data. For now, the market is still showing defensive price action, with sellers controlling the structure after price failed to hold above the previous trendline.
Technical Analysis
On the 1H chart, XAUUSD is trading around 4,026 after breaking below the short-term uptrend structure. The nearest reaction area is the liquidity buy scalping zone at 3,998 - 4,004, where price may create a short b
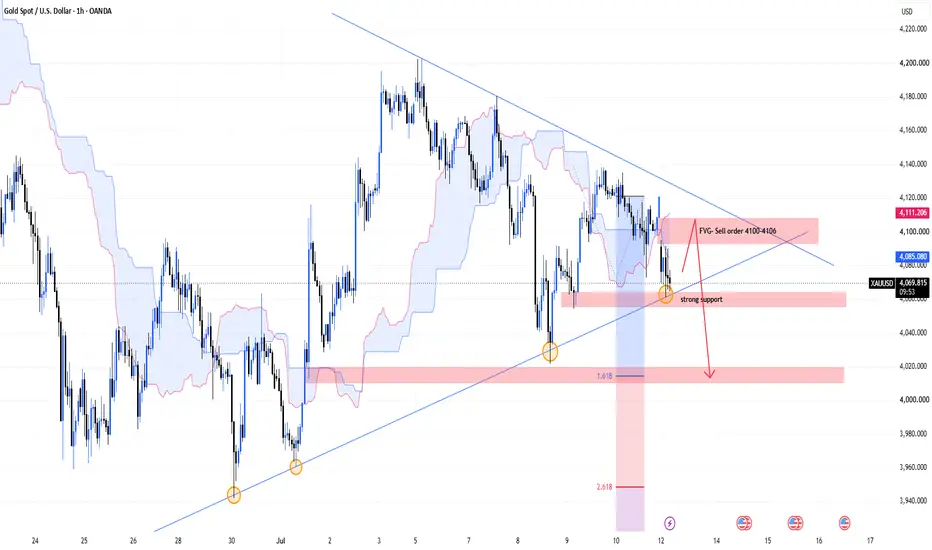
MASON XAUUSD – Trendline Break May Target FibonacciXAUUSD is trading around 4,071 after losing short-term recovery momentum near the Ichimoku structure. Price is now testing the rising trendline support, and the early-week focus is on whether gold can hold this structure or break lower.
The priority view is bearish if gold breaks below the trendline and strong support area. A clean breakdown may open the way toward the Fibonacci extension targets.
Technical View
Gold is currently moving inside a tightening structure between the descending resi
MASON XAUUSD – Accumulation Inside Bearish Channel
XAUUSD is trading around 4,120 while still moving inside the medium-term descending channel. Although the broader structure has not fully broken out yet, gold is showing strong accumulation around the lower-middle area of the channel.
The priority view is that gold may continue building a base above the 4,080–4,095 buy zone before attempting a stronger medium-term recovery toward the upper resistance zones.
Technical View
Gold is still inside a bearish price channel on the 6H structure. The
XAUUSD — Bullish Channel Holds Above Buy Zone
Fundamental Analysis
Gold is still reacting to USD momentum, Treasury yields, and upcoming U.S. macro data. For now, the short-term structure remains positive while price continues to hold inside the rising channel.
Technical Analysis
On the 2H chart, XAUUSD is trading around 4,142 and still respecting the bullish channel structure. The main buy order trendline zone is around 4,141 - 4,143. If price holds this area, buyers may continue to defend the trend and push gold toward the liquidity zo
MASON XAUUSD – Gold Holds Bullish Structure At Weekly Open
XAUUSD is trading around 4,181 at the start of the week after holding above the recent breakout structure. Price remains inside the rising trendline channel and above the Ichimoku support area, so the short-term bias is still bullish.
The priority view remains buy on pullback, especially if gold retests the 4,172–4,177 buy order zone and continues to hold above the key support area.
Technical View
Gold is still showing a bullish structure after the strong recovery from the 3,960 area. The ma
XAUUSD — Sell From Fibonacci Value Zone With EMA TrendXAUUSD — Sell From Fibonacci Value Zone With EMA Trend
Fundamental Analysis
Gold remains under pressure as traders continue to watch USD strength, Treasury yields, and upcoming U.S. macro data.
For now, the technical structure still favours sellers while price trades below the main EMA resistance area. Any recovery should be treated as a pullback unless gold can reclaim the EMA value zone with strong confirmation.
Technical Analysis
On the 4H chart, XAUUSD is still moving inside a bearish s
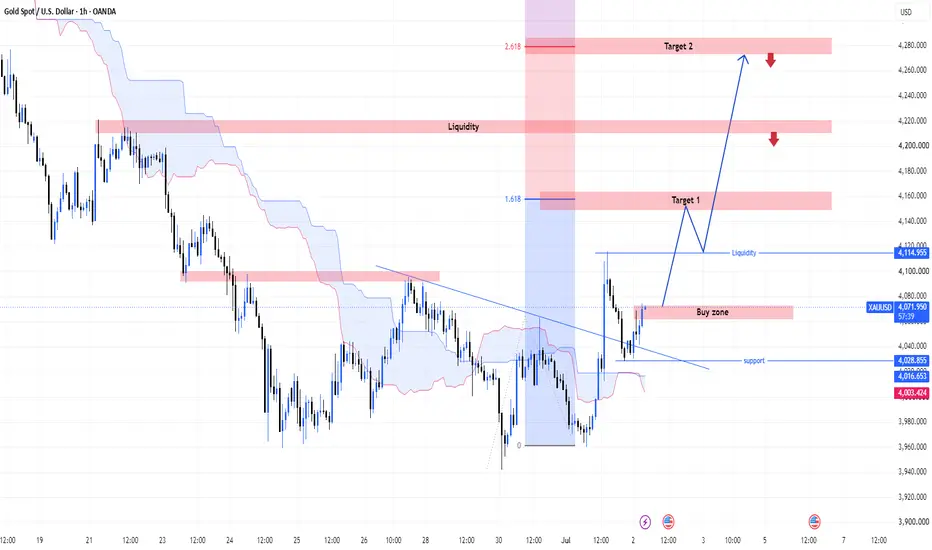
MASON XAUUSD – Trendline Break Confirms Bullish Recovery
XAUUSD is trading around 4,070 after breaking above the descending trendline and recovering above the Ichimoku structure. This breakout changes the short-term structure from bearish pressure into a bullish recovery phase.
The priority view is buy on pullback, as long as gold continues to hold above the broken trendline and the nearest support zone.
Technical View
Gold has broken above the descending trendline that previously capped the upside move. This is an important shift because the mark
XAUUSD — Medium-Term Bearish Shift Below EMA Structure
Fundamental Analysis
Gold remains under pressure as the market continues to watch USD momentum, Treasury yields, and upcoming U.S. macro data.
For now, the medium-term structure is weakening. As long as gold trades below the main EMA area, recovery attempts should be treated as technical pullbacks rather than a full bullish reversal.
Technical Analysis
On the daily chart, XAUUSD is showing a clear medium-term bearish shift. After failing to hold the higher structure near the previous swing
MASON XAUUSD – Important Rebound Zone AheadMASON XAUUSD – Gold May Rebound Toward Fibonacci Before Next Decision
XAUUSD is trading around 3,997 after a strong bearish move inside the descending channel. Price remains below the Ichimoku cloud, so the main structure is still bearish.
However, gold is reacting near the strong liquidity zone and buy area around 3,960–3,990, so a short corrective rebound may appear before the next trend confirmation.
Technical View
Gold is still moving inside a clear bearish channel. The market has been cr
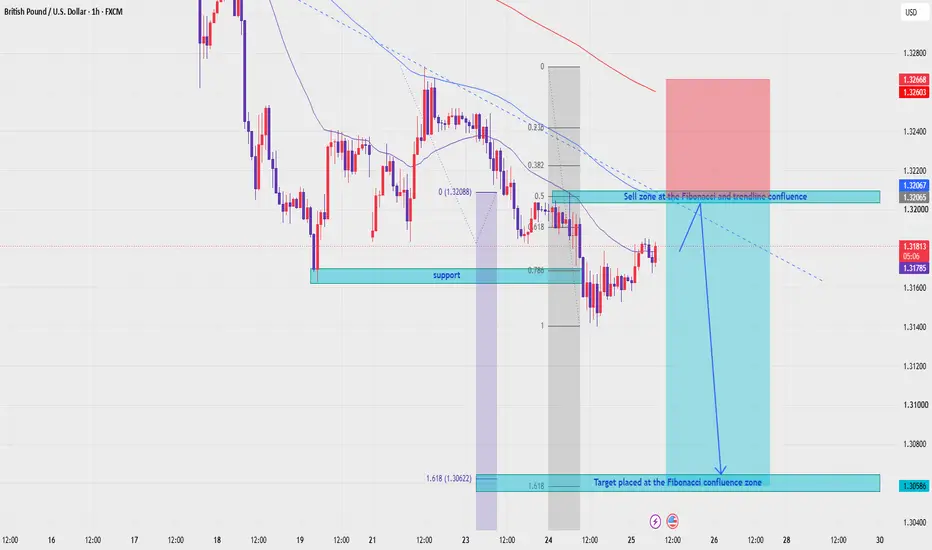
GBPUSD — EMA Bearish Trend, Sell From Fibonacci Confluence
Fundamental Analysis
GBPUSD remains under pressure as traders continue to watch USD momentum, U.K. data, and broader market risk sentiment.
For now, the technical structure still favours sellers while price trades below the main EMA range. Any recovery should be treated as a corrective pullback unless GBPUSD can reclaim the key resistance zone with strong confirmation.
Technical Analysis
On the 1H chart, GBPUSD is still trading below EMA 34, EMA 89, and EMA 200. This confirms that the shor
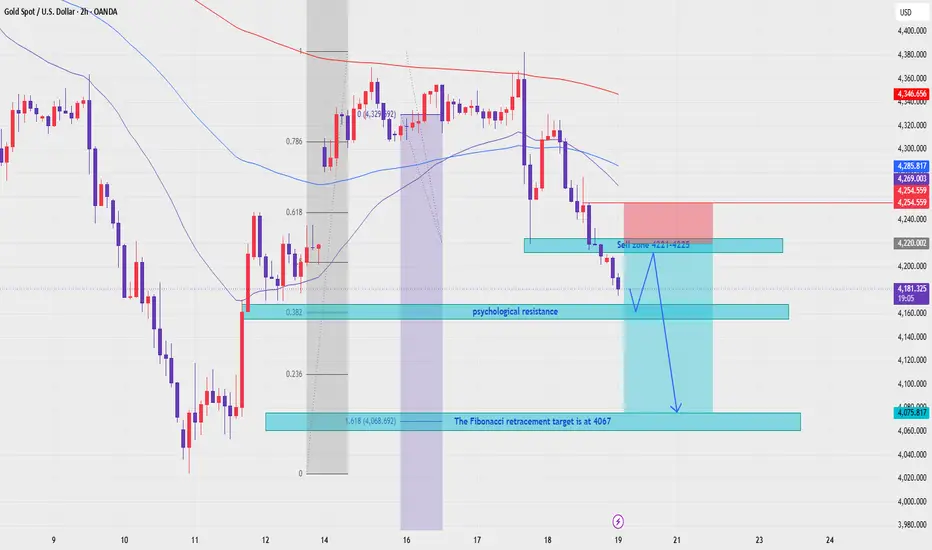
XAUUSD — EMA Bearish Trend, Fibonacci Confluence Target in Focus
Fundamental Analysis
Gold remains under pressure as price continues to trade below the main EMA structure. Traders are still watching USD momentum, Treasury yields, and upcoming U.S. macro data.
For now, the technical structure still favours sellers while recovery attempts remain weak below EMA resistance.
Technical Analysis
On the 2H chart, XAUUSD is trading below EMA 34, EMA 89, and EMA 200. This confirms that the short-term trend remains bearish, with the EMA structure acting as dynamic
MASON XAUUSD – Downtrend Still Dominates, Rebound Is Secondary
XAUUSD is trading around 4,062 after another strong bearish move. Price remains below the Ichimoku cloud and below the broken trendline, so the main structure is still bearish.
The primary view is sell continuation, while the secondary scenario is a short technical rebound before the next confirmation.
Technical View
Gold is still moving under clear bearish pressure after breaking the previous trendline support. The latest reaction around 4,054 shows that price is testing a strong liquidity
MASON XAUUSD – Gold Breaks Trendline, Sell Continuation In Focus
XAUUSD is trading around 4,140 after a strong bearish move. Price has broken below the short-term rising trendline and remains below the Ichimoku cloud, showing that sellers are still controlling the structure.
The main view is sell continuation, especially if price retests the broken trendline or previous support zones.
Technical View
Gold has broken the rising trendline that previously supported the recovery wave. This is an important signal because the market is no longer respecting the s
XAUUSD — EMA Bearish Trend, Fibonacci Target in Focus
Fundamental Analysis
Gold remains under pressure as traders continue to watch USD strength, Treasury yields, and upcoming U.S. macro data.
For now, the structure still favours sellers while XAUUSD trades below the main EMA range. Any recovery should be treated as a technical pullback unless price can reclaim the EMA resistance zone with strong confirmation.
Technical Analysis
On the 2H chart, XAUUSD is trading below EMA 34, EMA 89, and EMA 200. This confirms that the current trend remains
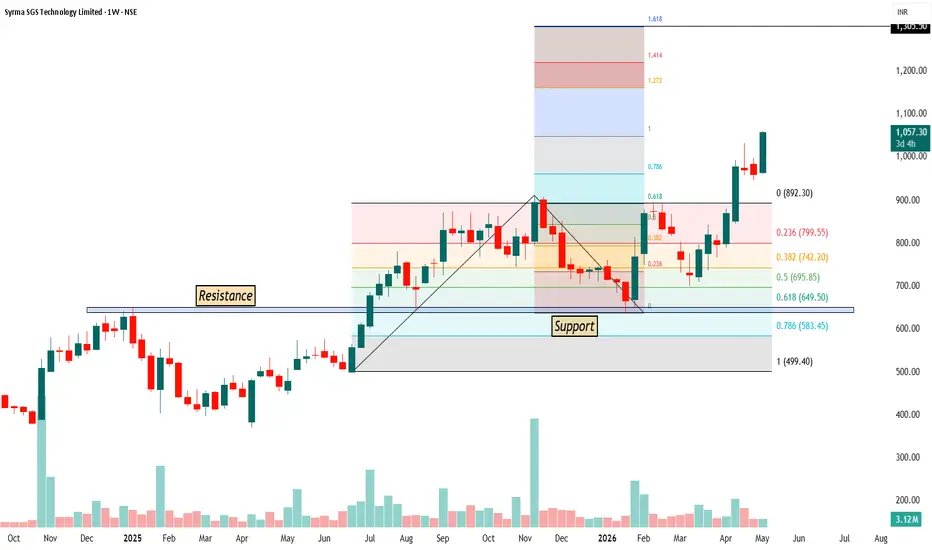
SYRMA - Fibonacci and Fibonacci Trend Based - WeeklyFirst, the normal Fibonacci retracement is applied from the swing low to the swing high to understand where price can take support during a pullback. In this chart, price came down into the 0.5 to 0.618 zone, which is considered a strong buying area. This zone also matched with the horizontal support, so buyers entered from there and pushed the price up.
Now coming to the trend-based Fibonacci, it is used to understand the continuation of the trend and future targets. For this, we take three po