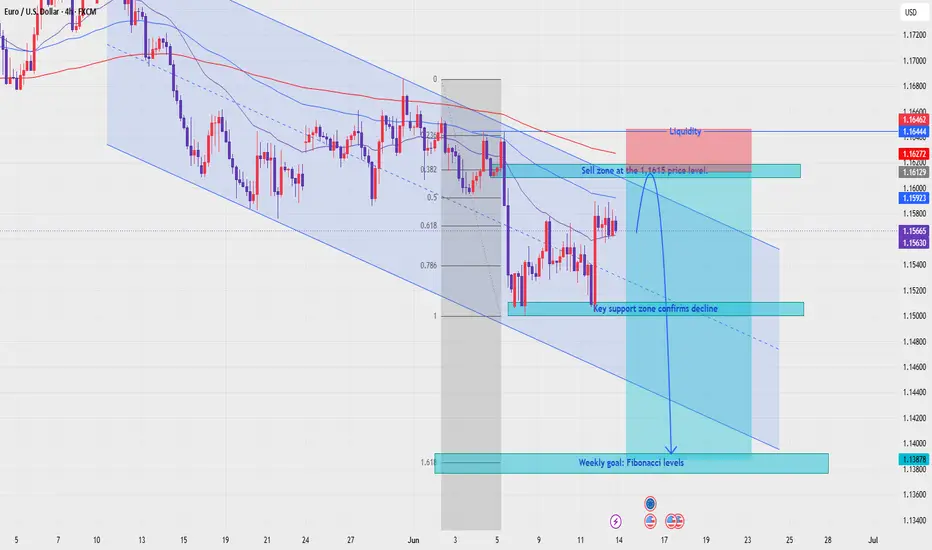
EURUSD — EMA Bearish Trend, Sell From Value Zone
Fundamental Analysis
EURUSD remains under pressure as the market continues to watch USD momentum, Fed expectations, and upcoming U.S. macro data. If the dollar stays supported, recovery attempts on EURUSD may remain limited.
For next week, the main focus is whether price can retest the value zone above before continuing lower in line with the EMA trend.
Technical Analysis
On the 4H chart, EURUSD is still trading inside a descending channel. EMA 34, EMA 89, and EMA 200 remain above price, sh
Fibonacci Retracement
Firstsource looks to be cranked up for ATH levels!Uncertainty in global economy is causing a slowdown in overall IT industry.
However, FSL is looking all good for a strong reversal.
The volume at 50% Fib retracement support is an indicator of the same.
Q4 Revenue & EBITDA posted by company is at record high.
Stock can be one of the earliest stock to reach ATH if IT sector starts to recover. Don't miss to keep this in your watchlist.
The risk is around 15% and reward is more than 50%.
This is not a recommendation and is strictly for educationa
VBL Monthly The chart shows a descending trendline formed after the correction from higher levels. Recently, price has started moving toward this trendline resistance and is attempting to break above it.
The latest candle suggests:
• Buyers are becoming active near lower levels
• Price is trying to shift from correction mode to recovery mode
• A breakout above the trendline can signal the beginning of a fresh bullish phase
• Bullish confirmation: Monthly close above 560 with good volume
• Strong bullish
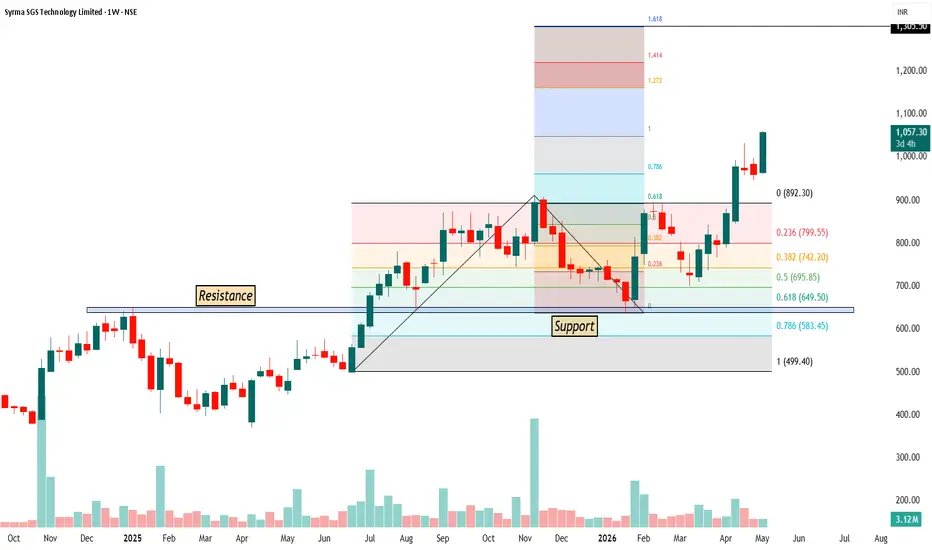
SYRMA - Fibonacci and Fibonacci Trend Based - WeeklyFirst, the normal Fibonacci retracement is applied from the swing low to the swing high to understand where price can take support during a pullback. In this chart, price came down into the 0.5 to 0.618 zone, which is considered a strong buying area. This zone also matched with the horizontal support, so buyers entered from there and pushed the price up.
Now coming to the trend-based Fibonacci, it is used to understand the continuation of the trend and future targets. For this, we take three po
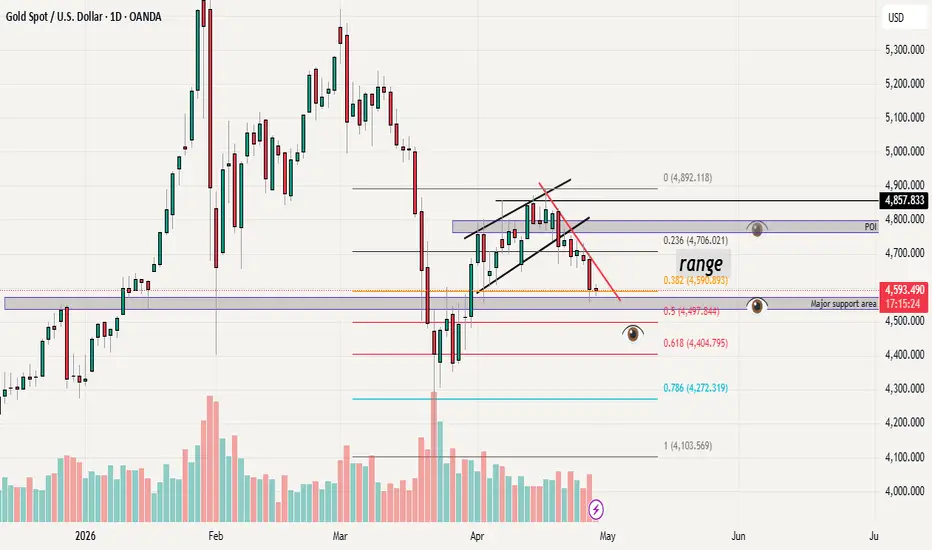
GOLD May 1 | Support Holds. Bounce in Play. Volume MissingThe 4530-50 major support area did its job again. Gold tested it on Wednesday, bounced yesterday with a solid green candle, and is now at 4618. Every time price touches 4530-50, buyers step in. The support is real.
But here is the concern. Look at the volume bars on the chart. They are shrinking. Yesterday's bounce happened on low volume. A bounce without volume is a bounce without conviction. It could be short covering rather than fresh buying. We need follow through today to confirm this is mo
GOLD Apr 29 | Breakdown from 4650. FOMC Tonight. Yesterday price breakdown from 4650 support and tested the major support area at 4530-50 before bouncing back to 4600.
Looking at the chart, the picture is clear. The descending trendline (red) from the 4892 high is now acting as overhead resistance, pushing price lower with each attempt. The 4650 level that held for weeks as support has flipped to resistance.
What triggered the selloff:
A US official revealed that Trump rejected Iran latest proposal to resolve the two-month conflict, dimmi
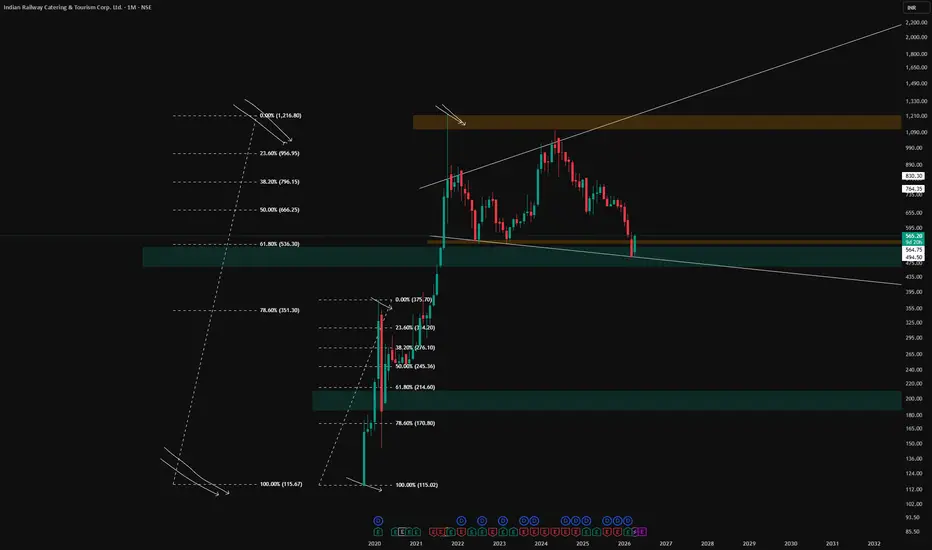
Fibonacci and the Broadening Beast on the Monthly📝 DESCRIPTION
🏆Overview
This post is purely educational and non-directional in nature. No forecast is being made. No bias is being expressed. What you are looking at is a retrospective study — a look back at how price has historically interacted with specific technical confluences on the Monthly timeframe. The charts used here are based on historical price action only.
🏆The Fibonacci Tool — Applied Twice, Intentionally
The Fibonacci retracement tool has been applied twice in this study — eac
Union Bank :-12-year Cup & Handle (Monthly)
This is a textbook cup & handle on the monthly timeframe — one of the highest-reliability bullish continuation patterns. The cup base formed over roughly 2014–2025, with the rim at ₹190–200. The stock broke above that rim in early 2026, and the current candle is pulling back to retest it — that pullback IS the handle.
Indicators confirm:
RSI at 64.48 — strong momentum without being overbought. Plenty of room to run before hitting 70–80.
MACD histogram is turning positive with the signal line
XAUUSD (H1) — NFP Day Sell remains the main plan while price stays below the descending trendline
Today is an NFP session, and gold often whipsaws both sides before the real direction shows up. So instead of guessing tops/bottoms, the focus is on levels + reaction.
On H1, the structure is still under pressure: price remains below the descending trendline, and the bounces so far look like technical pullbacks within a short-term bearish phase.
Key zones on the map
Sell zone (primary focus)
Around 5,150 – 5,165 (s
HDFC Bank Pullback Into Support Zone — Watching for a ReactionPrice had been respecting a rising trendline for most of this move up, but that structure has now broken with a strong push down. The drop also took price below the 21W VWMA (Yellow), which signals short-term momentum has shifted.
Right now price is sitting around the 0.382 Fibonacci retracement (~865) and trying to stabilize. If selling continues, the next areas I’m watching are ~834 (0.5 Fib) and ~789 (0.618 Fib + strong demand zone).
The bigger picture trend is still intact for now, but thi
SCHNEIDER: Posted Execllent Q3FY26 Numbers, Chart of the MonthSchneider Electric Infrastructure: The Power Play That Just Reclaimed a Critical Level, and the Clock Is Ticking for Bulls after the Company Posted Excellent Q3FY26 Numbers. Let's understand in our "Chart of the Month."
As per the Latest SEBI Mandate, this isn't a Trading/Investment RECOMMENDATION nor for Educational Purposes; it is just for Informational purposes only. The chart data used is 3 Months old, as Showing Live Chart Data is not allowed according to the New SEBI Mandate.
Disclaim
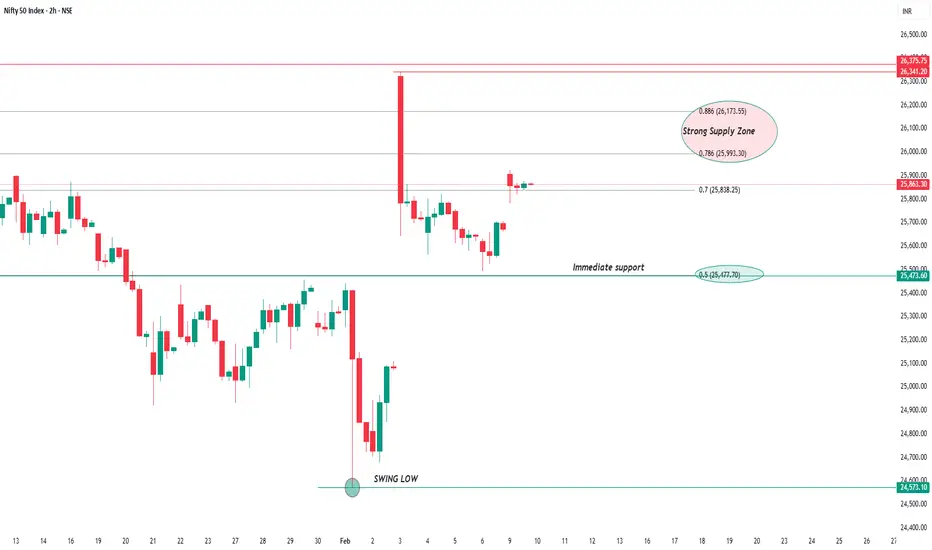
NIFTY 50 – 2H TF ANALYSIS FOR 10.02.26NIFTY currently trading around the 0.7 Fibonacci retracement (~25,838) which is acting as an immediate decision level.
📊 Market Structure:
• Overall structure still corrective (range bound after displacement)
• Sharp rejection candle near highs = possible distribution wick
• Price approaching higher timeframe supply
🧠 Key Levels:
🔼 Strong Supply Zone: 25,993 – 26,173
If price reaches this zone → look for bearish confirmation
🔽 Support Levels:
25,838 – Intraday decision level
25,477 – Major su
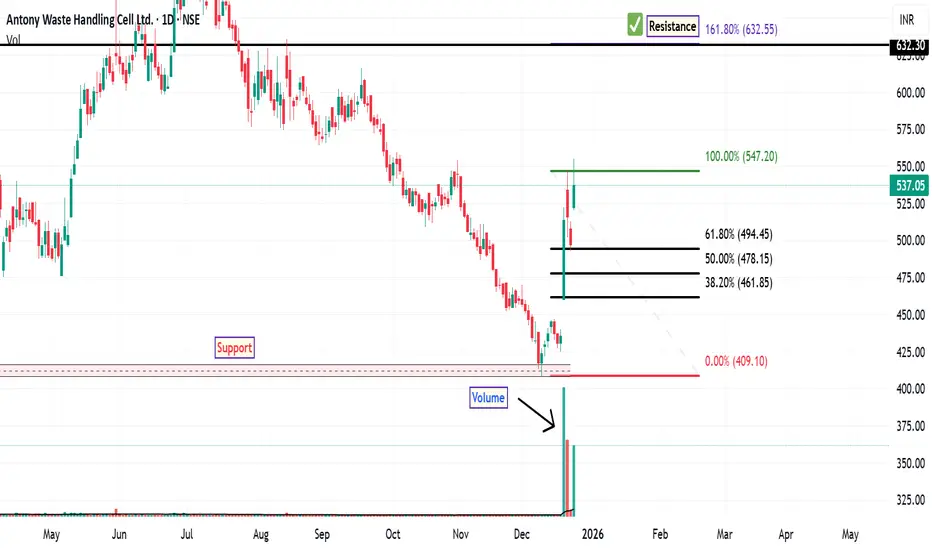
AWHCL: Signs of Trend ReversalThe stock of AWHCL has shown signs of recovery after a prolonged downtrend that began in September. Recent price action suggests a potential shift in momentum, supported by multiple technical factors across daily and weekly timeframes.
The stock has bounced from a long-term support level marked on the chart. The recent retracement from the swing high and higher low aligns with the 61.8% Fibonacci level, a zone often considered significant for trend continuation, indicating strong bullish mome
Bank Nifty - 23rd December Levels with TrendLines Bank Nifty – 23rd December Levels with Trendlines
Yesterday, only supply was created.
On Friday, that supply turned into demand.
If the market opens with a gap-up, then 23rd December supply will act as demand.
Check my Fibonacci levels – they are the most important for understanding the overall monthly direction.
Parallel Channel, Stubborn Gap & 0.5 Equilibrium RejectionDaily Timeframe Details
The left chart on the daily timeframe displays a parallel channel structure forming after an initial one-sided move.
A significant gap emerged within this leg, which price has approached multiple times—first entering the gap area from below but rejecting sharply to form a higher low, then pushing toward a higher high without fully filling it.
This illustrates how gaps often resist easy fills from either direction, acting as persistent reference zones that demand conflu
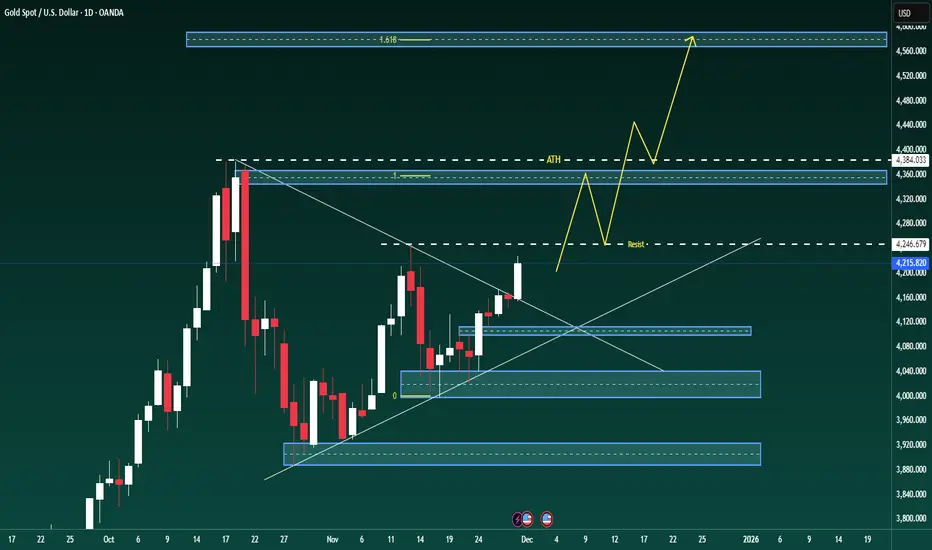
XAUUSD – Weekly outlookXAUUSD – Weekly outlook: structure points towards 4,580 as long as bulls hold the line
Brian – Favouring buy-the-dip setups while price holds above 3,996
1. Market overview – triangle break and trend confirmation
On the daily chart, gold has finally broken out of the long consolidation triangle, with Friday’s candle closing cleanly above the descending trendline that has capped price for weeks.
For me, this breakout is the first proper confirmation that the primary bullish trend is resuming.
FVG Retracement With EMA, RSI & Fib Confluence📈 Bitcoin Chart – FVG Retracement With EMA, RSI & Fib Confluence in a Bearish Market Structure
This chart showcases a sustained bearish sequence on BTC, defined by a clean continuation of Lower Highs (LH) and Lower Lows (LL). Throughout this decline, multiple Fair Value Gaps (FVGs) have formed both locally and at higher levels — each created by strong institutional sell-side displacement.
As price trends downward, these unmitigated FVGs above the market consistently act as magnet zones:price
Possibility Due To Weak TrendTrend Started Became Weak
I already for daytime frame
this 4h time frame channel breakdown already happened may take support from fib level 0.6 but possible to maybe price come to 0.7 level easily.
Reverse Scenario:
Break his channel high price level
🧠 Always DYOR (Do Your Own Research)
⚖️ This is not financial advice or suggestion
👉 “Risk Is Real 💸 Stay Practical🚀”
💬 Please feel free to ask any questions (It's Free)
BINANCE:STRKUSDT
Symmetrical Triangle Structure & Key EquilibriumEditorial Insights
- Symmetrical triangles signal a balanced tug-of-war between buyers and sellers; this compression, as mapped here, often precedes significant expansions in volume and volatility.
- The triangular structure’s edges—CT (red) and trendline (green)—have been tested repeatedly over months, reflecting both supply absorption and demand resilience.
- The hidden white line adds a subtle layer of convergence, useful for traders identifying areas of potential liquidity concentration.
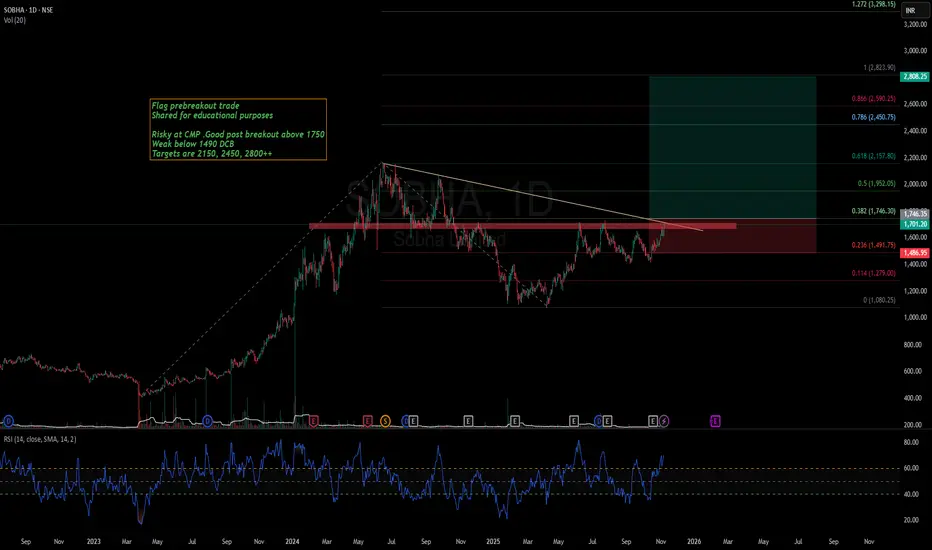
Sobha- A breakout of consolidation is on cardsRealty sector has been performing well post Q2 results announcements.
Sobha has posted stellar Q2 numbers but it might be one off quarter as well.
Technically, stock is looking ripe for a good flag breakout of consolidation.
We might soon see a breakout coming but sustainment of breakout is crucial for further upmove.
Levels are mentioned on chart. We can see upside of more than 50% if breakout sustains.
You can also check other realty sector stocks and see if any similar pattern is visible.
P