Gold 15 minsGOOD FOR SCALPING
Bias: BULLISH 🟢
Reason:
Bullish CHOCH
Bullish BOS
Strong breakout candle
Retest of flip zone
Volume confirmation
As long as 4170 support holds, I would expect a continuation toward 4205 → 4225 → 4250 rather than a new selloff.
Probability
Buy Continuation: 65-70%
Bearish Failure: 30-35%
Fundamental Analysis
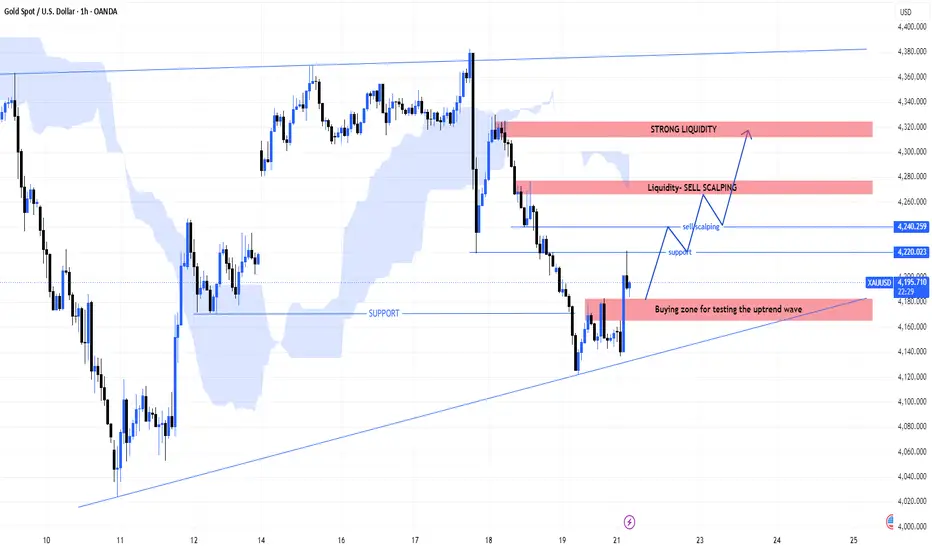
MASON XAUUSD – Gold Tests Uptrend Buy Zone
XAUUSD is trading around 4,191 at the start of the week. Price is reacting from the marked buy zone and still respecting the rising trendline, showing that buyers are trying to rebuild the short-term uptrend.
The main view is bullish recovery, but confirmation above 4,220–4,240 is still needed.
Technical View
Gold reacted accurately from the 4,160–4,180 buy zone, which is also close to the rising trendline support. This area is important because it shows where buyers are defending the curren
NIFTY 50 — 5 Min | Intraday Structure & Key Levels (June 21 closPrice action: Nifty saw a sharp intraday decline into the 13:00–14:45 session, bottoming near 23,915–23,920. From there, a strong impulsive move reversed price, pushing it back up through 24,000 and into the session close around 24,044.
Key levels on chart:
🟦 Demand zone: 23,860–23,900 (pivot 23,883.55) — origin of the sharp reversal candle
🟥 Mid-level: 24,015.55 — intraday pivot, acted as resistance-turned-support during the final push up
🟦 Supply zone: 24,180–24,200 (pivot 24,189.85) — untest
BTCUSDT | Liquidity Sweep + Multi-Timeframe MSS Bearish SetupThe trade idea is based on a classic Smart Money Concepts narrative:
✅ 1H Supply Zone
✅ Buy-Side Liquidity Sweep
✅ 15M Bearish MSS
✅ 5M Entry Confirmation
✅ Premium Pricing
✅ Favorable Risk-to-Reward
As long as price remains below the sweep high, the expectation is for a move toward the next pool of sell-side liquidity and lower demand levels.
Trade the reaction, not the breakout.
EURUSD — Bearish Continuation From Fibonacci Value Zones
Fundamental Analysis
EURUSD remains under pressure as price trades below the main EMA structure. For next week, traders should continue watching USD momentum, Fed expectations, and upcoming U.S. data, as these factors may drive volatility around key Fibonacci zones.
For now, the technical structure still favours sellers while recovery attempts remain capped below EMA resistance.
Technical Analysis
On the 4H chart, EURUSD is still moving inside a descending structure. EMA 34, EMA 89, and EM
XAUUSD Weekly Plan — Is Gold Walking Into Another Seller Test?
Gold is entering a very important week.
Price is trying to hold above the lower structure, but the bigger picture still shows one clear thing:
The descending trendline is still controlling the market.
THE SIMPLE READ
Gold is still moving under a major bearish trendline.
That means every recovery needs to be tested carefully, especially when price is approaching a short-term Order Sell zone.
Right now, gold is trading around the 4,155 area. The market is not too far from the 4,180 - 4,220
HOOD: Retail Renaissance Fuels Explosive UpsideRobinhood (HOOD) is entering a powerhouse "Super Bullish" phase, catalyzed by a seismic shift in retail participation. The recent SEC decision to eliminate the $25,000 pattern day-trading requirement is a structural game-changer, effectively unlocking high-frequency trading for millions of smaller accounts. Combined with record February 2026 operating data—showing a 36% YoY surge in equity volumes and a staggering 98% jump in margin balances—the fundamental engine is firing on all cylinders.
Te
Why Nifty 50 is Primed for a Massive Re-Rating | BULLISHThe Nifty 50 index presents a compelling, "super bullish" structural opportunity. After underperforming for the last two years, the broader Indian market is now an incredibly attractive destination for global capital. While the rest of the world crowds into expensive software and hardware technology, India stands out as the ultimate "anti-AI trade"—an economy positioned to maximize and leverage AI adoption across its massive, digitally native enterprise and consumer landscape.
From a fundamenta
XRP Short Opportunity | ABC Pattern + Resistance RejectionXRP is currently showing a clear bearish structure after breaking the trendline.
Price ne upward trendline break kiya hai jo weakness indicate karta hai. Ab market me ABC correction pattern form ho raha hai:
(A) – Initial drop (selling pressure start)
(B) – Short pullback / retest zone
(C) – Final leg down (possible target area)
🔴 Resistance Zone: 1.14 – 1.16
🟢 Target Zone: Around 1.05
Agar price resistance zone me reject hota hai, toh strong downside continuation dekhne ko mil sakta hai.
⚠
Gold Below 4170 — What's Next?📌 Macro Highlights
• Gold has broken below the key support zone at 4170, indicating that sellers remain in control in the short term.
• U.S. markets are closed today for a Bank Holiday, which could significantly reduce liquidity and limit market volatility.
• Price is likely to continue trading within a narrow range until a new market catalyst emerges.
📌 Trading Plan
Resistance: 4180–4201 | 4230–4240
Support: 4100–4080 | 4050–4060
📌 Personal View
✅ The current downtrend remains dominant.
BRIAN XAUUSD – GOLD STAYS ABOVE 4,300 AS USDBRIAN XAUUSD – GOLD HOLDS ABOVE 4,300 AS USD PULLS BACK
Gold is attracting fresh buying interest in Thursday’s Asian session and has moved back above 4,300. The short-term support comes from renewed optimism around a temporary US-Iran peace framework, which is pulling the US dollar lower after its post-Fed strength.
From a macro view, the electronically signed MoU between the US and Iran, together with the softer tone around the 60-day negotiation deadline, has improved investor confidence and
The Gold Paradox: How the U.S.-Iran Peace Deal is Rewiring GOLDTake a look at the attached 4H chart. We are currently trading at $4,177.03, sitting right in the crosshairs of a massive institutional liquidity hunt.
While the lower timeframes look incredibly messy, the higher timeframe structure is telling a very clear story. Below is the exact technical breakdown of the levels I am watching, followed by the major macroeconomic shifts—and current geopolitical uncertainties—driving this entire move.
📊 1. Technical Analysis: Chart Breakdown & Key Levels
Th
Brian Gold holding above 4,300 ahead.BRIAN XAUUSD – GOLD HOLDING ABOVE 4,300 AHEAD OF FOMC
Gold is struggling to extend its weekly recovery, but price is still holding above the 4,300 area during the Asian session. The market is not in a clean breakout phase yet. Buyers are defending the upper structure, but momentum remains limited ahead of the FOMC decision.
From a macro view, optimism around a temporary US-Iran peace agreement is keeping the US dollar under pressure, which gives gold some short-term support. However, XAUUSD is
Gold After FOMC: Sideways or Ready for a Breakout?📌 Macro Highlights
• The FOMC kept interest rates unchanged as expected, but its relatively hawkish tone triggered strong selling pressure on gold immediately after the meeting.
• However, news that the U.S. and Iran signed a memorandum of understanding helped improve market sentiment, allowing gold to recover significantly from its lows.
• The market is currently balancing between the pressure of higher interest rates and expectations of easing geopolitical tensions.
📌 Trading Plan
Resista
XAUUSD M45: Gold Recovers From Weekly Low, But 4,360 Remains XAUUSD M45: Gold Recovers From Weekly Low, But 4,360 Remains Key Resistance
Fundamental Analysis
Gold is recovering after the sharp post-FOMC drop into the weekly low area. Optimism around the US-Iran peace agreement is supporting short-term demand as traders take profit on the US dollar.
However, the Fed’s hawkish tone still limits the upside. As long as USD remains supported by rate expectations, gold needs stronger confirmation before the recovery can turn into a clean bullish continuation
XAUUSD — Recovery Into FVG, Then Bearish Reaction Expected
Gold is trading around $4,327 after holding above the short-term support near $4,306. Price is showing a recovery move, but the larger structure is still not fully bullish.
From an SMC perspective, gold is likely moving toward the upper FVG zone around $4,420–$4,430. This area is important because it was previous strong support, and now it can act as a reaction zone if price retests it from below.
My main view is that gold can continue higher first to fill the FVG and test the old support zo
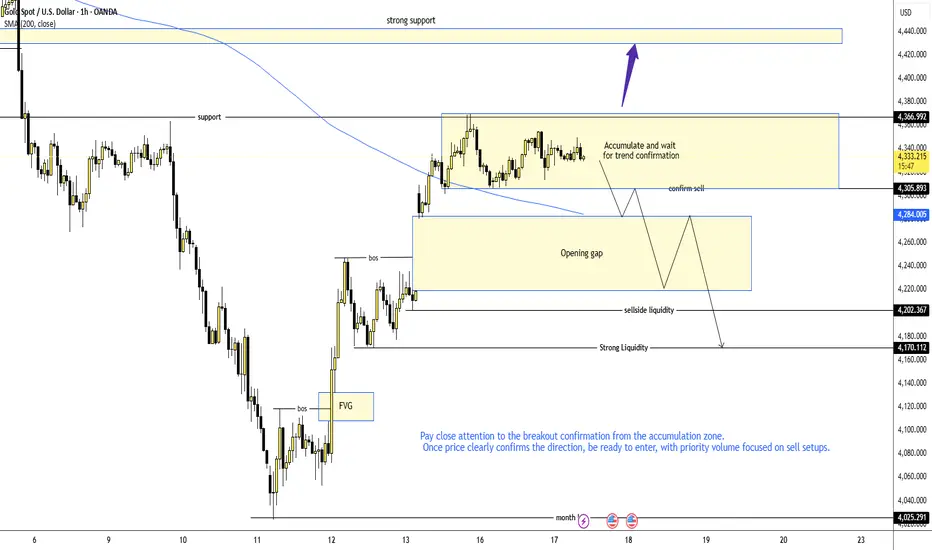
XAUUSD – Gold accumulating, selling confirmation needed.Gold is currently moving inside a clear accumulation range on the H1 chart. Price is holding between the upper resistance around 4,366 and the lower confirmation area near 4,305. The market has not broken direction yet, so the best approach is to wait for confirmation from this range before considering the next setup.
FUNDAMENTAL ANALYSIS
Gold is still reacting to the U.S. dollar, Treasury yields and upcoming U.S. data. For now, the market is showing hesitation, so the technical breakout from
The Textbook AMD Trap — How FOMC Manipulated the Masses!🔄 1. Deconstructing the AMD Cycle (Accumulation, Manipulation, Distribution)
Looking at yesterday’s high-impact FOMC delivery on the 4-Hour chart, we witnessed a flawless, institutional market-maker model play out in real time:
Accumulation: Prior to the high-impact news release, the market flatlined into a tight consolidation range. This sideways price action built up a massive pool of buy-side liquidity (equal highs marked as XXX on the chart) and sell-side liquidity underneath.
Manipula
Suzlon Energy Ltd Chart AnalysisTechnical Outlook
Currently trading within a long-term descending channel, a structure that has been guiding price action for several months after finding support near the lower boundary of the channel, the stock witnessed a sharp recovery and is now approaching the upper trendline resistance around ₹59.
One of the most notable features on the chart is the highlighted "Order Block" around ₹50 this area previously attracted strong buying interest and has acted as an important demand zone dur
Before the Fed Decision: Will Gold Come Back to Fill the Gap?📌 Macro Highlights
• The market is awaiting the Federal Reserve's interest rate decision and Kevin Warsh's remarks.
• The U.S. and Iran have reached a peace agreement, reducing safe-haven demand in the short term.
• Investors are now focusing more on the Fed's policy outlook for the second half of the year rather than geopolitical developments.
📌 Trading Plan
Resistance: 4349–4369 | 4425–4450
Support: 4280–4300 | 4180–4200 | 4165
📌 Personal View
Gold is still maintaining a recovery phase
The Pre-FOMC Retail Trader Trap — Why You Must Stand Aside!🌐 1. The Pre-FOMC Landscape: A Retail Liquidity Trap
The Environment: We are officially hours away from the Federal Reserve's highly anticipated interest rate decision and press conference. Ahead of an institutional risk event of this magnitude, the market enters a structural phase known as a liquidity vacuum.
The Reality Check: The current intraday market behavior is a textbook consolidation designed specifically to induce retail traders into forcing a premature directional bias. Any micro-m
HPL Electric & Power LtdDate 17.06.2026
HPL Electric & Power
Timeframe : Day Chart
Cmp 384
Note:- Breakout Buy Above 390
Market Share
(1) The company is the largest manufacturer of on-load change-over switches with a 50% market share in India.
(2) It also has a market share of 20% in the domestic electric meters market
(3) And a 5% market share in the Low-voltage Switchgear Market.
(4) It is the 5th largest LED manufacturer in India
Geographical Split
(1) Domestic: 97%
(20 Exports: 3%
Order Book
(1) Comp
DIXON - A beast awakeningNSE:DIXON
Weekly chart is first point of attractions
RSI on Weekly showing bullish divergence
Strong Peter Lynch Score expressing excellent Fundamentals for long term Investing
On Daily chart, nice gap up is second point of interest
Price was falling knife but pause with heavy volume expressing institution's interest
As per daily price may face little hurdles but give strong conviction for long term
👉 👉 👉 Step buying will be good for long term investment strategy.
Warning: