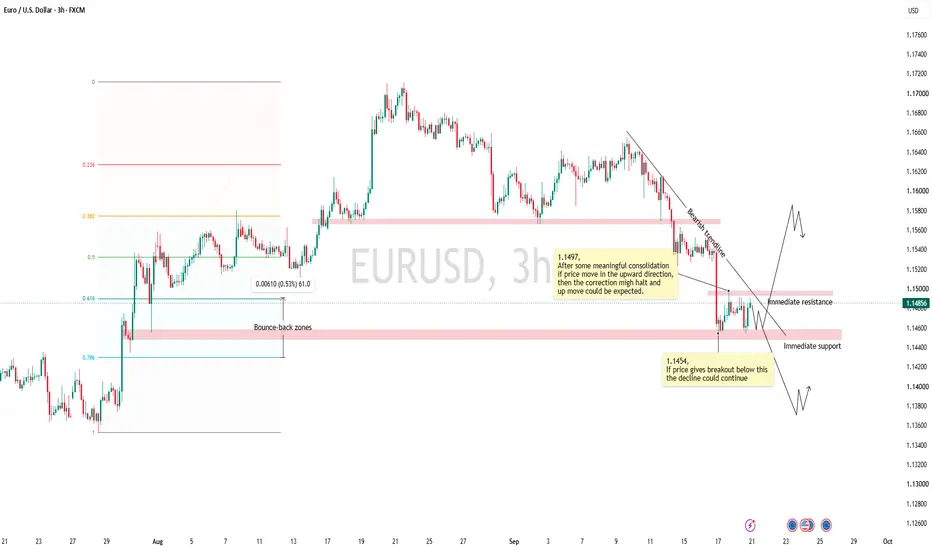
EURUSD Outlook for the upcoming week! Currently price is showing strong bearish moves, taking support of 1.1454 for a brief consolidation at a Fibonacci bounce-back zone, if this consolidation lasted for few more days and price forms a nice formation then we can expect breakout and moves in the upward direction (but long entries would still be risky for that we need some strong structure or breakout above 1.5666).
Otherwise looking at the downfall it seems really bearish, shorting would be the right opportunity if Price breaks belo
Gartley
#BITCPOIN crash is coming 🚨🪙📊 Bitcoin – Flat Correction Update
🔄 After hitting a low of 63K on 28 Feb, Bitcoin started its corrective rise. The A wave unfolded in 3 sub‑waves, signaling a Flat Correction (B wave retraces > 61.8%).
📉 B wave: Formed on 29 Mar with a low of 65K
📈 C wave: Currently unfolding in 5 sub‑waves:
1️⃣ Wave 1: Completed on 10 Apr 📉💹
2️⃣ Wave 2: Bounce completed on 13 Apr 🔼📊
3️⃣ Wave 3: Sharp rally to 79,482 🚀💰
4️⃣ Wave 4: Flat cooling, completed on 29 Apr 🧊📉
5️⃣ Wave 5: Now continuing — any confi
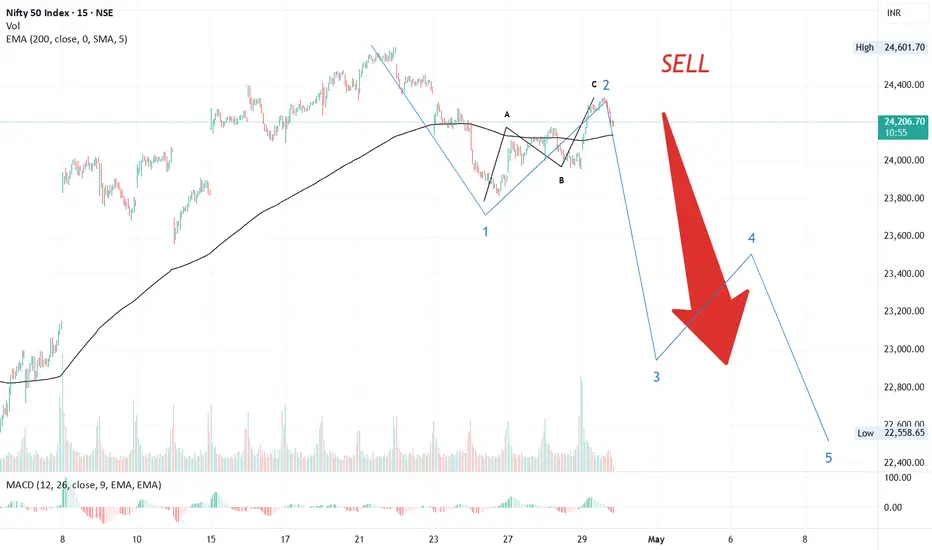
#NIFTY BEAR TREND START⚡️📉🔥 Nifty Elliott Wave Alert 🚨💥
After touching a high of 24,600 (22 Apr), Nifty started its decline:
1️⃣ 📉 Wave 1 (24 Apr): Dropped to 23,800
– Subwave 5 🌀 was the largest, hinting at rebound potential.
2️⃣ 🔄 Wave 2: Zig‑zag correction, retraced back to 24,300 ✅
3️⃣ ⚡️🚨 Wave 3: Now unfolding, with downside targets near 23,000 🎯
---
👉 Structure is clear:
🐻 Bears are gaining control.
📉 Expect continued weakness as Wave 3 progresses.
💡 Trading Insight: Look for confirmation, then go short —
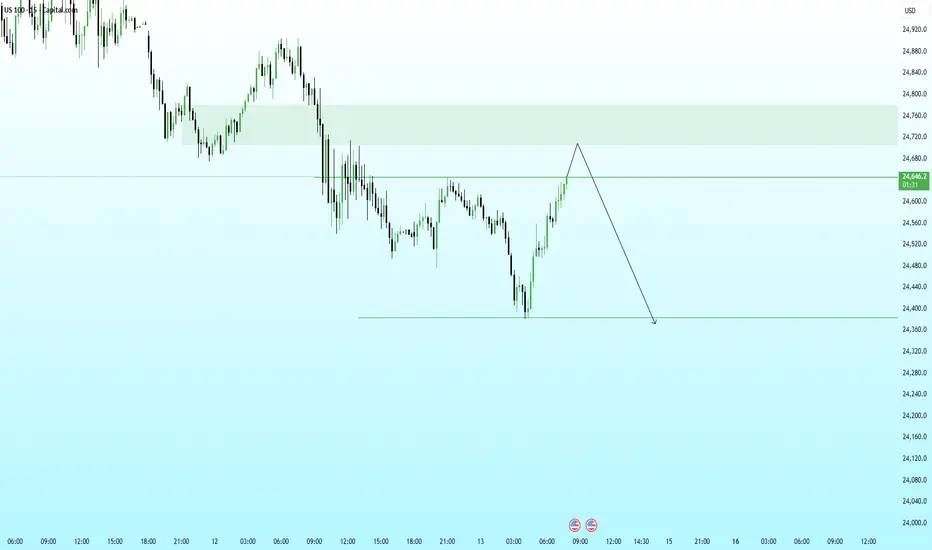
US100 | Retracement Into Supply Before Potential Continuation LoNASDAQ is currently pushing into a key supply zone around 24,700 – 24,760 after a strong recovery from the recent lows. This move appears to be a corrective pullback within the broader bearish structure.
The highlighted supply area previously acted as a distribution region, making it a high-probability reaction zone for sellers.
If price reaches this zone and shows rejection, we could see the formation of a lower high, leading to a continuation toward the downside.
Projected scenario:
• Price
GBP/USD – Short Setup Trade Narrative
Price created a lower-high structure after the earlier push up, followed by a sharp sell-off that broke intraday momentum.
A small liquidity grab beneath the prior low caused a corrective pullback into a premium zone, aligning perfectly with the bearish bias.
The current candle shows rejection inside the supply block / retracement zone, giving a clean short entry.
Confluence
Structural lower-high formation
Liquidity sweep before entry
FVG fill during retracement
Higher-tim
USDCHF – M15 | Sell-Side Purge → Mitigation Rally → ContinuationPrice completed a textbook sell-side liquidity sweep, flushing weak longs below the range. The impulsive push down was real displacement. What followed is a forced bounce, driven by short covering and mitigation, not fresh demand.
Current price is retracing into a discounted supply / imbalance zone, where previous bearish orderflow originated. Structure remains bearish unless proven otherwise.
Market Narrative
Range highs → distribution
Sharp sell-side run = intent revealed
Bounce = mitigat
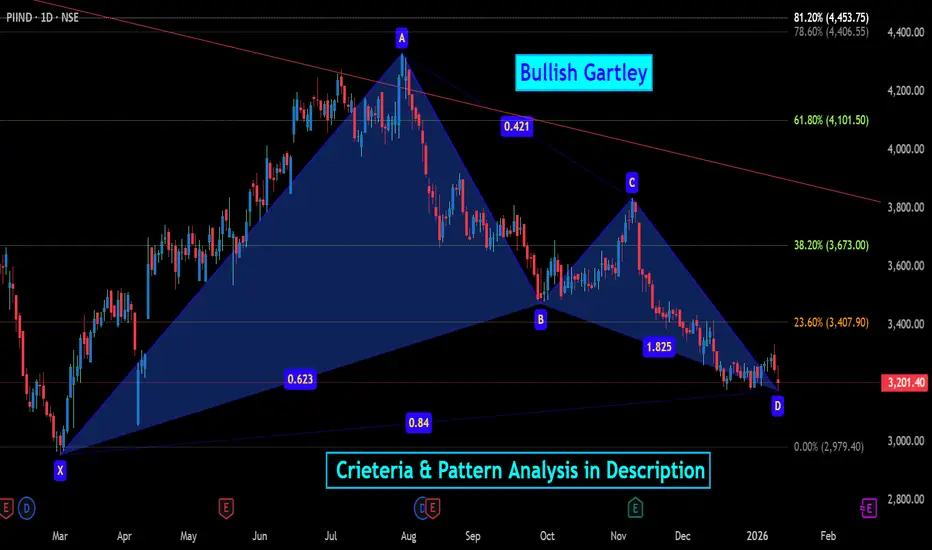
PIIND Investment Idea: Harmonic Bullish Gartley Pattern💯 Bullish Gartley Pattern in Technical Analysis
✍🏼The Bullish Gartley pattern is a harmonic trading formation rooted in Fibonacci ratios, designed to identify potential reversal points in a downtrend, signaling the start of a bullish move. Discovered by H.M. Gartley in 1935, it's part of a family of harmonic patterns (including Bat, Butterfly, and Crab) and visually resembles an 'M' shape on the chart. This pattern is popular in forex, equities, and indices like Nifty 50, where it helps trader
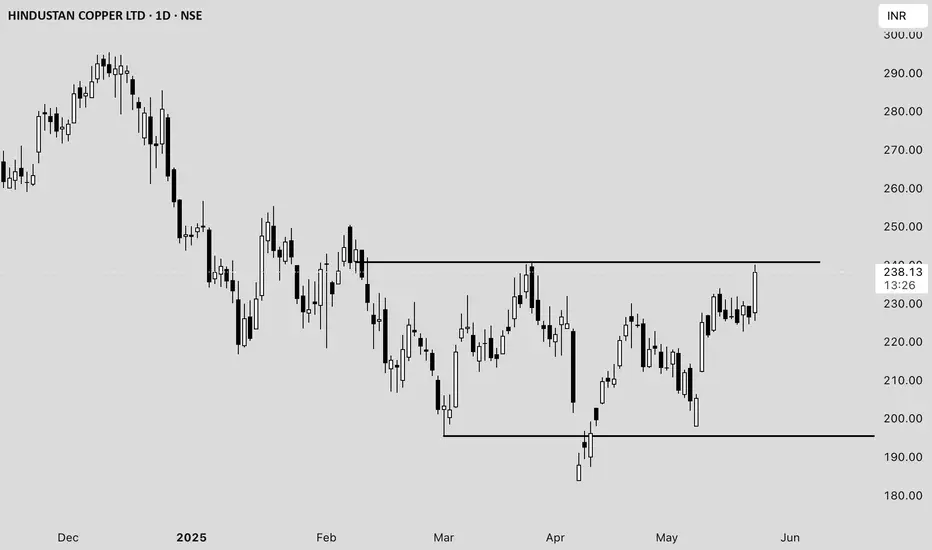
Hindustan Copper Ltd. (HINDCOPPER) Price Analysis **Date:*#### **Current Price and Intraday Movement**
- **Latest Price:** ₹237.98 (+5.09% / +₹11.52)
- **Day’s Range:** ₹225.50 – ₹240.10
- **Open:** ₹227.60
- **Previous Close:** ₹226.46
- **Volume:** 1.63 crore shares (well above average daily volume of 55.89 lakh)
#### **Technical Overview**
- **52-Week Range:** ₹183.82 – ₹381.90
- **50-Day Average:** ₹216.99
- **200-Day Average:** ₹260.58
- **Market Cap:** ₹23,013 crore
- **P/E Ratio:** 57.48
- **EPS:** ₹4.14
#### **Recent Performance an
XAUUSD | 15M | SMC PerspectivePrice has delivered a strong bearish displacement, confirming short-term market structure shift to the downside. The recent impulse left behind a clean bearish order block / supply zone, which is now acting as premium territory.
Current price is reacting from discount and may attempt a pullback into the marked supply zone for mitigation. That zone is the key decision area.
Plan:
Expect a retracement into supply
Look for LTF confirmation only inside the zone
Rejection from supply should open
INDIANB Price ActionAs of July 24, 2025, Indian Bank (INDIANB) is trading around ₹639, showing strong momentum after recovering from recent declines. The stock is close to its 52-week high of approximately ₹658, indicating a robust upward trend in the public sector banking space.
The bank has demonstrated consistent financial growth, with a 14% year-on-year increase in both deposits and advances, currently standing above ₹63,000 crore and ₹53,000 crore respectively. Total business volume grew to over ₹1.16 lakh cr
Dalmia Bharat LtdAs per Harmonic Alt Gartley pattern
Information provided is for informational purposes only and should not be construed as investment advice or an offer to buy or sell securities. Investors are advised to carefully review all materials and consult with a financial advisor considering their own financial situation and risk tolerance before making investment decisions. The disclaimer also often includes statements about no guarantees or warranties regarding the accuracy, adequacy, or completen
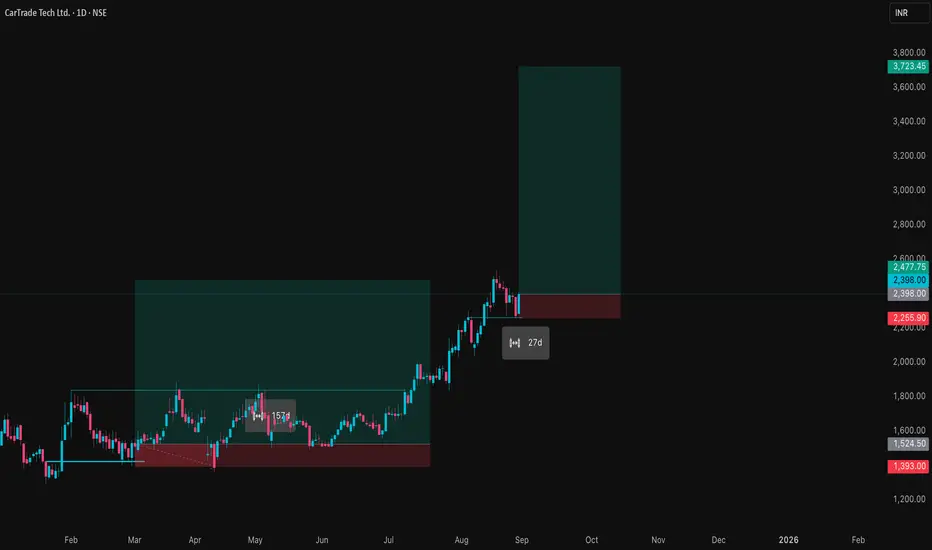
CARTRADE Price ActionTIme to pyramid
CarTrade Tech Limited’s stock has delivered a strong performance as of late August 2025, trading close to ₹824 after rallying more than 40% in the past three months and reaching a new 52-week high. The surge is largely attributed to robust quarterly results, improved profit margins, and expanding digital business operations, which have helped regain investor confidence.
CarTrade’s financials show healthy revenue growth, continuing profitability improvements, and solid cash res
TFCILTD Price Action## TFCILTD – Price Analysis (August 2025)
### Price & Market Metrics
- **Current share price:** ₹297.75 (as of August 13, 2025; latest close).
- **Market capitalization:** Approx. ₹2,757crore.
- **52-week range:** ₹122.32 (low) – ₹303.50 (high); new high reached in early August.
- **All-time low:** ₹4.45 (Sep 2001).
- **All-time high:** ₹303.50 (July–August 2025).
- **Day’s range (Aug 13):** ₹282.60–₹303.50.
- **Volume:** 3,955,421 shares traded on Aug 13.
- **Beta:** 1.24, showing moderate vol
Bank Nifty Bank Nifty just formed as Alt Gartley pattern as shown
Disclaimer
Information provided is for informational purposes only and should not be construed as investment advice or an offer to buy or sell securities. Investors are advised to carefully review all materials and consult with a financial advisor considering their own financial situation and risk tolerance before making investment decisions. The disclaimer also often includes statements about no guarantees or warranties regarding the ac
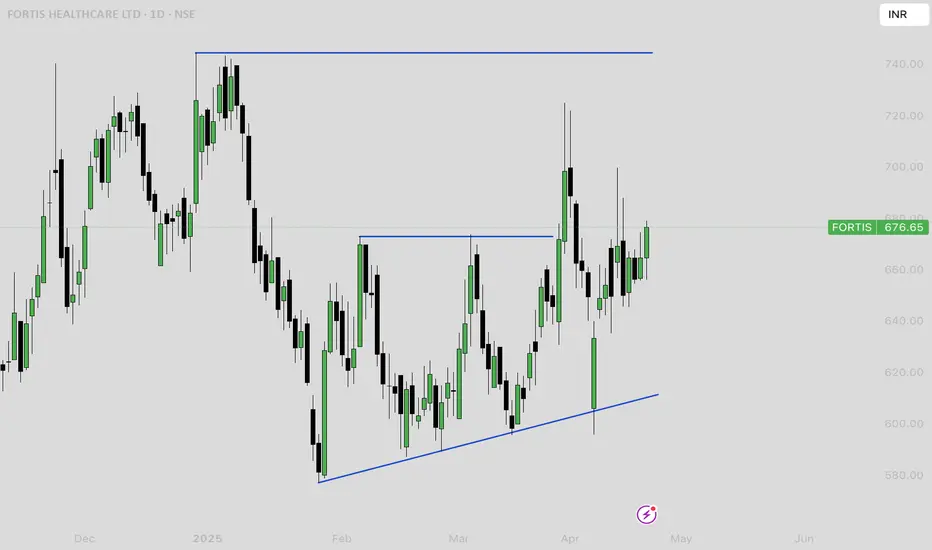
Fortis Healthcare’s share price analysisFortis Healthcare’s share price is currently around ₹667, reflecting strong momentum and significant outperformance over the past year, with a return of about 49%. The stock recently touched a 52-week high of ₹744.5 and a low of ₹406, indicating a broad trading range and robust investor interest
Analyst sentiment remains bullish, with most forecasts targeting a price range of ₹736 to ₹850 over the next 12 months, suggesting a potential upside of around 10–20% from current levels . Some projecti
APOLLOTYRE Price ActionApollo Tyres is currently trading in the range of 479 to 492. The last recorded price was about 487, following a recent day’s high of 491.5 and a low of 479.65. The volume on the last trading day exceeded 5.8 lakh shares, with an average delivery percentage around 50%. The stock is experiencing mild upward price momentum on short-term technicals, with several recent bullish EMA crossovers on daily charts.
Financially, the market capitalisation is about ₹30,800 crore. The trailing P/E ratio stan
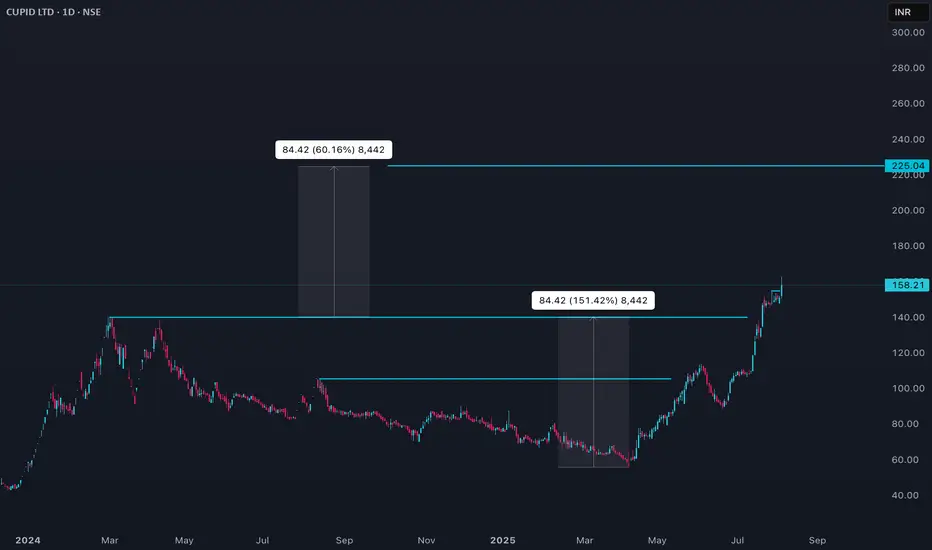
Cupid Price ActionCupid Limited’s stock is trading around ₹158 as of early August 2025, having recently hit new record highs above ₹162. The share price surged over 45% in the past month and is up more than 100% year-to-date, significantly outperforming both its FMCG peers and the broader market. Volatility is high: daily moves of 5–6% are common, and intraday swings have reached as much as 8%. The stock is trading well above all major moving averages, reflecting strong buying momentum.
Long-term performance is
ANANTRAJ Price Action
## Current Price & Performance
- Last close was ₹607.20.
- Over the past week, the stock is up more than 10%, showing strong short-term momentum.
- Over the past year, it has gained nearly 25%, but suffered a sharp 32% drawdown over six months.
- The 52-week price ranged from ₹376.15 to ₹947.90, reflecting high volatility.
## Valuation and Metrics
- ANANTRAJ trades at a high valuation, with price-to-earnings and price-to-book ratios above typical industry averages.
- Its market capitalizatio
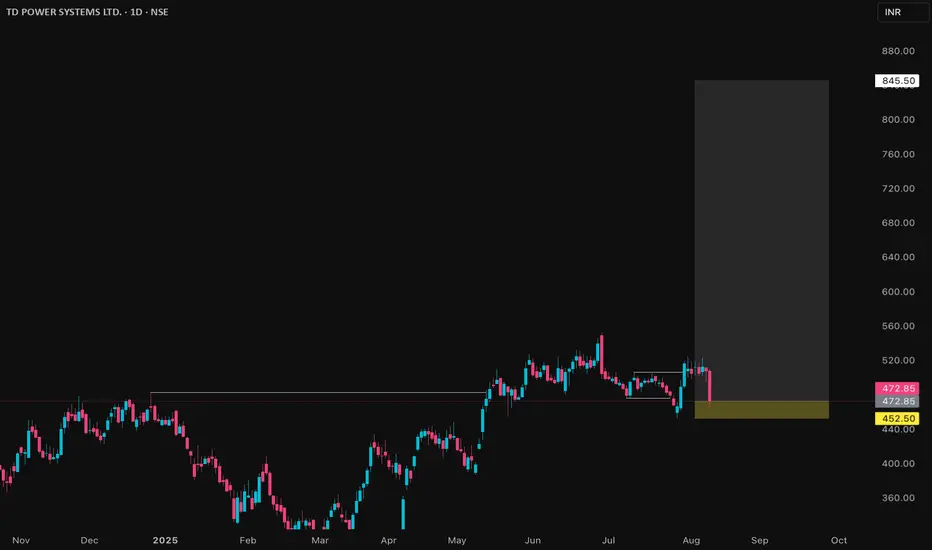
TDPOWERSYS Price Action## TDPOWERSYS Price Details (as of August 8, 2025)
### Market Metrics
- Current share price is ₹472.85.
- Market capitalization is ₹7,385crore.
- The 52-week price range is ₹293 to ₹552.75.
- Its all-time low was ₹14 in March 2020; all-time high is ₹552.75 in June 2025.
### Returns & Volatility
- 1-month return: -1.48%.
- 1-year return: about 18%-20%.
- 3-year return: over 300%.
- 5-year return: over 1,900%.
- Weekly volatility is 6%, which is above average.
- Beta is 2.04, indicating higher r
NIFTYHello & welcome to this analysis
On the eve of FOMC meet, the index has today covered the gap down made on July 11th and entered the potential reversal zone (PRZ) 25350 - 25425 of two bearish harmonic patterns - Butterfly (15m) & Gartley (daily).
Reversal confirmation as of now is once it starts giving a 60m close below 25225.
Pattern gets negated above 25525.
All the best
Regards
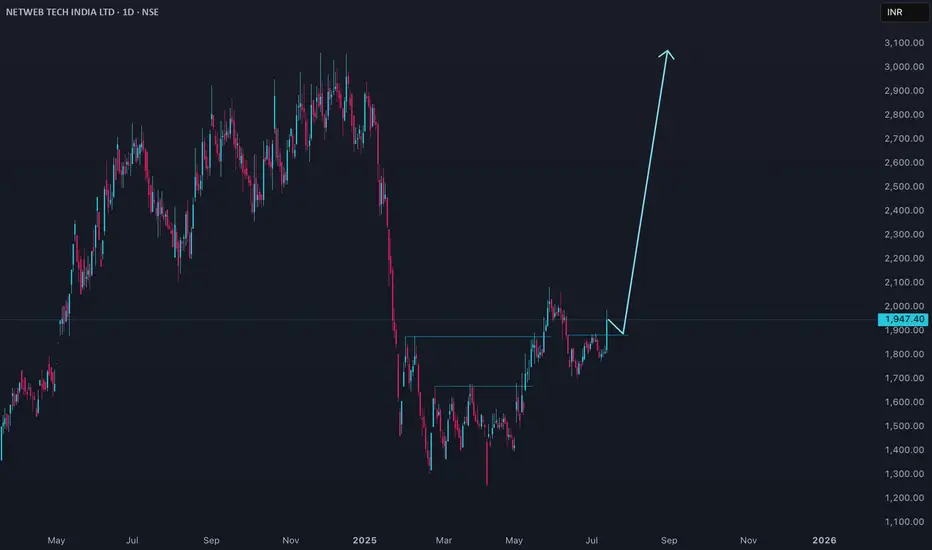
NETWEB Price actionNetweb Technologies (NETWEB) is trading at ₹1,947.40 as of July 11, 2025. The stock has shown a strong short-term recovery, up about 7.4% in the last session and nearly 6.8% over the past week, but it remains down by over 25% in the past six months. The 52-week high is ₹3,060 and the low is ₹1,251.55.
Valuation-wise, NETWEB is trading at a high price-to-earnings ratio (around 90–96) and a price-to-book ratio near 20, indicating a premium valuation. The company’s market capitalization is approxi
GRSE Price ActionGarden Reach Shipbuilders & Engineers Ltd (GRSE) is trading at ₹2,581.90 as of September 13, 2025, marking robust momentum after a sharp rally in recent months. The stock opened at ₹2,370 and reached a session high of ₹2,586.40, comfortably near its 52-week peak of ₹3,538. Market capitalization stands at approximately ₹29,576 crore, indicating significant institutional and retail interest following active trading volumes.
The company’s annual revenue exceeds ₹3,300 crore, propelled by sustained