CMP: 13,678 | Structure: Multi-channel bullish alignment, mid-chWhat The Chart Is Telling Us
Maruti is trading inside a stacked ascending channel structure — both the broader long-term channel (from the lows) and a tighter recent channel are pointing in the same direction: up.
After the sharp correction from the 17,370 high down to ~12,000, price found strong demand and has been building a new ascending channel with clearly defined higher lows and higher highs. The recent pullback from ~14,200 to current 13,678 is a healthy retest of the mid-channel — exactly the kind of shallow correction that precedes the next leg up.
This is a trend continuation setup, not a reversal trade. The bigger picture is intact.
The Trade Setup — Why 13,400 Is The Pivot
👉 13,400 is the make-or-break level.
It's the confluence of:
Ascending channel mid-line support
Recent swing low structure
Prior consolidation base
⚠️ Not investment advice. Levels are technical observations. Manage your own risk.  Long
Long
 Short
Short
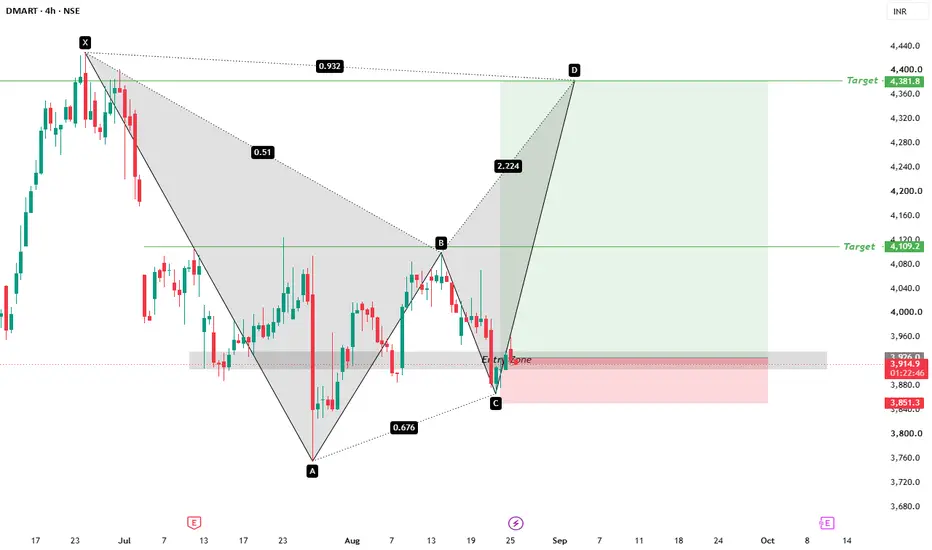
DMART 📊 DMART – Technical Analysis 📈
Current Price: ₹3,915
On the DMART 4H chart, a Bullish Harmonic Pattern is currently forming. Price is now trading near the Entry Zone, so the price reaction around this zone will be important.
🟢 BULLISH SCENARIO
Entry Zone → ₹3,900 – ₹3,930
If price takes support from this zone and gives a bullish move:
🎯 Target 1 → ₹4,110
🎯 Target 2 → ₹4,380
🛡️ Stop Loss → ₹3,850
Risk Management:
If price sustains below ₹3,850, this bullish setup will be considered invalid.
### 🎯 KEY LEVELS
🟢 Entry Zone: ₹3,900 – ₹3,940
🎯 Target 1: ₹4,110
🎯 Target 2: ₹4,380
🔴 SL: ₹3,850
👉 At the current level, trade execution should be considered only after price confirmation within the Entry Zone.
━━━━━━━━━━━━━━━
⚠️ DISCLAIMER
This post is for Educational & Informational Purposes Only. It is not a Buy/Sell Recommendation, Investment Advice, or a Guaranteed Target.
Stock Market and Trading involve Risk. Before taking any trade, make your own decision based on your Analysis, Risk Management & Capital Management.
Technical Analysis does not guarantee future results.
 Long
Long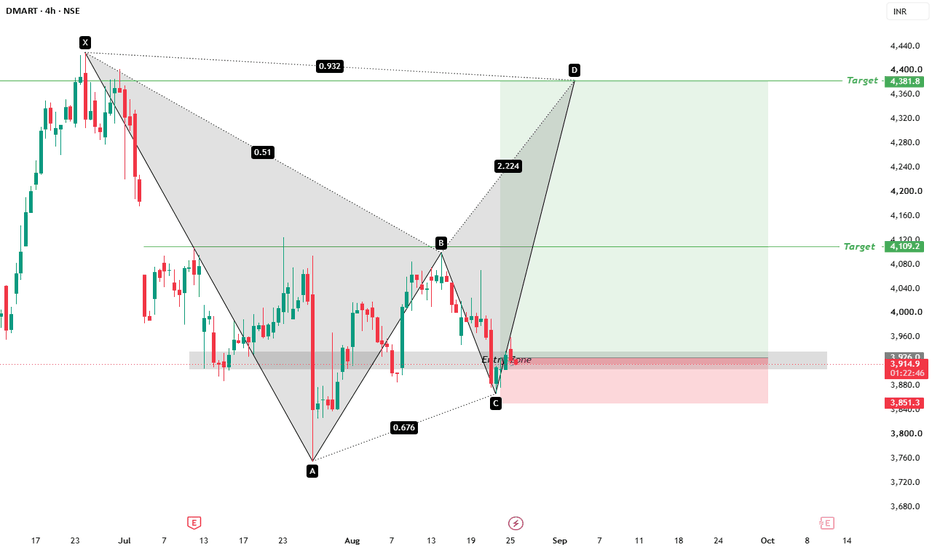
Why I Still Use Fibonacci in Market AnalysisFibonacci is one of the most debated tools in trading.
Some traders see 0.382, 0.5, and 0.618 as almost “magical” price zones. Others believe they are just numbers traders give meaning to.
In my view, both interpretations miss the point.
Fibonacci is useful not because it predicts the future, but because it helps measure the depth of a pullback and identify areas where price reaction may become important.
1. Fibonacci Is Not a Buy/Sell Button
Imagine the market is trending strongly higher and then starts to pull back.
Instead of guessing:
“Has price pulled back enough?”
Fibonacci helps divide the previous move into reference zones such as 38.2%, 50%, and 61.8%.
If price returns to 0.618, that does not mean you should automatically buy.
It simply tells me:
“This is an area worth watching. Now let’s see whether buyers actually return.”
2. Why Do Traders Watch 0.382 and 0.618?
In a strong trend, a shallow pullback near 0.382 can suggest that the side controlling the market is still aggressive.
Deeper retracements toward 0.5–0.618 may give price more room to “reset” before the trend continues.
One interesting detail: 0.5 is not actually a Fibonacci ratio , but traders still use it widely because the 50% retracement has long been important in technical analysis.
3. Fibonacci Works Best With Confluence
I rarely care about a Fibonacci level on its own.
It becomes more meaningful when it aligns with:
Support/Resistance + Market Structure + Previous Breakout Zone + Liquidity + Price Action .
For example:
Price pulls back to 0.618, reaches an old support zone, and shows a strong bullish reaction.
At that point, I am not buying because of “0.618”.
I am buying because multiple factors are telling the same story .
4. If the Anchor Points Are Wrong, Everything After That Is Wrong
This is a very common mistake.
Traders sometimes draw Fibonacci from almost any high and low until they find a level that looks “perfect”.
But Fibonacci is only useful when you identify the correct meaningful swing high and swing low for the move you are analysing.
Do not use the tool to prove what you want to see.
Use it to measure the move the market has actually created.
5. Do Not Turn 0.618 Into a Magic Number
Price may react at 0.618.
It may also break straight through it.
No ratio is strong enough to replace Stop Loss, invalidation, or risk management.
Fibonacci gives me an area to watch. Price Action decides whether there is a trade.
The Most Important Point
Leonardo Fibonacci did not invent Fibonacci Retracement for financial trading. He became famous for the number sequence popularised in Liber Abaci in the 13th century; applying related ratios to financial charts came much later.
That is why I do not see Fibonacci as a mystical forecasting tool.
I see it as a pullback measuring tool.
And when that measurement is placed correctly within trend, structure, and price reaction , it can still be extremely useful.
Do not ask: “Did price reach 0.618?”
Ask:
“If price reaches 0.618, how does the market react?”
That is the part that should drive the trading decision.
This article is for educational purposes only and does not constitute financial advice. Education 
Short 
XAUUSD/GOLD 4H SELL LIMIT PROJECTION 25.08.26This XAUUSD / Gold 4H chart is showing a Sell Limit / bearish pullback setup for 25 Aug 2026.
📉 SELL SETUP EXPLANATION
Seller Entry Zone: approximately 4,648 – 4,652
Stop Loss: around 4,666.45
Take Profit 1: around 4,622
Take Profit 2: around 4,599.34
Current Price shown: around 4,633.79
Why Sell?
1. Strong Resistance Zone – 4,652 to 4,666
Gold previously showed rejection from this upper area. The chart treats this zone as a supply/resistance area, where sellers may become active again.
2. Bearish Rejection Candle
Price pushed higher but failed to sustain above resistance and produced a strong bearish move. This indicates selling pressure from higher prices.
3. 4,652 Level is Important
The planned entry is near 4,652.17. If price retests this level and fails to break above it, it can provide another confirmation for sellers.
4. TP1 – 4,622 Support
The first downside target is the nearby support zone around 4,620–4,623. Partial profit can be considered here because buyers may react from this level.
5. TP2 – 4,599 Support
If 4,620 support breaks strongly, the next major downside target is around 4,599.34.
🎯 Expected Movement
4,648–4,652 retest → rejection → 4,622 → 4,599
The bearish setup becomes invalid if Gold breaks and sustains above 4,666–4,670. Short 
 Long
Long
 Long
Long
Long 
Long 
Short 
NIFTY- Intraday Levels :- 25 August 2026Monthly expire days, Market may stay volatile
NIFTY sustain above 24234/62 then bove this bullish then 24310/338 above this more bullish above this wait I don't have any reliable levels above this
If NIFTY sustain below 24160/32/24 below this bearish then around then 24061/39 below this more bearish then 23996/971 then 23914/903 below this wait
My view :-
"My viewpoint, offered purely for analytical consideration, The trading thesis is: Nifty (bearish tactical approach: sell on rise)
However expect both side movements, just because closing pice is in bullish zone, if it opens negative then it may be different scenario.
This analysis is highly speculative and is not guaranteed to be accurate; therefore, the implementation of stringent risk controls is non-negotiable for mitigating trade risk."
Consider some buffer points in above levels.
Please do your due diligence before trading or investment.
**Disclaimer -
I am not a SEBI registered analyst or advisor. I does not represent or endorse the accuracy or reliability of any information, conversation, or content. Stock trading is inherently risky and the users agree to assume complete and full responsibility for the outcomes of all trading decisions that they make, including but not limited to loss of capital. None of these communications should be construed as an offer to buy or sell securities, nor advice to do so. The users understands and acknowledges that there is a very high risk involved in trading securities. By using this information, the user agrees that use of this information is entirely at their own risk.
Thank you.  Short
Short
NAHARINDUSImmediate resistance: ₹145.88 (current ask / immediate ceiling) → next major resistance ₹150.77–₹170.50 (psychological zone & prior swing highs) → ₹180–₹200 (major structural level from the chart)
Support/base: ₹145.05 (current bid / immediate support) → ₹140.73 (secondary demand zone) → ₹132.10 (recent low / key support) → ₹117.96 (major structural floor from prior consolidation) → ₹83.05 (52-week low / primary structural floor)
Invalidation: A daily close below ₹132.10 would weaken the current bullish structure and suggest a deeper retracement toward the ₹117.96–₹83.05 zone
Market Context (Latest Session):
Open: ₹133.29
High: ₹134.62
Low: ₹132.10
Close: ₹132.44
Change: +₹0.71 (+0.54%)
The stock is currently consolidating near the ₹145 level after a strong recovery from the ₹83 low. The presence of both "SELL" (at ₹145.05) and "BUY" (at ₹145.88) indicators suggests a tight range and mixed sentiment at current levels.
Fundamentals context:
Nahar Industrial Enterprises Limited is a diversified textile manufacturer with operations spanning yarn spinning, fabric processing, and garment manufacturing. The company is part of the Nahar Group and caters to both domestic and export markets. Key drivers to monitor include:
Cotton yarn prices (raw material cost impact on margins)
Export demand (global textile market trends)
Domestic apparel demand (retail and wholesale consumption)
Government textile policies (PLI schemes, export incentives)
Currency movements (rupee weakness benefits exporters)
Capacity utilization and expansion plans
Power and fuel costs (energy-intensive manufacturing process)
The stock has witnessed a massive recovery from its 52-week low of ₹83.05 to the current ₹145 level, reflecting improved industry dynamics and potential operational turnaround. As a small-cap textile player (~₹300–400 Cr market cap), the company is sensitive to raw material prices and global demand cycles. Investors should check the latest quarterly results for revenue growth, margin expansion, and any debt reduction progress.
View:
This is a strong recovery/breakout continuation setup — the stock has witnessed a remarkable rally from the ₹83 low (nearly doubling from the bottom) with a "BUY" sentiment indicated on the chart. The chart shows a steady uptrend with a solid base forming near the ₹132–₹140 zone. A sustained move above ₹145.88 with volume could open the door for a rally toward ₹150–₹170 in the medium term. It's a small-cap player in the textile sector, benefiting from improving export demand and favourable currency movements. Traders should watch for volume confirmation and broader sector sentiment (textile stocks often move in tandem with export demand and cotton prices).
Key Levels to Watch:
Level Type Significance
₹180–₹200 Major Resistance Psychological barrier / ultimate target zone
₹150.77–₹170.50 Resistance Prior swing highs / intermediate target
₹145.88 Immediate Resistance Current ask / breakout trigger
₹145.05 Current Price Immediate reference level
₹140.73 Secondary Support First demand zone if pullback occurs
₹132.10 Key Support Recent low / invalidation level
₹117.96 Major Support Secondary structural floor
₹83.05 Primary Support 52-week low / ultimate structural floor
⚠️ Disclaimer: For educational/analysis purposes only. Not investment advice. Verify live price, volume, and fundamentals on your terminal before acting. Always use a stop-loss below the invalidation level. Past performance does not guarantee future results.
 Long
Long
Long 
Long 
Education 
 Long
Long
The Trade After a Loss Is Often the Most Dangerous OneMost traders think the loss is the problem.
Usually, it isn’t.
The real damage often starts with the next trade.
You get stopped out. Suddenly the market feels personal. You want the money back, so you enter faster, increase size, ignore confirmation, or take a setup you would normally reject.
That is how one normal loss becomes three unnecessary ones.
A Loss Does Not Mean Your Strategy Is Broken
Even a profitable system will lose trades. That is part of working with probability.
The mistake is changing your entire approach because of one result.
One Stop Loss does not tell you whether your strategy works. A meaningful sample of trades does.
Judge the system with data, not with the emotion of the last candle.
Watch What Changes After You Lose
After a losing trade, ask yourself:
Am I trying to recover the money quickly?
Am I increasing my position size?
Am I entering earlier than usual?
Am I suddenly afraid to take the next valid setup?
Am I changing rules that worked perfectly well yesterday?
If the answer is yes, your strategy may not be the problem.
Your state of mind is.
The Next Trade Owes You Nothing
This is one of the most useful ideas a trader can understand.
The market does not know you just lost.
The next setup has no responsibility to bring your account back to breakeven.
If your normal risk is 1%, keep it at 1%. Do not turn the next position into a recovery mission.
A good trade should be taken because it meets your criteria — not because you need money back.
Measure More Than P&L
At the end of the session, do not only ask:
“Did I make money?”
Also ask:
“Did I trade according to my plan?”
A losing day with disciplined execution can still be a good trading day.
A profitable day filled with revenge trades and broken rules can be far more dangerous, because bad behaviour was rewarded.
The Real Skill
Good traders are not people who avoid losses.
They are people who can take a loss and remain the same trader afterwards.
Same risk.
Same patience.
Same rules.
Same standards.
One loss is part of trading. Letting that loss control the next five trades is a choice.
For educational purposes only. Not financial advice. Education 
Bank of Baroda (BANKBARODA) Chart AnalysisTechnical Outlook
Bank of Baroda is currently consolidating near the *240-251 zone* after a significant correction from the 320+ area. The recent price action shows repeated attempts to hold the lower support region while buyers continue to defend the 240-241 area at the same time, the stock has struggled to sustain moves above 251-252, creating a well-defined short-term range.
The chart also highlights an Expanding Ascending Triangle structure. In simple terms, price is making progressively wider swings while buyers continue to defend the lower levels. This type of formation can lead to a strong directional move once price finally breaks out of the structure.
The immediate resistance is around 251-252. A sustained breakout above this level would be the first important confirmation that buyers are gaining control. The next major hurdle is around 264, which is marked by the horizontal resistance on the chart. A move above 264 would strengthen the bullish structure and bring the higher resistance zones into focus.
On the downside, 240-241 is the key support zone. A sustained breakdown below this area would weaken the current setup and could indicate that the consolidation is resolving on the downside.
Price Projection
The chart shows several important upside levels that could become relevant if the ₹251-252 resistance is decisively breached.
Target 1: ₹264
This is the first major resistance and an important confirmation level. Clearing ₹264 would indicate that the stock is moving beyond the current consolidation range.
Target 2: ₹295-296
This zone represents a significant resistance cluster visible on the chart. It is also close to the upper portion of the marked price structure.
Target 3: ₹299-300
A sustained move above ₹296 could bring the psychological ₹300 level into focus.
This is the higher resistance zone marked on the chart and sits close to the previous major supply area.
The chart therefore presents a potential progression of:
250→ 262 → 299 → ₹323
These are technical levels, not guaranteed price targets. The validity of the higher targets depends on a confirmed breakout and sustained buying interest.
Fundamental Outlook
Bank of Baroda's recent financial performance provides a constructive backdrop to the technical setup. For FY2026, the bank reported a record quarterly net profit of ₹5,616 crore and annual net profit of ₹20,021 crore. Global advances grew 16.2% year-on-year, while domestic advances grew 14.5%. Asset quality also remained healthy, with GNPA at 1.89% and NNPA at 0.45% at the end of March 2026.
The bank's profitability metrics were also encouraging, with FY2026 ROE at 15.39% and ROA at 1.06%. The bank has subsequently reported its financial results for the quarter ended June 2026, so upcoming market reaction and management commentary will be important in assessing whether the fundamental momentum is continuing.
Going forward, investors should watch credit growth, net interest margin, asset quality, deposit growth, slippage ratio, credit cost and profitability. For a banking stock, these metrics are particularly important because strong loan growth needs to be accompanied by disciplined asset quality.
Perspective
For now, the chart is best viewed as a potential breakout setup rather than a confirmed breakout. Confirmation above resistance remains the key factor.