GBPUSD: Weekly Range Sweep Into NWOG RepricingThe market is sitting inside compression… but the liquidity map is becoming obvious.
GBPUSD is currently forming a weekly inside candle, trading near the upper boundary of the previous week’s range and directly inside NWOG territory. That combination usually signals one thing:
A liquidity event is loading.
What stands out here:
Previous week’s highs remain vulnerable
Price trading in premium conditions
Daily equal lows resting below as major draw on liquidity
Weekly gap sitting beneath current price action
My expectation:
A sweep of the previous week’s highs first to complete the buy-side raid… followed by a deeper repricing move lower into the equal lows and weekly gap.
That blue path isn’t random volatility.
It’s how liquidity often gets delivered during inside-week conditions.
Key idea:
Inside candles create trapped positioning on both sides.
The market usually takes one side’s liquidity before expanding into the other.
Most traders will become aggressively bullish after the high gets swept.
That’s exactly where reversals become dangerous.
Let the raid complete.
Then watch the delivery shift.
Harmonic Patterns
Bear Blitz on Nifty: 23,800 Lifeline?Last week (April 27 to May 3, 2026), the Nifty 50 spot index experienced notable volatility amid global market cues and domestic earnings. It opened the week around 23,945 on April 27, climbing to a high near 24,130 before closing lower.
On April 28-29, prices hovered between 24,049-24,334, reflecting cautious trading with intraday swings. By April 30, Nifty closed at 23,997.55, down 180.10 points or 0.74% from the prior close of 24,177.65, with a day range of 23,796-24,087.
The week saw a net decline of about 0.85% overall, influenced by profit booking in key sectors. 52-week range remained 22,182-26,373, signaling broader consolidation.
High volumes exceeded 270M shares on several days, indicating strong participation. Technicals showed bearish momentum, with support near 23,800.
Looking forward to an exiting next week due to election results of four states on monday and geopolitical news...
Feeling it will very volatile week for NIFTY.
lots of great trades
Have marked some important levels
Happy Trading
like and share
Watch out this space
institutional Trading MasterclassInstitutional trading means trading like hedge funds, banks, prop firms, and professional desks. They do not trade based on emotions, random tips, or gambling. They use systems, probabilities, risk control, position sizing, discipline, and psychology.
Retail traders often lose because they focus only on “entry.” Institutions focus on:
Risk Management
Capital Protection
Position Sizing
Probability
Psychology
Consistency
Repeatable Edge
In options trading, if you think like institutions, your results can improve significantly.
AUD/USD Breaks Trendline and Potential for CorrectionAUD/USD faced selling pressure in today's trading session, after failing to maintain its position above the 0.7250 level.
The strengthening of the US Dollar (USD), fueled by concerns about military escalation in the Middle East and anticipation of US inflation data, has forced the pair to fall near the psychological level of 0.7200.
------------------------------------------------------------------------------------------
✅ Fundamental Dynamics: RBA vs. Fed Tug-of-War
AUD/USD is currently caught between two equally aggressive central bank policies:
- ⚡Safe-Haven Sentiment in the USD: President Trump's impatience with Iran and threats of "major combat operations" have fueled capital flows into the USD. Furthermore, the market is now pricing in a 25% chance of a Fed rate hike by the end of the year if tonight's CPI data is positive.
- ⚡RBA Resilience: Meanwhile, the Reserve Bank of Australia (RBA) has maintained its hawkish stance, providing a cushion for the AUD. This divergence has prevented the AUD/USD from falling further than other commodity currencies.
- ⚡US CPI Focus: Tonight's inflation data at 7:30 PM WIB is a key catalyst. If US inflation spikes due to energy prices, the USD will strengthen further and push the AUD beyond its current support level.
------------------------------------------------------------------------------------------
✅ Key Levels to Watch
- ⚡Intraday Resistance (0.7250): This level must be broken again to fully restore the bullish bias.
- ⚡Key Support (0.7184): This is the last line of defense for intraday buyers.
- ⚡Lower Zone (0.7110): Target for a deeper correction if the US CPI data triggers an explosive USD rally.
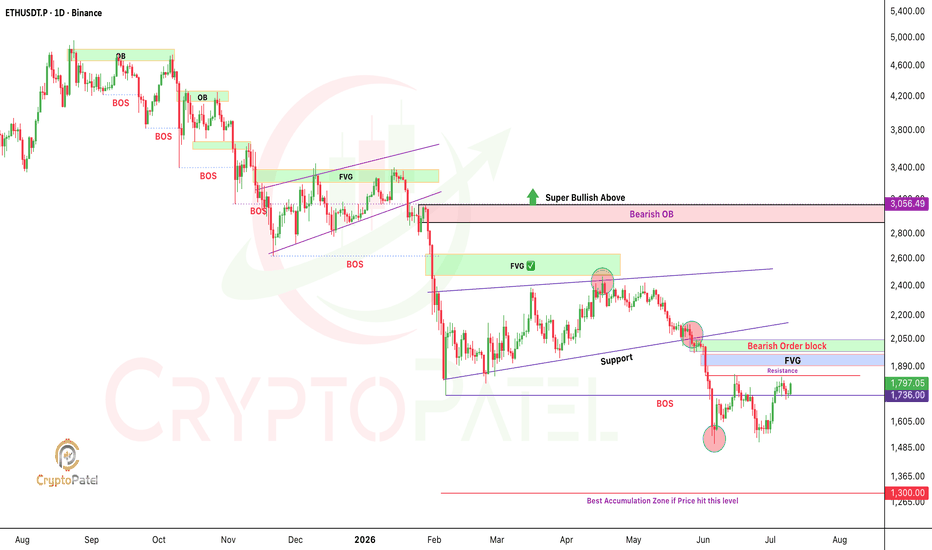
#BITCPOIN crash is coming 🚨🪙📊 Bitcoin – Flat Correction Update
🔄 After hitting a low of 63K on 28 Feb, Bitcoin started its corrective rise. The A wave unfolded in 3 sub‑waves, signaling a Flat Correction (B wave retraces > 61.8%).
📉 B wave: Formed on 29 Mar with a low of 65K
📈 C wave: Currently unfolding in 5 sub‑waves:
1️⃣ Wave 1: Completed on 10 Apr 📉💹
2️⃣ Wave 2: Bounce completed on 13 Apr 🔼📊
3️⃣ Wave 3: Sharp rally to 79,482 🚀💰
4️⃣ Wave 4: Flat cooling, completed on 29 Apr 🧊📉
5️⃣ Wave 5: Now continuing — any confirmation in price is a short signal 🐻⚡📉, with potential downside towards 60K 💥💹
XAGUSD Momentum Builds as Bulls Target Higher LevelsSilver continues pushing higher after completing a strong breakout above the 80 USD area. The current move is supported by high volume.
Still, the market looks overheated in the short term. Instead of chasing price near the highs, traders may watch for a retracement into the 82.00–80.50 USD support zone.
Holding this area could trigger another bullish wave toward 88 USD and possibly 90 USD in the medium term. Falling USD strength, softer Fed expectations, and strong industrial silver demand continue supporting the long-term outlook.
High Class Option Trading #2Core Components of Options
Strike Price
Premium
Expiry
Intrinsic Value
Time Value
Option Buyers vs Sellers
Buyers → Limited risk, low probability
Sellers → High probability, unlimited risk
👉 Institutions mostly act as option sellers
What is Institutional Trading?
Institutional trading is when big players like:
Banks
Hedge Funds
FIIs/DIIs
trade using large capital and smart strategies
Institutional Trading Masterclass Part - 2Core Structure of Institutional Option Trading
Institutions focus on 4 pillars:
A. Direction
Will market go up, down, sideways?
B. Volatility
Will movement increase or decrease?
C. Time Decay
How much premium melts daily?
D. Risk Exposure
How much capital at risk?
Rules to Become Consistent
Never trade without plan
Never increase size emotionally
Never revenge trade
Protect capital first
Focus on process daily
Take breaks after losses
Journal every trade
Stay physically healthy
Sleep properly
Keep learning
XAUUSD/GOLD 1H BUY PROJECTION 11.05.26🟢 Gold market is currently showing strong bullish momentum on the 1-hour timeframe after rejecting from the lower support zone.
💰 Price collected downside liquidity and respected the Fair Value Gap (FVG) area, which triggered a strong bullish reaction in the market.
🕯️ A Three White Soldiers pattern has also formed, indicating that buyers are gaining control and momentum is shifting toward the upside.
🔄 Currently, price is retesting the breakout zone around 4722 – 4725. If this area holds successfully, gold may continue moving higher toward the major resistance zone near 4748 – 4750.
🚀 Overall market structure remains bullish unless price breaks below the support/FVG region.
📌 BUY ENTRY: 4722 – 4725
🛑 STOPLOSS: 4708
🎯 TARGET 1: 4740
🎯 TARGET 2: 4748
🎯 TARGET 3: 4755
Knowledge Marine (KMEW): Structural Breakout & Bullish ConsolidaKnowledge Marine & Engineering Works Limited (KMEW) has delivered a high-conviction structural breakout on the daily timeframe. After a period of sideways consolidation, the stock has surged to fresh All-Time Highs, indicating a strong shift into a high-momentum phase.
Key Technical Observations:
Major Horizontal Breakout: The stock has decisively cleared the critical resistance zone near ₹1,890.45. This level had acted as a multi-month ceiling; successfully flipping it into support is a significant bullish milestone.
High-Tight Flag Formation: Following the explosive move toward ₹2,252, the price is currently forming a tight consolidation range (Flag). This suggests a "pause that refreshes" as supply is absorbed before the next leg up.
Moving Average Power Stack: The 20, 50, and 100-day EMAs are perfectly aligned in a bullish sequence. The price is trending sharply above the 20-day EMA (orange line), which is acting as a strong dynamic cushion for the current rally.
Volume Profile: The initial breakout was supported by a noticeable volume spike (926.61K), confirming institutional interest. The current consolidation is happening on lower volume, which is characteristic of a healthy "bull flag" setup.
Trade Setup:
Entry: Current Market Price (₹2,197.40) or on a definitive close above the flag resistance of ₹2,255.
Stop Loss (SL): ₹1,980 (Placed safely below the 20-day EMA and the recent swing low).
Targets:
Target 1: ₹2,550 (Immediate psychological and momentum target)
Target 2: ₹2,800+ (Based on the measured move of the breakout pole)
Disclaimer:
This analysis is for educational and informational purposes only. Trading in the stock market involves significant financial risk. Please conduct your own research or consult with a SEBI-registered financial advisor before making any investment decisions. I am not a SEBI-registered advisor.
NIFTY- Intraday Levels :- 12th May 2026 Expiry day..option buyers be careful please.
NIFTY sustain above 23828 then 23841/60 above this bullish then 23918/28/38 or 23953/61 above this more above this wait more levels marked on chart.
If NIFTY sustain below 23802/23794 below this bearish then 23747/31/15 below this more bearish last hope 23629/09 below this wait more levels marked on chart
My view :-
"My viewpoint, offered purely for analytical consideration, The trading thesis is: Nifty (bearish tactical approach: sell on rise) however we can expect both side movements
On expiry day sometimes shorts are covered and may lead to sudden movements.
This analysis is highly speculative and is not guaranteed to be accurate; therefore, the implementation of stringent risk controls is non-negotiable for mitigating trade risk."
Consider some buffer points in above levels.
Please do your due diligence before trading or investment.
**Disclaimer -
I am not a SEBI registered analyst or advisor. I does not represent or endorse the accuracy or reliability of any information, conversation, or content. Stock trading is inherently risky and the users agree to assume complete and full responsibility for the outcomes of all trading decisions that they make, including but not limited to loss of capital. None of these communications should be construed as an offer to buy or sell securities, nor advice to do so. The users understands and acknowledges that there is a very high risk involved in trading securities. By using this information, the user agrees that use of this information is entirely at their own risk.
Thank you.
USD/CHF Tries to Rebound, But Trend Remains WeakUSD/CHF attempted to rebound from a two-month low around 0.7760, but the movement remained stuck below the psychological level of 0.7800.
Although the US Dollar (USD) is gaining strength from geopolitical tensions and expectations of hawkish Federal Reserve policy, the pair's technical structure remains strongly tilted to the downside.
✅ Fundamental Dynamics: Safe-Haven Tug-of-War
Current global factors are contributing to mixed sentiment for this pair:
- Diplomatic Deadlock: Iran's rejection of US nuclear demands (as reported by the WSJ) has dashed hopes for an imminent peace deal. This has rekindled demand for the USD as a major reserve currency.
- Inflation & Fed Expectations: The deadlock in the Strait of Hormuz has raised energy prices, rekindling inflation concerns. Coupled with Friday's solid Nonfarm Payrolls (NFP) data, the market is starting to price in the possibility of a 25 basis point Fed rate hike later in the year. This outlook provides support for the US Dollar against the Swiss Franc (CHF).
- Swissie Status: Despite the strengthening USD, the CHF remains in demand as a pure safe haven amidst rising war risks, which explains why today's USD/CHF rally appears "struggling" and lacks strength.
✅ Key Levels to Watch
- Key Resistance (0.7926): A daily close above this level is needed to ease selling pressure and shift the bias to neutral/bullish.
- Psychological Barrier (0.7800): Intraday resistance currently being tested. Failure to break this level will invite renewed selling.
- Support: Technically, there is no clear price support level near the current area. If the 0.7760 level is breached again, the pair is vulnerable to deeper losses towards last year's structural bottom.
Gold Prices Under Dominant Bearish PressureGold prices (XAU/USD) faced pressure again at the opening of this week. The diplomatic optimism that emerged last week was quickly shattered by the nuclear negotiations deadlock, while solid US employment data provided ammunition for the US Dollar (USD) to dominate the market.
--------------------------------------------------------------------------------------------------
✅ Geopolitics: "Totally Unacceptable"
Negotiations between Washington and Tehran have reached a dangerous impasse:
- ⚡Nuclear Deadlock: A Wall Street Journal report stated that Iran has categorically rejected US demands to dismantle its nuclear facilities and halt uranium enrichment for 20 years.
- ⚡Trump's Harsh Response: President Donald Trump immediately condemned the rejection as "totally unacceptable." This statement reignited the risk of military escalation in the Strait of Hormuz.
- ⚡Oil Effect: The failure of the peace proposal triggered a new spike in crude oil prices, which rekindled concerns about global inflation—a scenario that typically supports the USD and puts pressure on gold.
--------------------------------------------------------------------------------------------------
✅ Monetary: Solid NFP & Rate Hike Speculation
The US dollar is receiving fundamental support from domestic economic data:
- ⚡NFP Surprise: Friday's report showed an increase of 115,000 jobs (well above expectations), while unemployment held steady at 4.3%. This indicates that the US economy is still quite hot.
- ⚡Rate Hike Odds: According to the CME FedWatch Tool, the market is now pricing in a 20% chance of at least one 25bp rate hike later this year. The prospect of higher yields on the USD makes non-yielding gold less attractive.
--------------------------------------------------------------------------------------------------
✅ XAU/USD Technical Analysis (Intraday)
Technically, gold is at a crossroads ahead of inflation data:
- ⚡Resistance Zone ($4,500): This psychological level remains a crucial support. As long as the price holds above this level, last week's recovery is still considered viable.
- ⚡Immediate Resistance ($4,680 - $4,700): Gold needs to break through this area to invalidate the bearish bias that has re-established today.
- ⚡"Wait & See" Mode: The lack of aggressive selling today suggests traders are holding back ahead of tomorrow's CPI and Wednesday's PPI releases.
BTCUSD Bullish Reversal ZoneThe overall market bias remains bullish, so I am currently focused on bullish continuation setups.
After the previous high was broken, I expected the old supply area to return as a retest. To track that possibility, I copied the entire supply range from the left-side structure and projected the same zone into the current market area.
Price is now reacting inside this reversal zone. If the market forms strong bullish confirmation or any positive price action pattern here, it could continue moving toward the upside.
I also marked a “VOL BURST” level below the zone. This area may act as a liquidity sweep zone, meaning price could briefly move below it before reversing, or continue ranging between the VOL BURST level and the reversal zone before the next move begins.
At the moment, the market is showing a repeated supply structure, while demand strength appears relatively slow. Because of that, the sell-side reaction came aggressively.
For now, the bullish bias remains intact unless market structure shifts clearly bearish.
XAUUSD/GOLD 4H SELL PROJECTION 11.05.26Gold market currently looks bearish on the 4H timeframe after rejecting from the strong resistance zone near 4708–4710. Price already broke the neckline support and completed a clean retest, which indicates seller confirmation in the market. If gold continues trading below the resistance area, sellers may push the price toward 4660 minor support first, followed by the major support zone around 4640–4632. Market structure still favors sellers unless price breaks above the resistance zone strongly.
ENTRY ZONE: 4672 – 4676
SL: 4702
TP1: 4660
TP2: 4640
TP3: 4632
Nifty 50 - Pre Open Setup - 11 May 2026Gift Nifty suggests a gapdown of 127 points to somewhere near 24050 and bearing a bearish trend as the peace talks fails again with US president Trump rejecting many points in the proposal. The crude trades near $100 shows the weakness will persist andcan drift market to 23850 support zone in steps.
No-Trade Zone for today.
The primary no-trade zone is 24,127 to 24,255, where price is likely to remain choppy. Upside targets above the zone are 24,337, 24,387, and 24,472. Downside targets below the zone are 24,060, 23,997, and 23,887.
Silver: NWOG Liquidity Sweep Setting Up H4 SelloffRight now, price is sweeping both Daily and H4 liquidity while trading directly inside NWOG territory. That combination matters because it signals the market is reaching into premium pricing while engineering breakout participation.
Current framework:
Daily liquidity being raided
H4 liquidity also under attack simultaneously
NWOG acting as premium delivery zone
H4 equal lows resting below current structure
Major H4 lows sitting as downside draw on liquidity
My expectation:
Once H1 confirms a CISD and bearish order flow begins to shift, the market can aggressively reprice lower toward the equal lows and eventually the H4 lows beneath.
The market often attacks external highs before delivering into resting lows.
NIFTY- Intraday Levels :- 11th May 2026 NIFTY sustain above 24187 above this bullish then 24309/33 above this more bullish then 24376 above this wait more levels for more level refer previous day analysis.
If NIFTY sustain below 24171/155 below this bearish then 24096/67 then 24021/23999 below this more bearish then below this wait more levels marked on chart
My view :-
"My viewpoint, offered purely for analytical consideration, The trading thesis is: Nifty (bearish tactical approach: sell on rise) however we can expect both side movements
This analysis is highly speculative and is not guaranteed to be accurate; therefore, the implementation of stringent risk controls is non-negotiable for mitigating trade risk."
Consider some buffer points in above levels.
Please do your due diligence before trading or investment.
**Disclaimer -
I am not a SEBI registered analyst or advisor. I does not represent or endorse the accuracy or reliability of any information, conversation, or content. Stock trading is inherently risky and the users agree to assume complete and full responsibility for the outcomes of all trading decisions that they make, including but not limited to loss of capital. None of these communications should be construed as an offer to buy or sell securities, nor advice to do so. The users understands and acknowledges that there is a very high risk involved in trading securities. By using this information, the user agrees that use of this information is entirely at their own risk.
Thank you.
Xauusd gold today update 11.5.26.*🟡 XAUUSD (Gold) – TODAY UPDATE 🟡 ⏰*
*Validity: 11-05-26*
*🔹 Bullish Scenario (BUY)*
*• Trend Confirmation: Above 4755*
*• Targets: 4785– 4820*
*🔻 Bearish Scenario (SELL)*
*• Trend Confirmation: Below 4670*
*• Targets: 4642– 4606*
*🔄Key Reversal /Entry : 4713*
#goldsignal #trading #EURUSD #intraday #scalping #eurusdsignal #freevipsignal #ᴠɪʀᴀʟᴘᴏsᴛ #tradingreels #anantmoney
Xauusd gold weekly Updates *🟡 XAUUSD (GOLD) – WEEKLY UPDATE 🟡 ⏰*
*Validity: 11-05-26 to 15-05-26*
*🔹 Bullish Scenario (BUY)*
*• Trend Confirmation: Above 4830*
*• Targets: 4920 – 5080*
*🔻 Bearish Scenario (SELL)*
*• Trend Confirmation: Below 4490*
*• Targets: 4400 – 4292*
*🔄 Key Reversal / Entry Level: 4665*