Wheels India Limited - Breakout Setup, Move is ON...#WHEELS trading above Resistance of 2006
Next Resistance is at 3316
Support is at 1371
Here is previous chart:
This weekly chart for Wheels India Limited displays a strong bullish breakout from a consolidation pattern, supported by significant volume and long-term trendline context.
Chart Overview
Timeframe & Asset: Wheels India Limited (1-Week Chart, NSE).
Current Price: 2,230.10 INR (+29.29% change shown on the chart header).
Key Technical Observations
Horizontal & Channel Breakout: The stock consolidated within a downward-sloping mini-channel (white lines) and a long-term range before breaking out above 1,078.00 INR, marked by the yellow Breakout arrow.
Volume Expansion: The blue arrow highlights a substantial surge in trading volume during the initial breakout phase, confirming strong institutional buying conviction.
Support Levels:
1,078.00 INR (Yellow Line): The horizontal level corresponding to the initial breakout point and dynamic base support.
1,371.00 INR (Red Line): A major horizontal resistance (marked with a red arrow) that has flipped to become the primary structural support level on subsequent pullbacks.
Resistance Levels:
Resistance 1 (2,006.00 INR): A structural resistance level (green line) that the current price candle has tested and breached to trade at 2,230.10 INR.
Resistance 2 (3,316.00 INR): The long-term upside projection level marked near the top green line.
Long-Term Trend Lines: The solid blue lines form a multi-year ascending channel that defines the macro uptrend, with the price currently advancing along the upper half of this channel.
Conclusion & Current Price Action
The current price action reflects strong bullish momentum following the volume-backed breakout above 1,078.00 INR and a successful retest of the 1,371.00 INR support zone. The stock has recently cleared its immediate hurdle at Resistance 1 (2,006.00 INR).
A sustained weekly close above this Resistance 1 zone indicates room for extended upside toward the long-term upside projection level of 3,316.00 INR (Resistance 2). On any potential pullbacks, the 1,371.00 INR level will serve as the primary line of defense for buyers to keep the structural uptrend intact.
A parallel channel (also known as an ascending, descending, or horizontal channel) is a technical analysis pattern bounded by two parallel trendlines that encompass a security’s price action over time.
Structure & Mechanics
Main Components:
Trendline / Base Line: Connects a series of prominent reaction lows (in an uptrend) or reaction highs (in a downtrend).
Channel Line: Drawn parallel to the trendline, connecting the peaks (top boundary) or troughs (bottom boundary).
Price Movement: Price oscillates between the upper boundary (which acts as dynamic resistance) and the lower boundary (which acts as dynamic support).
Types of Channels
Ascending Channel (Bullish): Characterized by higher highs and higher lows. Indicates a steady uptrend where buying pressure dominates.
Descending Channel (Bearish): Characterized by lower highs and lower lows. Represents a controlled downtrend or corrective pullback.
Horizontal Channel (Consolidation): Moving sideways between static support and resistance lines, signaling market indecision or range-bound trading.
How Traders Use Parallel Channels
Trading Within the Range: Buying near the channel's lower boundary (support) and selling or shorting near the upper boundary (resistance).
Breakout Trading: A strong, high-volume candle breaking outside either boundary signals potential trend acceleration or continuation in the direction of the breakout (as seen in the charts provided previously).
Midline (50% Line): Often, a dashed line is drawn down the middle of the channel. Price reacting to this midline can confirm the channel's validity and act as interim support or resistance.
Disclaimer: This is for demonstration and educational purpose only. This is not buying or selling recommendations. I am not SEBI registered financial advisor. Please consult your financial advisor before taking any trade.
 Long
Long
SJS: Massive Box Consolidation and Explosive Structural Breakout1. The Macro Perspective: The Wide Accumulation Zone
I am taking a LONG bias on S.J.S. Enterprises Limited (SJS) on the daily (1D) timeframe.
When analyzing pure market structure, we want to look for areas where massive amounts of shares are exchanging hands over a prolonged period. Look at the macro structure on this chart. For months, the stock has been trapped in a wide, highly volatile consolidation "box." It has been ping-ponging between a concrete support floor near 1,538.65 and a heavy historical resistance ceiling at 1,851.90. This prolonged sideways chop is the ultimate washing machine—it shakes out impatient retail traders and allows strong-handed institutional buyers to accumulate massive positions without driving the price up prematurely.
2. The Educational Setup: The Power of the Box Breakout
In technical analysis, the longer the base, the higher in space.
The Accumulation Floor: Every time the stock experienced a deep washout toward the 1,538.65 level, buyers aggressively stepped in to defend it. They refused to let the macro structure break down.
The Pressure Cooker: By continuously absorbing supply and testing the 1,851.90 ceiling, the stock stored immense kinetic energy. Right before the breakout, notice how the price formed a sharp V-shaped recovery off the lows, rocketing straight into the resistance line. This showed that buyers were highly motivated and unwilling to wait for another dip.
3. Current Price Action: The Lid Blows Off
Look at the most recent daily candles on the far right. The pressure cooker has finally exploded. Buyers have effortlessly shattered the 1,851.90 macro resistance, printing powerful, consecutive green expansion candles and surging straight toward the 2,000.00 psychological level. By clearing this massive accumulation zone, SJS has officially entered pure price discovery. With historical overhead supply now eliminated, natural selling pressure evaporates.
4. The Trade Plan: Entries, Targets, and Risk Management
Entry Strategy: Momentum is exceptionally strong right now near 1,996.10. Chasing a massive daily expansion candle always carries a higher risk of an immediate intraday drawdown. The highest-probability, lowest-risk entry involves placing limit orders to catch a potential minor structural pullback to retest the 1,850.00 to 1,900.00 breakout zone. Letting that old heavy resistance prove itself as a new, indestructible support floor offers a phenomenal risk-to-reward ratio.
Take Profit (Targets): We can find a measured technical target by taking the height of the consolidation box (roughly 313 points from the 1,538.65 floor to the 1,851.90 ceiling) and adding it to the breakout level. This gives us a primary structural target in the 2,150.00 to 2,165.00 zone. Immediate psychological milestones sit at 2,050.00 and 2,100.00.
Invalidation (Stop Loss): A trade thesis is only valid if the new market structure holds. A hard stop loss should be placed safely below the breakout line and recent swing structure, around the 1,750.00 to 1,780.00 level. A definitive daily close completely back inside the box and below the 1,851.90 line would act as an early warning sign of a failed macro breakout (a "bull trap").
5. Time Horizon:
Because this technical setup is built on a 1-Day chart capturing a massive structural phase transition and momentum breakout, this is a short-to-medium-term swing trade designed to capture the explosive markup phase. Let the trend run!  Long
Long
India Nippon Electricals Limited - Breakout Setup, Move is ON...#INDNIPPON trading above Resistance of 1310
Next Resistance is at 1717
Support is at 1057
Here is previous chart:
This weekly chart for India Nippon Electricals Limited displays a strong bullish breakout from a consolidation channel, supported by extraordinary volume expansion and a successful retest of key structural levels.
Chart Overview
Timeframe & Asset: India Nippon Electricals Limited (1-Week Chart, NSE).
Current Price: 1,358.90 INR (+17.33% change shown on the chart header).
Key Technical Observations
Horizontal & Channel Breakout: The stock consolidated within a downward-sloping mini-channel (white solid and dashed lines) before decisively breaking out to the upside, marked by the yellow Breakout arrow.
Volume Expansion: The blue arrow highlights a massive volume surge at the bottom chart panel during the breakout and subsequent expansion phase, signaling strong institutional interest and buying conviction.
Support Levels:
810.00 INR (Yellow Line): A major multi-year horizontal level that acted as resistance before turning into foundational base support during the initial channel breakout.
1,057.00 INR (Red Line): A critical horizontal support level (marked with a red arrow) that held firmly during pullbacks and acted as a launching pad for the current leg up.
Resistance Levels:
Resistance 1 (1,310.00 INR): A structural horizontal resistance level (green line) that the price candle has decisively cleared, with the current price trading at 1,358.90 INR.
Resistance 2 (1,717.00 INR): The long-term upside projection level marked near the top green line.
Long-Term Trend Lines: The solid blue lines form a broad, multi-year ascending channel defining the overarching macro uptrend, while the dashed blue center-line provided dynamic support across prior consolidation phases.
Conclusion & Current Price Action
The current price action reflects powerful bullish momentum following the volume-backed channel breakout and a successful higher-low support test at 1,057.00 INR. The stock has cleared its immediate hurdle at Resistance 1 (1,310.00 INR) with strong weekly gains.
A sustained weekly close above the 1,310.00 INR level reinforces the bullish continuation toward the long-term upside projection level of 1,717.00 INR (Resistance 2). On any interim pullbacks, the 1,057.00 INR level serves as the primary line of defense for buyers to keep the structural macro trend intact.
A parallel channel (also known as an ascending, descending, or horizontal channel) is a technical analysis pattern bounded by two parallel trendlines that encompass a security’s price action over time.
Structure & Mechanics
Main Components:
Trendline / Base Line: Connects a series of prominent reaction lows (in an uptrend) or reaction highs (in a downtrend).
Channel Line: Drawn parallel to the trendline, connecting the peaks (top boundary) or troughs (bottom boundary).
Price Movement: Price oscillates between the upper boundary (which acts as dynamic resistance) and the lower boundary (which acts as dynamic support).
Types of Channels
Ascending Channel (Bullish): Characterized by higher highs and higher lows. Indicates a steady uptrend where buying pressure dominates.
Descending Channel (Bearish): Characterized by lower highs and lower lows. Represents a controlled downtrend or corrective pullback.
Horizontal Channel (Consolidation): Moving sideways between static support and resistance lines, signaling market indecision or range-bound trading.
How Traders Use Parallel Channels
Trading Within the Range: Buying near the channel's lower boundary (support) and selling or shorting near the upper boundary (resistance).
Breakout Trading: A strong, high-volume candle breaking outside either boundary signals potential trend acceleration or continuation in the direction of the breakout (as seen in the charts provided previously).
Midline (50% Line): Often, a dashed line is drawn down the middle of the channel. Price reacting to this midline can confirm the channel's validity and act as interim support or resistance.
Disclaimer: This is for demonstration and educational purpose only. This is not buying or selling recommendations. I am not SEBI registered financial advisor. Please consult your financial advisor before taking any trade.  Long
Long
Why “Buy Low, Sell High” Fails So Many Traders“Buy low, sell high” sounds like the simplest rule in trading.
Buy when the price is low. Sell when the price is high.
But in real markets, this idea often causes traders to buy too early in a downtrend and sell too early in an uptrend.
1. “Low” and “High” Are Always Relative
A price that looks very low today can still fall much further if the bearish structure remains intact.
On the other hand, a price that looks extremely high can continue rising if the trend remains strong.
A low price is not automatically a Buy opportunity. A high price is not automatically a Sell signal.
The more important question is:
Where is price within the current market structure?
2. Traders Often Buy When the Market Is at Its Weakest
After a sharp decline, price suddenly looks “cheap.”
This is when many traders start trying to catch the bottom simply because they think:
“It has already fallen too much.”
But if the market is still forming Lower Highs + Lower Lows , support keeps breaking, and selling pressure has not weakened, you are not necessarily “buying low.”
You may simply be buying into a downtrend that is not over yet.
3. “Sell High” Can Make You Exit Too Early
The opposite mistake happens when traders see price rally strongly and immediately want to sell because the market looks “too high.”
But in a healthy uptrend, Higher Highs and Higher Lows can continue for much longer than expected.
Don’t sell just because price looks high. Sell when the structure starts giving you a reason to exit.
4. Location Matters More Than the Absolute Price
Instead of asking:
“Is the price low enough yet?”
Ask:
Is price at support or in the middle of a range?
Is the broader trend bullish or bearish?
Has price action provided confirmation?
If I’m wrong, where is my invalidation?
A “cheap” price without structural support can always become cheaper.
5. A Better Approach Than Buy Low – Sell High
A more practical way to think about the market is:
Buy strength after weakness has failed.
Sell weakness after strength has failed.
In simple terms:
Don’t try to predict the bottom.
Don’t try to call the top.
Wait for the market to prove that control has shifted from one side to the other.  Education
Long 
Before You Buy the Dip, Check This“Buy the dip” sounds simple: price drops, you buy at a lower price, and wait for the market to recover.
But there is one major problem:
Not every drop is a pullback. Sometimes, you are buying just as the trend is beginning to change.
1. Dip or Breakdown?
In a healthy uptrend, pullbacks are normal as long as the broader structure remains intact. Price corrects, buyers step back in, and the market continues to maintain Higher Highs and Higher Lows .
But if key support breaks and price begins forming Lower Highs and Lower Lows , the story has changed.
A lower price does not automatically mean a better opportunity.
2. Look at Where Price Is Pulling Back To
A dip into support, a previous breakout zone, or an important structural level is more meaningful than buying simply because price has fallen 5% or 10%.
The important question is not how far price has dropped.
It is:
“Are buyers actually stepping back in at this level?”
3. Don’t Catch a Falling Knife Just Because It’s Falling
One small green candle after a sharp decline is not necessarily confirmation.
Watch whether price can hold support, reclaim a lost level, or begin rebuilding bullish structure.
Location gives you an area to watch. Price action gives you a reason to act.
4. Always Know When Your Idea Is Wrong
Before you buy the dip, define what would invalidate your bullish thesis.
If price continues breaking structure and you keep buying simply because “it’s even cheaper now,” buying the dip can quickly turn into averaging down in a downtrend .
Before You Buy the Dip, Check This
Is the broader trend still bullish?
Is key support still holding?
Has price action confirmed that buyers are returning?
If you’re wrong, where is the invalidation?
Don’t buy the dip just because price has fallen. Buy when the decline is still part of a structure that gives you a clear reason to believe buyers remain in control.  Education
XAUUSD: Sellers Reject the Recovery — Is 4,280 the Next Target?After a short-term rebound, XAUUSD is showing renewed weakness as price struggles below the descending trendline and the Ichimoku resistance area. The recovery toward 4,430–4,440 has so far failed to change the broader bearish structure, keeping sellers in control.
In terms of news, gold is under pressure as rising oil prices revive inflation concerns, while strong U.S. employment data has increased expectations that the Federal Reserve could raise rates again. Markets are currently pricing roughly a 60% probability of a Fed rate hike, making upcoming U.S. inflation data especially important. Higher rate expectations remain a headwind for non-yielding gold, even though a softer U.S. dollar is providing some support.
Looking at the H3 chart, the technical structure also supports a bearish scenario:
Price has been repeatedly rejected from the descending trendline.
The 4,425–4,440 area overlaps with trendline resistance and the upper Ichimoku zone.
Price is now trading around 4,393, showing that the latest rebound has already lost momentum.
The 4,360–4,385 zone is the nearest support. A decisive break below this area could accelerate selling pressure toward the lower demand zone.
📉 Main Scenario
Resistance: 4,425–4,440
Support: 4,360–4,385
Target: 4,280–4,300
As long as XAUUSD remains below the descending trendline and fails to reclaim 4,440, I continue to favor the bearish scenario. A breakdown below 4,360 would strengthen the case for another move toward 4,280–4,300. Short 
Education

 Education

NIFTY- Swing trade levels :- 15th September 2026If NIFTY sustain above 23484/506 (first target and make or break level) then 24572/600 (second target, however weak level) above this bullish then 23755/83 (third target, very strong level) above this more bullish more levels marked on chart.
If NIFTY sustain below 23190/108 then below this bearish then 23554/22472 below this more bearish
My view :-
"My viewpoint, offered purely for analytical consideration, buy on dip, however bullish movement will not be easy, it will be kind of relief rally or more like a relief jump.
Market will either reverse from first target or from third target.
Please do your due diligence before trading or investment.
**Disclaimer -
I am not a SEBI registered analyst or advisor. I does not represent or endorse the accuracy or reliability of any information, conversation, or content. Stock trading is inherently risky and the users agree to assume complete and full responsibility for the outcomes of all trading decisions that they make, including but not limited to loss of capital. None of these communications should be construed as an offer to buy or sell securities, nor advice to do so. The users understands and acknowledges that there is a very high risk involved in trading securities. By using this information, the user agrees that use of this information is entirely at their own risk.
Thank you.  Long
Long
Trading Masterclass #1Institutional trading means trading like hedge funds, banks, prop firms, and professional desks. They do not trade based on emotions, random tips, or gambling. They use systems, probabilities, risk control, position sizing, discipline, and psychology.
Retail traders often lose because they focus only on “entry.” Institutions focus on:
Risk Management
Capital Protection
Position Sizing
Probability
Psychology
Consistency
Repeatable Edge
In options trading, if you think like institutions, your results can improve significantly
 Education

Long 
BTCUSDT: Buyers Are Defending the Bigger PictureBTCUSDT has already delivered a strong expansion higher. Now, instead of chasing the move, the market appears to be building a base before deciding on its next direction.
What catches my attention is where this consolidation is happening. Price is holding around a previous breakout area while the broader ascending channel remains intact. So far, sellers have managed to create a pullback, but they have not done enough to damage the bullish structure.
This makes the current support zone particularly important. If buyers continue absorbing selling pressure here, Bitcoin could regain momentum and begin pushing toward the upper side of the channel.
In that scenario, 83,000 becomes the next area I would watch, rather than simply a random upside target.
The idea remains straightforward: support holds, bullish structure survives, and buyers get another opportunity to take control. A decisive break below this base would be the first reason to question that outlook. Long 
 Short
Short
Long 
Long 
BTCUSD – Ascending Channel Holds, Buyers Eye Another Push Higher🔍 Market Overview
BTCUSD continues to trade inside a well-defined ascending channel on the 2H timeframe, keeping the broader recovery structure intact. The latest pullback has brought price back toward the lower half of the channel, where buyers have previously shown interest.
Despite the recent weakness, there is no clear structural breakdown yet. As long as the lower channel boundary continues to hold, the current decline can still be viewed as a pullback within a broader bullish structure rather than the start of a deeper reversal.
📈 Market Structure Details
Short-Term Trend: Bullish
Momentum: Recovering
Current Phase: Pullback → Support Test → Potential Continuation
The ascending channel remains the most important technical structure on the chart. Price has repeatedly rotated between its boundaries, with buyers stepping in near the lower portion of the range.
If demand returns during the current pullback, BTCUSD could begin another rotation toward the upper side of the channel.
🚀 Trading Scenarios
✅ Bullish Scenario — Preferred Setup
Conditions to watch:
The ascending channel remains intact.
Buyers continue to defend the lower channel structure.
The current pullback begins to lose bearish momentum.
Price starts rebuilding higher lows.
Trading Plan:
Look for buying opportunities after bullish confirmation near the lower channel area rather than chasing short-term rebounds. A strong reaction from this structure would support another move toward the upper channel boundary.
🎯 Main Target: 82,000–82,300
A sustained recovery through the middle of the channel would strengthen the bullish continuation scenario.
❌ Bullish Invalidation Conditions
Price decisively breaks below the ascending channel.
Buyers fail to defend the current pullback.
The recent market structure shifts into lower lows.
Selling momentum accelerates below channel support.
A confirmed breakdown below the channel would weaken the bullish thesis and increase the risk of a deeper correction.
📍 Key Levels to Watch
🟢 Main Target: 82,000–82,300
🔴 Key Area: Lower ascending channel support
⚠️ Trading Outlook
The current BTCUSD structure still favors buyers while price remains inside the ascending channel. The recent decline has weakened short-term momentum, but it has not yet damaged the broader structure.
For now, I favor a bullish recovery toward the upper channel area, provided buyers successfully defend the lower boundary.
The better approach is to wait for confirmation around support rather than trying to predict the exact bottom.
🧠 Professional Assessment
BTCUSD 2H – Ascending Channel Holds, Buyers Eye Another Push Higher
🔍 Market Overview
BTCUSD continues to trade inside a well-defined ascending channel on the 2H timeframe, keeping the broader recovery structure intact. The latest pullback has brought price back toward the lower half of the channel, where buyers have previously shown interest.
Despite the recent weakness, there is no clear structural breakdown yet. As long as the lower channel boundary continues to hold, the current decline can still be viewed as a pullback within a broader bullish structure rather than the start of a deeper reversal.
📈 Market Structure Details
Short-Term Trend: Bullish
Momentum: Recovering
Current Phase: Pullback → Support Test → Potential Continuation
The ascending channel remains the most important technical structure on the chart. Price has repeatedly rotated between its boundaries, with buyers stepping in near the lower portion of the range.
If demand returns during the current pullback, BTCUSD could begin another rotation toward the upper side of the channel.
🚀 Trading Scenarios
✅ Bullish Scenario — Preferred Setup
Conditions to watch:
The ascending channel remains intact.
Buyers continue to defend the lower channel structure.
The current pullback begins to lose bearish momentum.
Price starts rebuilding higher lows.
Trading Plan:
Look for buying opportunities after bullish confirmation near the lower channel area rather than chasing short-term rebounds. A strong reaction from this structure would support another move toward the upper channel boundary.
🎯 Main Target: 82,000–82,300
A sustained recovery through the middle of the channel would strengthen the bullish continuation scenario.
❌ Bullish Invalidation Conditions
Price decisively breaks below the ascending channel.
Buyers fail to defend the current pullback.
The recent market structure shifts into lower lows.
Selling momentum accelerates below channel support.
A confirmed breakdown below the channel would weaken the bullish thesis and increase the risk of a deeper correction.
📍 Key Levels to Watch
🟢 Main Target: 82,000–82,300
🔴 Key Area: Lower ascending channel support
⚠️ Trading Outlook
The current BTCUSD structure still favors buyers while price remains inside the ascending channel. The recent decline has weakened short-term momentum, but it has not yet damaged the broader structure.
For now, I favor a bullish recovery toward the upper channel area, provided buyers successfully defend the lower boundary.
The better approach is to wait for confirmation around support rather than trying to predict the exact bottom.
🧠 Professional Assessment
This setup is supported by:
Ascending channel remains intact.
Price is approaching a structurally important area.
The broader sequence still favors recovery.
Current weakness remains contained within the channel.
Upper channel resistance provides a clear upside objective.
Preferred approach: Wait for buyers to show clear strength around channel support before considering continuation opportunities.
🛡️ Risk Management
Risk only 1–2% of trading capital per position.
Define invalidation before entering.
Do not maintain the bullish thesis after a confirmed channel breakdown.
Avoid excessive leverage during volatile Bitcoin sessions.
Wait for confirmation instead of anticipating the reversal.
Disclaimer: This market analysis is provided for educational purposes only and should not be considered financial or investment advice.
This setup is supported by:
Ascending channel remains intact.
Price is approaching a structurally important area.
The broader sequence still favors recovery.
Current weakness remains contained within the channel.
Upper channel resistance provides a clear upside objective.
Preferred approach: Wait for buyers to show clear strength around channel support before considering continuation opportunities.
🛡️ Risk Management
Risk only 1–2% of trading capital per position.
Define invalidation before entering.
Do not maintain the bullish thesis after a confirmed channel breakdown.
Avoid excessive leverage during volatile Bitcoin sessions.
Wait for confirmation instead of anticipating the reversal.
Disclaimer: This market analysis is provided for educational purposes only and should not be considered financial or investment advice. Long 
Nifty Intraday Outlook for 11-09-2026📊 **NIFTY 15-Min: Strong Gap-Down Expected in a Bearish Structure**
NIFTY remains inside a clear downtrend with lower highs, lower lows and continued rejection from the descending trendline and moving-average structure.
GIFT Nifty indicates a sharp gap-down, which may take price directly below the 23,380 support and close to the first downside target.
That means chasing PE immediately at the opening may offer poor risk-reward.
---
📌 **Important Levels**
Resistance:
• 23,430
• 23,470
Upside Targets:
• 23,520
• 23,570
• 23,640
Support:
• 23,320
Downside Targets:
• 23,280
• 23,220
• 23,130
---
📉 **Bearish Plan**
If NIFTY opens below 23,380:
• Do not chase PE immediately
• Prefer a pullback toward 23,380–23,430 followed by bearish rejection
• Targets: 23,320 / 23,280 / 23,220
Below 23,320:
• Stronger bearish continuation
• Prefer breakdown + failed reclaim
• Targets: 23,280 / 23,220 / 23,130
Do not chase PE after an extended candle directly into the first downside target.
---
📈 **Bullish Plan**
If NIFTY quickly reclaims and sustains above 23,380:
• Short-covering recovery can develop
• Targets: 23,420 / 23,470
Safer CE confirmation comes only above 23,470.
Targets:
• 23,520
• 23,570
• 23,640
A bounce from lower levels alone is not enough — buyers need to reclaim the broken structure.
---
🌍 **Market Context**
GIFT Nifty indicates a sharp negative opening.
Brent crude has surged above $108 as the Middle East conflict intensifies and shipping risks increase across both the Strait of Hormuz and Red Sea.
Asian equities are trading sharply lower, while global bond yields have risen as higher oil prices revive inflation and rate-hike concerns.
Higher crude remains a major risk for India through inflation, import costs, corporate margins and rupee pressure.
---
✅ **Final View**
Below 23,380 → sellers retain control
Below 23,320 → bearish continuation
Below 23,220 → downside momentum can accelerate
Reclaim 23,380 → short-covering bounce possible
Above 23,470 → recovery becomes stronger
Opening directly near 23,320 → DO NOT CHASE PE
Educational analysis only. Trade with confirmation and disciplined risk management.
Gold Aiming Bullish setup towards 4639 and 4840
PEPPERSTONE:XAUUSD is currently consolidating beneath a descending trendline resistance, while a strong horizontal resistance is also sitting around 4,443.77 .
The price is approaching a critical decision zone. A confirmed breakout above 4,443.77 , together with a break of the descending trendline, could open the way for a larger bullish move.
I am bullish on Gold because of:
Descending trendline has been acting as dynamic resistance.
4,443.77 is the key horizontal resistance.
Price is compressing between the descending trendline and rising support, creating a potential breakout structure.
A clean breakout can release the accumulated pressure and potentially push Gold toward 4,656.
RSI is around the 50 level, leaving room for momentum to expand if the breakout occurs.
on Top of all the above, an ABCD formation also in process
I would not chase Gold inside the consolidation. Let the market prove the breakout first.
Trade Setup:
Buy Stop: 4,443.77
SL: 4330.80
TP1: 4639.72
TP2: 4840
I will put 2 trades with buy stop at 4,443.77 . Both SL will be at 4330.80 and aiming 4639.72 as TP1 for my 1st trade and 4840 as TP2 for my 2nd trade. will move the SL to Breakeven after TP1 hits. SPECTRUM Technical Analysis & Setup
Symbol: SPECTRUM (Spectrum Electrical Industries Limited) — Daily Timeframe (NSE)
Current Price: ₹2,878.60 (-3.44% intraday consolidation move)
Market Structure: Following a macro uptrend from the structural low of ₹1,120.60, the stock formed a clean shallow pullback base and delivered a sharp bullish expansion candle to test new high levels near ₹2,878.60.
Key Technical Trade Levels
Entry Zone: ~₹2,878.60 – ₹2,900.00 (Breakout continuation level)
Stop Loss (SL): ₹2,584.80 (Defined risk level below recent consolidation base support)
Immediate Resistance / Target 1: ₹3,099.60 (Horizontal expansion level)
Macro Horizon Target: ₹3,767.00 (Upper green target projection zone)
Structural Low: ₹1,120.60
Trade Bias & Summary
The stock displays strong trend momentum, making higher highs and higher lows in a well-defined uptrend channel. As long as price holds above the ₹2,584.80 support zone on daily closes, the setup remains favorable for upside expansion targeting ₹3,099.60 initially, with extended targets projecting toward ₹3,767.00.
Disclaimer: This post is for educational and technical analysis purposes only and does not constitute financial or investment advice. Always manage your position sizing and risk parameters responsibly.  Long
Long
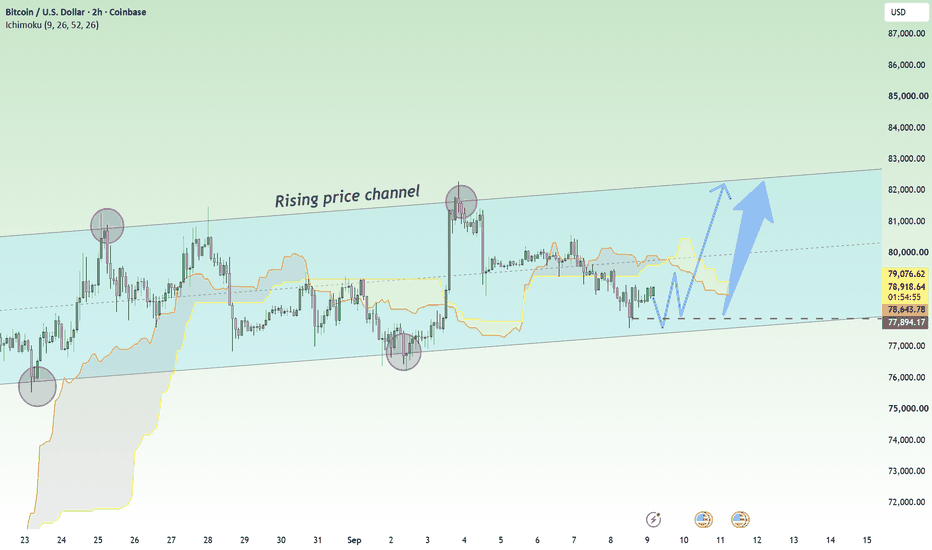
Don’t Rush to Sell BTCUSD – Buyers Are Defending the ChannelBTCUSD is currently leaning toward a short-term BULLISH recovery, as buyers continue to defend the broader rising structure despite a challenging macro backdrop. Oil prices near $100 and uncertainty around the Fed are keeping risk sentiment cautious, but the weaker U.S. dollar is offering some relief to Bitcoin. For now, the macro picture remains mixed rather than strongly bearish, giving BTC room to recover if technical support continues to hold.
On the H2 chart, after the recent rejection from the $81,000–$82,000 area, Bitcoin has entered a corrective phase and moved back toward the lower boundary of its rising price channel. This may look like the beginning of a deeper decline, but so far the bullish channel has not been broken. Previous tests of this lower trendline have attracted buyers, making the current pullback an important area to watch for another reaction.
The $77,900–$78,000 area stands out as the key support zone, where horizontal support and the lower channel boundary come together. If buyers defend this area again, I expect BTCUSD to recover toward $79,000–$80,000 first. A stronger breakout above this region could then open the way toward the upper part of the channel around $82,000.
As long as $77,900 holds, I see the current weakness as a correction within the broader rising structure rather than a confirmed bearish reversal. Long