A Stock Fell 39% From Its High — What Now ?Overview
Imagine a stock that rallied hard for years — climbing from a low base all the way to a strong high, gaining hundreds of percent along the way. Then, over the following months, it falls back nearly 39% from that peak. This is a common pattern across many stocks over time, and it raises a question every investor eventually faces: when a stock you own (or are watching) falls a lot from its high, what should you actually do?
Why Does a Stock Fall After Such a Strong Rally?
A few common
Investing
When China Sneezes, Your Portfolio Catches ColdWhen China Sneezes, Your Portfolio Catches Cold — Even If You Have Never Invested in China.
18% of world GDP. Most Indian investors never buy Chinese stocks. Yet China's economy can move NSE:TATASTEEL , NSE:HINDALCO , NIFTY50, commodity prices, and even FII flows. Here's why every investor should monitor China's PMI, commodity demand, and economic growth. The largest consumer of almost every commodity. The factory of the world. China's economy touches every portfolio on the planet.
In 201
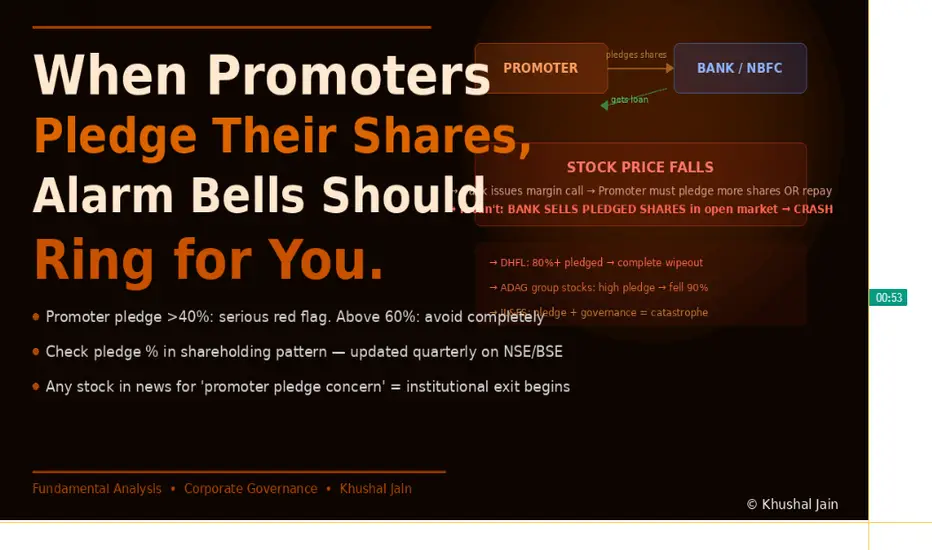
When Promoters Pledge Their Shares, Alarm Bells Should RingWhen Promoters Pledge Their Shares, You Should Be Getting Ready to Exit
Promoter pledging is hidden in plain sight in every quarterly shareholding report. Almost no retail investor checks it. It has preceded some of the biggest stock collapses in Indian market history.
The promoter of a company is its founder, controlling family, or original owner. They typically hold 40–75% of shares. When a promoter needs cash for personal reasons or business expansion but does not want to sell shares (wh
How Professional Investors Read Annual Reports (Cmplt Framework)Hello Traders & Investors! 👋
Most people spend hours watching charts...Some keep looking for the next breakout...Others follow social media tips or TV experts. But the best investors in the world spend their time reading just one document...
The Annual Report.
This is where you'll find everything about a business, how it makes money, where it's growing, what risks it faces, and how management is thinking about the future.
The best part?
Most retail investors never read it properly.
Let'
BTCUSD | Monthly Chart | Long-Term Rising Channel AnalysisBitcoin has once again reached the upper boundary of its long-term rising channel and faced a strong rejection. Historically, every major touch of this resistance has been followed by a significant correction before the next expansion phase.
Key Observations
• Price rejected from the upper trendline after printing a new all-time high.
• Bearish momentum is currently dominating on the monthly timeframe.
• The highlighted gray zone around $30,000–35,000 represents a major historical support and
Smart Money Rotates. Most Retail Investors Never KnowSmart Money Rotates. Most Retail Investors Hold — And Wonder Why They Are Not Profitable.
The economy moves in cycles. Each phase of the cycle has its winners and its losers. This is the map that professionals use and retail traders never see.
Here is a true story that happens in every market cycle.
A retail investor buys IT stocks at the top of the bull market in January 2022. The companies are fantastic — great earnings, great management, great future. Over the next 24 months, those stoc
Starting of the Next Bull Run [Nifty Small Cap 100]A probable investment opportunity in NSE:CNXSMALLCAP for long-term wealth creation.
---------------------------------------------------------------------------------------------------
Scenario: A sustainable breakout from the two-year Pennant Contraction Phase
---------------------------------------------------------------------------------------------------
Nifty Small-Cap 100 is one of the prominent well diversified index that fund managers follow to track the performance of small-cap
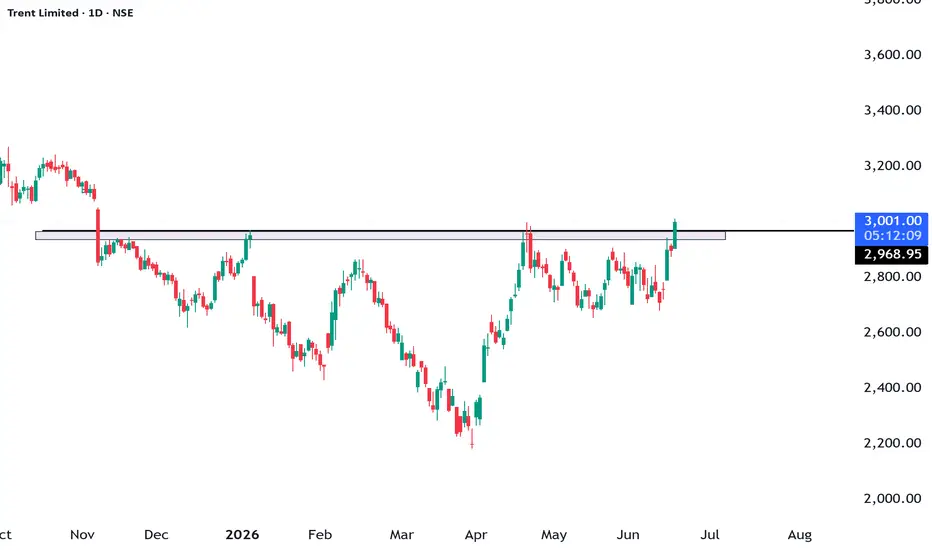
TRENT: Strong Daily Breakout from Key Supply ZoneNSE:TRENT
TRENT (NSE) – Daily Timeframe
TRENT has finally broken above a key resistance zone around ₹2,950–2,970, a level that has acted as a supply area multiple times over the last several months.
Key Observations
✅ Multiple historical rejections from the highlighted zone.
✅ Strong bullish candle closing above resistance.
✅ Higher lows are forming, indicating accumulation.
✅ Potential transition from consolidation to trending move.
Bullish Scenario
If the price sustains above the break
TRADE LIKE VIRAT KOHLI BATSTrade Like Virat Kohli Bats.
Not every ball deserves a shot. Not every candle deserves a trade.
Let me ask you something.
When Kohli walks into bat, does he swing at the very first ball? No. He watches it. He reads the pitch. He understands the bowler. He waits for the right delivery — and then he plays his shot with full conviction.
That is exactly how great traders approach the market.
The Cricket-Trading Parallels That Will Stick With You Forever:
1. You do not have to play ever
The Contraction Phases are Shrinking (April to June, 2026)Since the advent of the US-Iran War, the Indian markets have been suffering. The confusing geopolitical decisions are making the markets crazy. Since April 2026, the Nifty 50 has been falling. Maybe the primary purpose of the restrictive fall was to fill the gap formed on 08th of April. It is also evident that there is technically no room for trend trading.
Too Many Contraction Phases (April to June, 2026):
It is evident that though Nifty 50 has formed a lower-lows and lower-highs structure
TATAELXSI: The 2x Setup ?Is a 100% (2x) move brewing in TATAELXSI? 📈
The chart is showing a textbook Wave 4 flat correction, and the setup is finally approaching a critical inflection point.
The Technical Thesis:
The Correction: We are observing a textbook Wave 4 flat correction that has fully retraced to the 100% mark.
The Hurdle: The 0-B Trendline remains the primary resistance.
The Trigger: A clean breakout above this trendline, supported by a surge in volume, is the confirmation needed for a potential 5th wav
This Ice Cream Stock Could Be Preparing For Its Next Big Move!Hello Traders!
Today I am looking at Vadilal Industries, a stock that has been quietly building a strong technical structure for a long time.
After spending many months moving inside a large consolidation range, the stock is now attempting to break above a major descending resistance trendline while continuing to respect its long term rising support.
This combination often creates a powerful setup because it shows buyers are gradually becoming stronger while sellers continue losing control.
FII and DII: These Two Groups Move Your Market Every DayFIIs and DIIs: The Two Giants You Cannot See But Always Feel
Retail traders look at charts. Smart traders also watch who is moving behind them.
On any given day, retail traders collectively move ₹500–₹1,000 crore in the Indian market.
On the same day, FIIs (Foreign Institutional Investors) may buy or sell ₹5,000–₹15,000 crore — in a single session. Understanding FII and DII activity is not optional for serious traders. It is the difference between swimming with the current and fighting it.
FORTIS Healthcare | Weekly TF | Bull Flag Continuation SetupFORTIS Healthcare Ltd.
Sector: Health Services/Hospital | Timeframe: Weekly | Bias: Bullish
Setup Type: Bull Flag Continuation Setup
FORTIS is showing a strong long-term bullish structure on the weekly timeframe. After a sharp impulsive rally from the rounding bottom breakout zone near 740, the stock entered a healthy corrective phase and formed a classic Bull Flag pattern.
Now price is attempting a breakout from the falling channel, which could trigger the next leg of the uptrend if mom
iShares MSCI Turkey ETF (TUR) | Massive Inverse H&S Monthly TFiShares MSCI Turkey ETF (TUR) | Massive Inverse H&S Bottom reversal on Monthly Chart 🇹🇷📈
The monthly chart of TUR is showing a strong long-term Inverse Head & Shoulders bottom reversal pattern, which could signal the beginning of a major bullish cycle after years of consolidation and downtrend.
The neckline zone around 43–44 has been tested multiple times and price is now attempting a decisive breakout. What makes this setup interesting is the huge multi-year base formation created be
3M Charts - What is Quarterly Price Action ? 🎯 This 3M chart shows a descending triangle structure forming on a higher timeframe, where each candle represents one full quarter of price action. That makes the setup particularly interesting because every candle can capture a complete earnings cycle, adding a large amount of context to the structure.
🔍On this timeframe, the focus is not on predicting what happens next, but on observing how price has behaved over a longer period and how repeated reactions have shaped the pattern. The quarterl
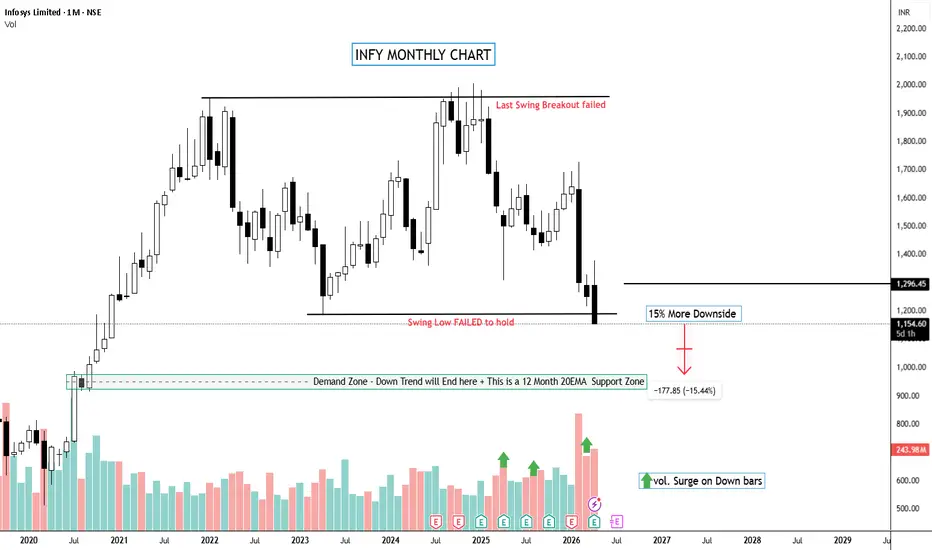
Inofosys Limited 15% Downside PossibilityNSE:INFY
Information technology Sector is going through a difficult phase after a strong rally in 2021 Since then this INFY has nor made any returns to the investors and just drifting sideways in a wide range.
Recently it has broken down below the major swing low support on monthly timeframe and the selloff seems to be very strong on huge volumes.
While most of the short term supports are also broken, The big question for all of the investors is where will this fall end?
And Many waiting wi
The Simplest Line on the Longest Chart — A Trader's Mantra📝 DESCRIPTION
"Simple things work. That's the entire idea"
No indicators. No complex systems. Just one trendline — drawn on a 3-Month Chart, where every single candle represents three full calendar months of price action. All the noise, all the daily swings, compressed into one clean bar. At this level, only the dominant, long-term structure survives.
🔑 Key Terms
Trendline — A straight line connecting significant swing points on a chart. It visually represents the flow of price over time. No
Emcure Pharmaceuticals (NSE:EMCURE) BreakoutThe Emcure Pharmaceuticals gave a breakout in a weekly timeframe from the zone(red zone) of 1595-1597. It is trying to give retest at the crucial juncture of 1595 again, but as the breakout was not supported by enough volumes hence, the stock will come back to the trendline (yellow line) and again try to give a breakout above 1595. If the breakout sustains on weekly timeframe and is supported by strong volumes, then the stock would rally 50% directly to 2400 price target. The target was chosen b