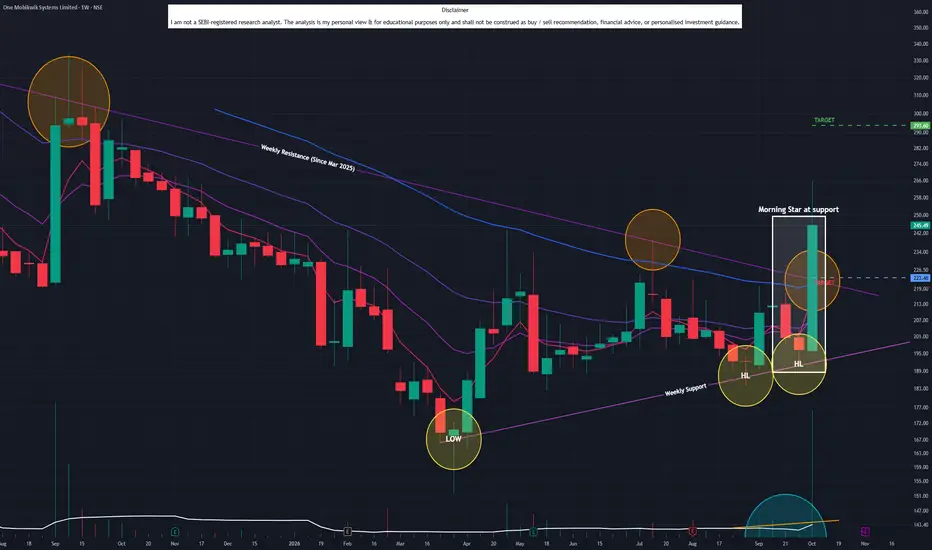
One Mobikwik Systems (W): MASSIVE REVERSAL & BREAKOUTTimeframe: Weekly | Chart Scale: Logarithmic
Explosive +25.10% weekly surge backed by a huge 181.86M volume spike! 🔥
Technical Highlights:
✅ Reversal: Formed a bullish Morning Star pattern at support!
✅ Breakout: Cleared & closed above long-term angular resistance (active since Mar '25).
✅ Volume: Surging volume confirms heavy buyer accumulation.
✅ Momentum: Daily EMA positive crossover . MACD & RSI rising. 🚀
Key Levels to Watch:
🎯 Target: 292
🛡️ Support / Pullback: 223
Morning Star
Before the Move-EP 06, NIFTY is Setting Up for Bullish ReversalBEFORE THE MOVE ⚡ | EP 06
Today’s analysis is an important one.
I’ve covered NIFTY, Paytm, RVNL & PB Fintech and the setups I’m watching for the next move.
NIFTY is showing a potential Morning Star formation on the daily chart, which could become important depending on how the next session develops.
But there’s more to the setup, watch the full video to understand the levels, structure and confirmation I’m looking for.
Want to learn a specific trading or technical analysis topic?
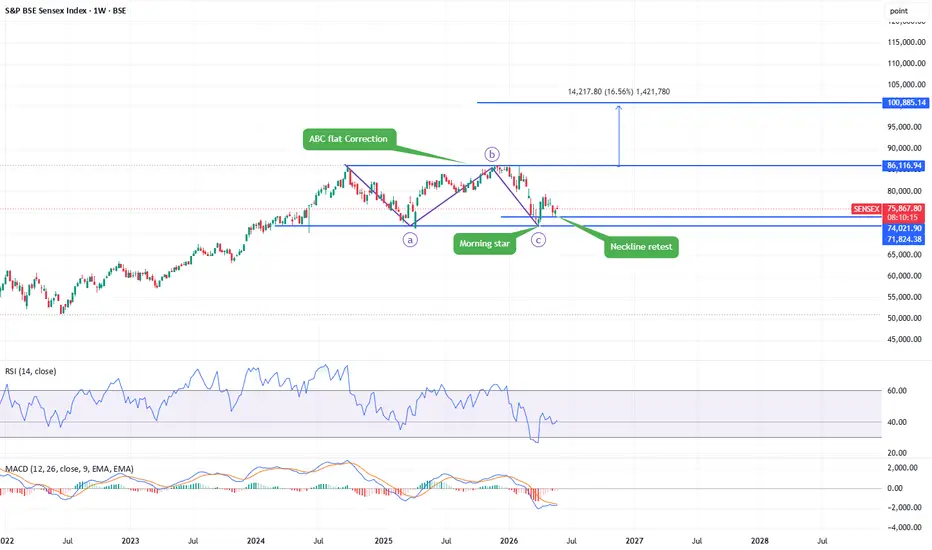
SENSEX Weekly Chart AnalysisSENSEX Weekly Chart Analysis
Chart Structure Overview
Current Price: 75,867.80
Timeframe: Weekly (W) chart on BSE
Date: May 29, 2026
Elliott Wave / Pattern Analysis
ABC Flat Correction
The analyst has identified a classic ABC Flat Correction pattern:
The C wave appears to have bottomed near the 71,824 support level
A Morning Star candlestick pattern formed at the C-wave low — a strong bullish reversal signal
Price is now doing a Neckline Retest after bouncing — this is the critical make-or
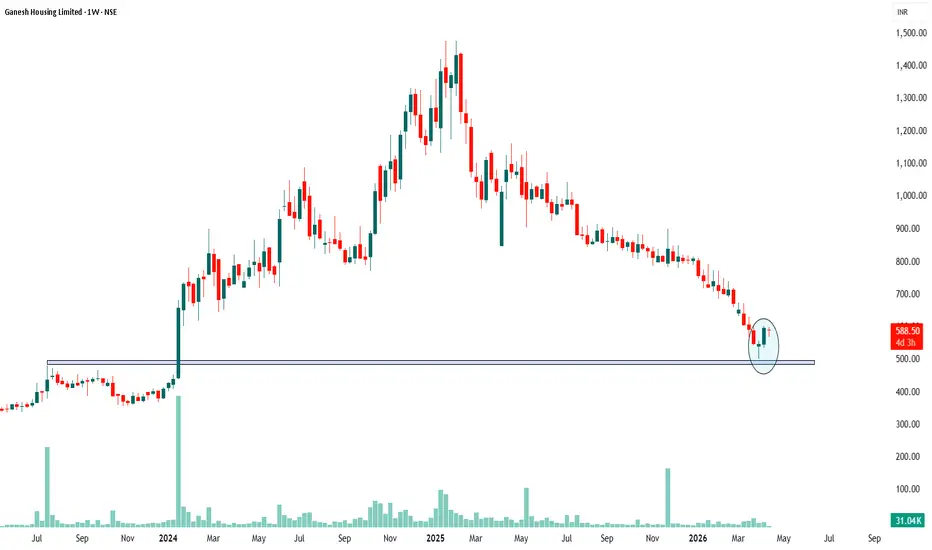
Ganesh Housing – Support & Bullish Reversal ExplainedGanesh Housing had a massive rally from ₹500 all the way to nearly ₹1,400 in 2024 — almost a 3x move. But after that peak, the stock spent all of 2025 giving back those gains, grinding lower week after week until it landed right back where it all started — the ₹500 zone.
That level isn't random. It's where huge buying had happened back in early 2024, which is what launched the big rally in the first place. When price revisits such a zone, those same buyers tend to show up again to defend it — a
MOTILALOFS - LongIn this chart, price has formed a lower low near the support zone, but RSI has made a higher low. This is called positive divergence and it shows that selling pressure is weakening even though price dipped. It often appears near the end of a down move.
Near the same area, a Morning Star pattern is visible. First, there is a strong red candle showing panic selling. Then a small candle appears, showing indecision. Finally, a strong green candle closes well into the body of the first red candle, i
Trent (W): Bullish Reversal, Trend Reversal at Major SupportTimeframe: Weekly | Scale: Logarithmic
The stock is staging a classic reversal after a brutal 2-month correction. The "Morning Star" and "Hammer" combination at the 200-day EMA equivalent support signals that the "Panic Selling" is over and "Smart Money" accumulation has begun.
🚀 1. The Fundamental Catalyst (The "Why")
The reversal is driven by a shift in market perception:
> Valuation Comfort: After correcting ~50% from the top, the stock's valuation has cooled off significantly, attrac
#UNIVPHOTO: Reversal Alert at Falling Channel Midline!CMP: 286
UnivPhoto found support ✅ & bounced strongly off the mid-line of the falling channel (245–266 zone), forming a textbook Morning Star on the weekly chart — a classic bullish reversal! ⭐️🔥
Now testing key resistance 310–337 + downtrend line. A breakout could fuel a rally to 484 → 747/818 → 988 (ATH) 🚀🚀
Could this be the end of the multi-year downtrend? Watch closely! 👀✨
#UNIVPHOTO #MorningStar #CandleStickPattern #PriceAction #LongTerm #Investing
📌 #Disclaimer: This analys
BPCL (D): Forms Bullish MorningStar, Challenges Major ResistanceAfter reversing from a short-term downtrend, BPCL (Bharat Petroleum Corporation Ltd) has flashed a powerful bullish signal. However, this newfound momentum is now running directly into a major, long-term resistance trendline that has capped its progress, setting the stage for a critical battle.
The Bullish Setup: A Morning Star at Support
Today's price action (Monday, October 27, 2025) was highly constructive for the bulls:
- Price & Volume Surge: The stock rallied +3.80% on a strong v
Whirlpool (W) - A Bullish Reversal Faces Its First Major testAfter a significant downtrend, Whirlpool of India is now exhibiting strong signs of a bullish reversal, highlighted by a classic candlestick pattern and a powerful weekly surge. However, it has now arrived at a formidable resistance level that will determine if this new momentum can be sustained.
The Bullish Reversal Signals
The foundation for this potential turnaround has been building systematically:
- Higher Lows: The stock has begun forming a pattern of Higher Lows , indicating that
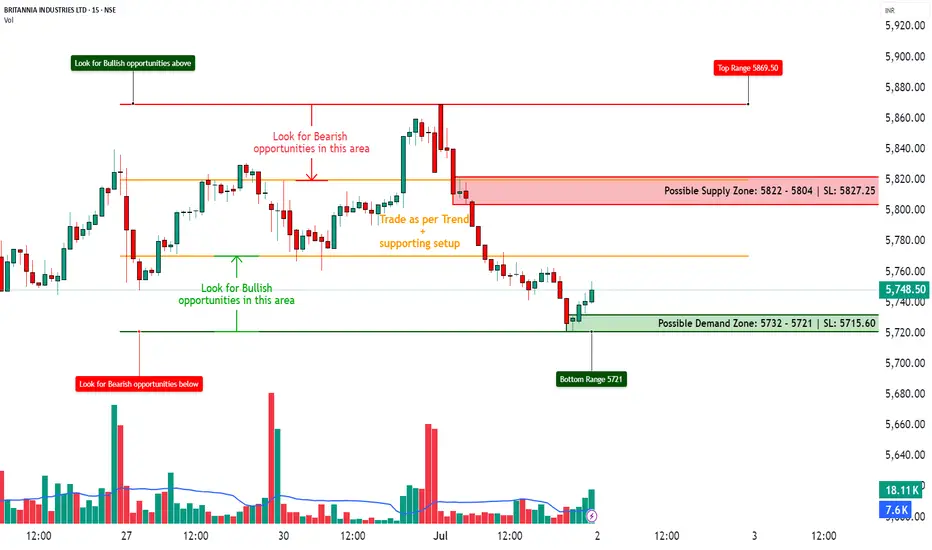
BRITANNIA INDUSTRIES LTD. – INTRADAY ZONE ANALYSIS📈 BRITANNIA INDUSTRIES LTD. – INTRADAY ZONE ANALYSIS
📆 Date: July 1, 2025 | ⏱ Timeframe: 15-Minute Chart
🔍 Educational Breakdown – For Learning & Study Use Only
________________________________________
🔹 Price Action Zones
🔴 Top Range (Resistance): ₹5869.50
🟢 Bottom Range (Support): ₹5721
⚪ Neutral Zone: Between ₹5732 – ₹5804 (No clear directional bias until breakout from either zone)
________________________________________
🧩 Chart Pattern: No
There’s no prominent chart pattern (e.g., flag, wed
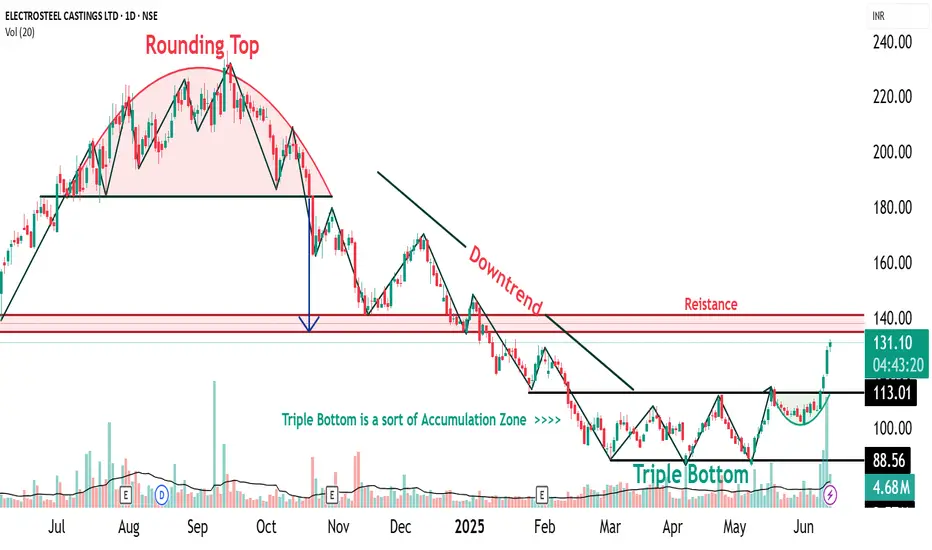
ELECTCAST Triple Bottom Pattern🔍 1. Understanding the Triple Bottom
The Triple Bottom is a classic bullish reversal pattern that typically forms after a prolonged downtrend or consolidation phase. It signifies strong buying interest at a consistent support level, leading to three distinct price lows (or “bottoms”) occurring near the same price zone.
📌 Key Characteristics:
Formation Time: Typically spans 2–6 months
Touchpoints: Three distinct lows formed at or near the same support level
Pattern Zone (for ELECTCAST):
Coforge-A perfect watchlist stock!Coforge is an IT services company providing end-to-end software solutions and services and is among the top-20 Indian software exporters according to Screener data. Stock has give 20% compounded sales growth in last 5 years which is quite remarkable.
Hence, It can be a good stock to be kept in watchlist for medium to long term.
Stock had given breakout of cup and handle pattern in weekly time frame and is now retesting the same.
Stock has formed a kind of morning star pattern at the retest supp
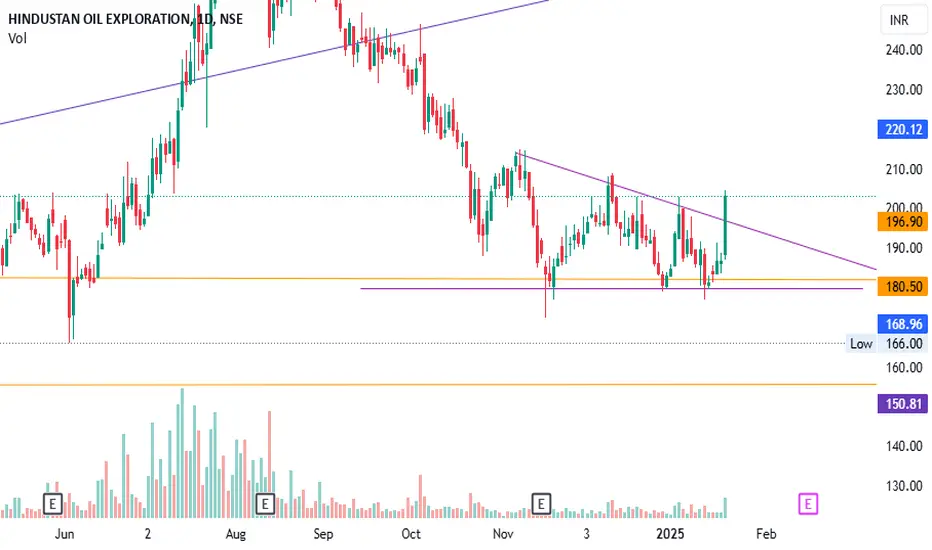
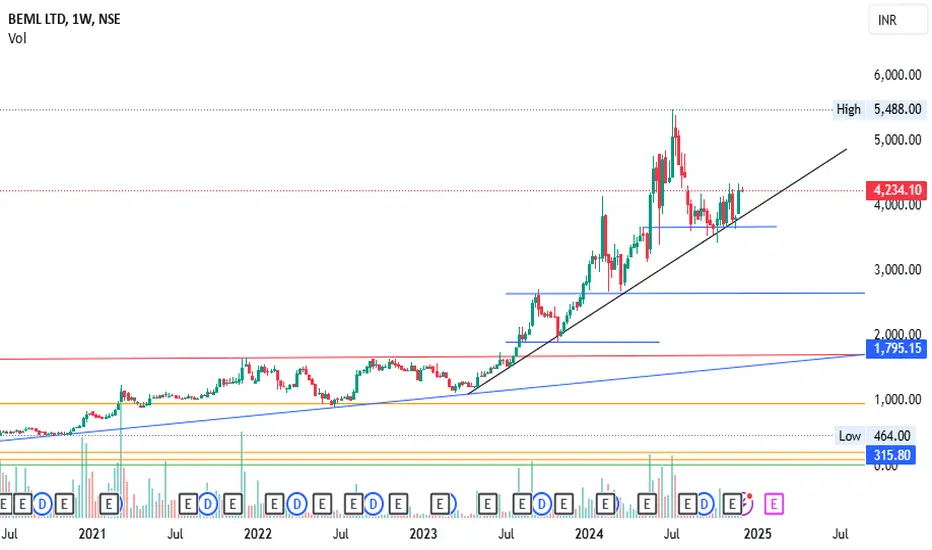
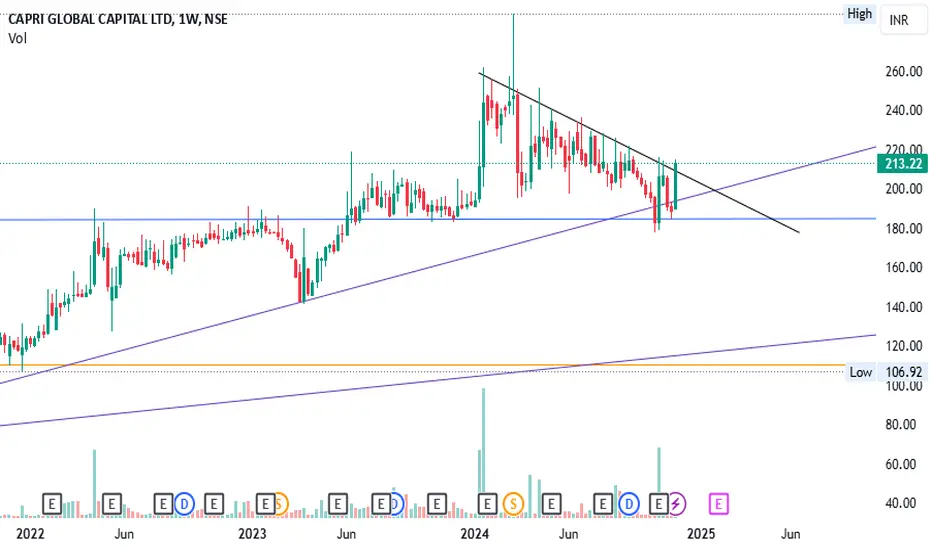
HINDOILEXP - Triangle Breakout A short triangle pattern has been forming since October 2024, and today it broke out decisively with a strong bullish engulfing candle on the daily timeframe. Additionally, a morning star candlestick pattern is evident on the weekly timeframe, reinforcing the bullish outlook.
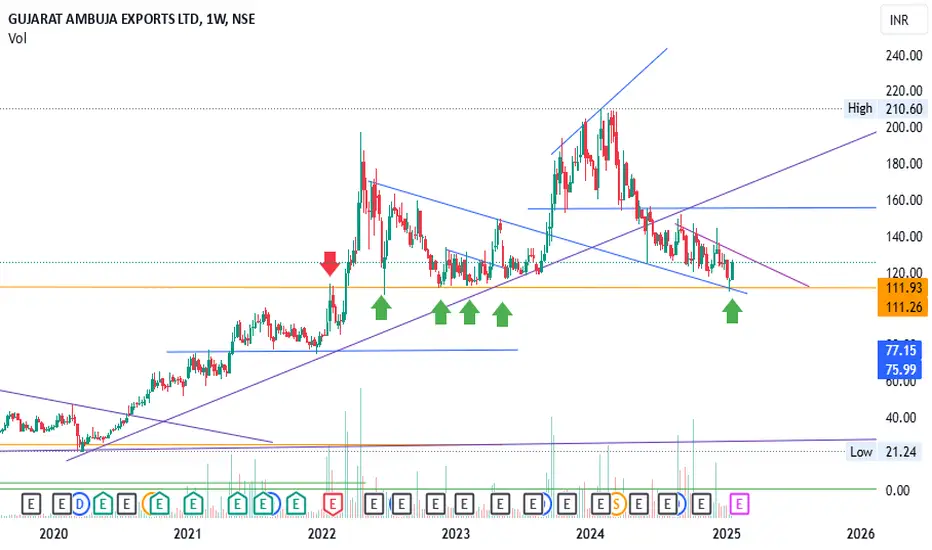
GAEL - Price near Major Support lineThe price has been consolidating since 2022 and is currently trading near a key support level around the 110 range. Previous pullbacks near this support level, as indicated by the green arrows, have shown significant reversals. Currently, a morning star candlestick pattern is forming near the support zone, suggesting potential bullish momentum. However, confirmation of the pullback will require waiting until this weekend's close.
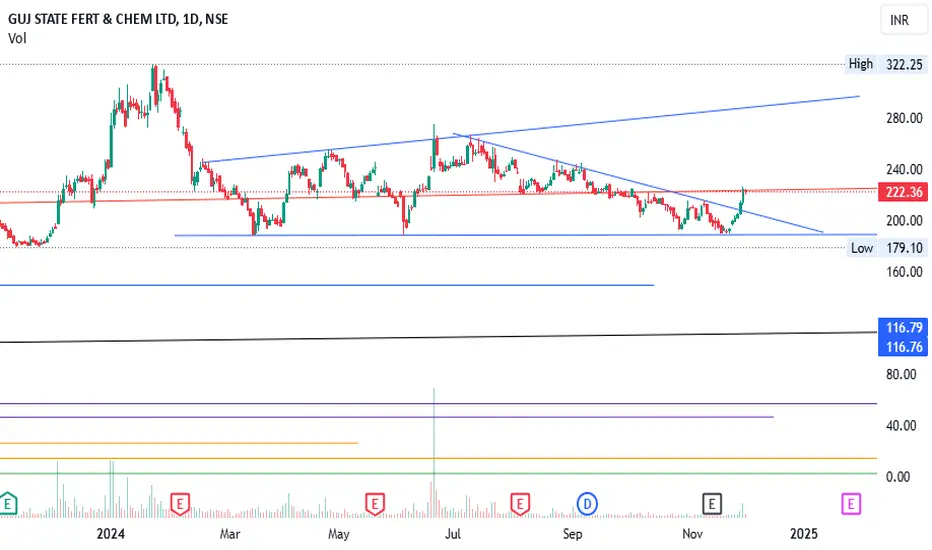
GSFC - Trendline breakout and Good Morning star candle formationThe price has been consolidating since March 2024, respecting the 188 range on the daily timeframe. Last week, it broke out of the trendline within the wedge. On the weekly timeframe, the candlestick formation resembles a morning star, which is a positive signal. We can expect the price to reach the resistance line of the wedge, around 288 INR. This setup is suitable for swing trading.
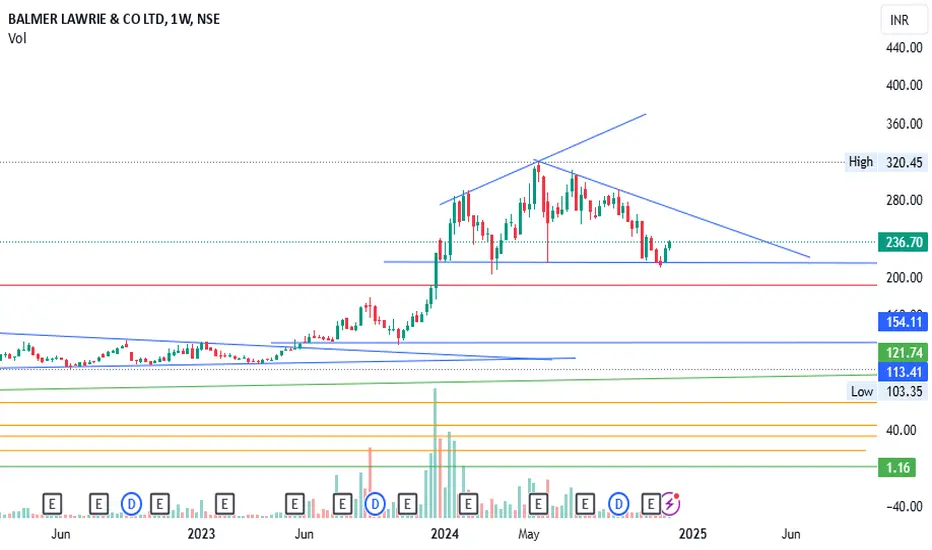
BALMLAWRIE - Wedge formation and Morning starThe price has been consolidating since January 2024, forming a wedge pattern. Recently, a morning star candlestick formation has appeared, which could be considered as a potential signal. However, it might be better to wait for a trendline breakout for additional confirmation.
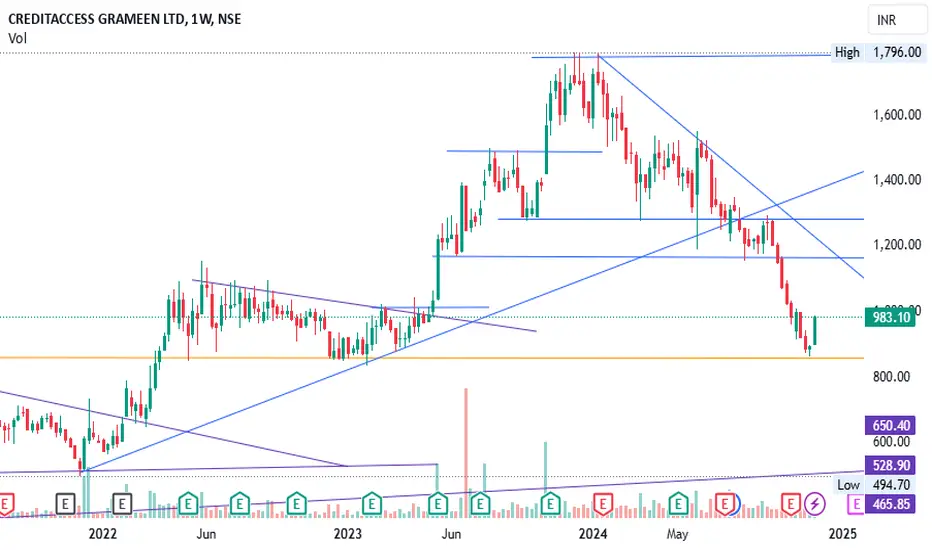
CREDITACC- Price at support line forming Morning StarThe 850 range has been a significant support level for this stock since 2020. After a decline from its all-time high of 1750 to the 850 range, the price is now forming a Morning Star pattern on the weekly timeframe. An entry opportunity is available only on Friday if the green candle formation is good without long wick, with a stop-loss placed below the hammer candle.