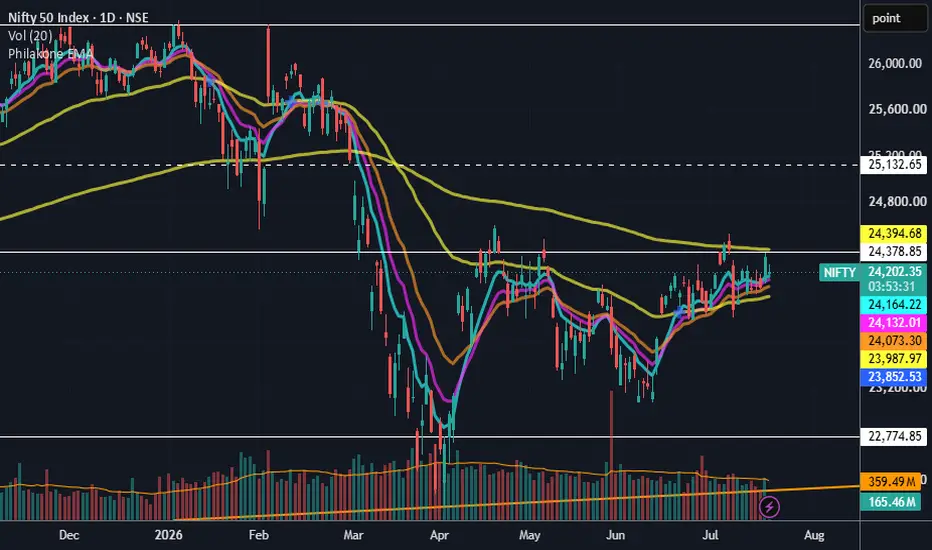
Nifty 50 Weekly Outlook: Support Broken, Watching the Next MoveOverview
Nifty had a rough week, falling 2.33% and closing at 23,767.45. This breaks a support zone that had held for weeks, so the story going into this coming week is different from before — we're now watching whether this becomes a deeper pullback or just a shakeout before recovery.
What's Happened
The trendline support and horizontal support zone (around 23,817) that had held multiple times finally gave way this week. Price is now sitting below both, at 23,767.45. This is a genuine shift — support that was reliable for a while has now broken.
Key Levels for the Week Ahead
Immediate Zone to Watch: 23,606–23,767 (this week's range)
Next Support Level: 23,070 (Major Support)
Resistance Above: 24,353 (50 Weekly EMA), then 24,601–24,989 further up
Bigger Support Below: 22,233 (200 Weekly EMA) — still a good distance away
Two Ways This Week Could Go
If price stabilizes and holds above 23,606: This would suggest last week's fall was a shakeout rather than the start of a bigger decline, and a recovery attempt back toward 24,000+ becomes possible.
If price breaks below 23,606: This would confirm more weakness, with 23,070 (Major Support) as the next real level to watch. A break below that too would then bring the 200 Weekly EMA (22,233) into focus.
What We're Watching Closely
The first couple of sessions this week matter a lot. A quick recovery back above the broken support (23,817) would be a good sign buyers are stepping back in. A continued slide, especially with more red weekly candles, would confirm the breakdown is real.
Beginner's Lesson
When a well-tested support level finally breaks, it doesn't automatically mean disaster — but it does mean the balance of power has shifted, at least for now. The right response isn't to panic or assume the worst, but to watch closely for the next few sessions and let price tell you whether this is temporary or the start of something bigger.
Conclusion
Nifty enters this week at an important decision point after breaking a key support zone. As always, we're watching for confirmation rather than assuming either direction. We'll keep tracking this and post updates as the week develops.
For educational purposes only. Not financial advice. Always manage your risk. NIFTY: Trendline Support Holds — Can Buyers Reclaim 24,050 ?Overview
NIFTY found support near the rising trendline once again, keeping the broader structure intact for now. However, price is still trading below the short-term moving averages, suggesting buyers need further confirmation before momentum can improve.
The next session is likely to revolve around whether the index can reclaim the nearby resistance cluster.
Key Levels
🟢 Support
23,817 – Immediate support
23,606 – Trendline support
23,070 – Major structural support
🔴 Resistance
23,980 – 50 EMA
24,370 – 200 EMA
24,041–24,053 – Daily Balance Zone / Weekly Rolling VWAP
24,050 – 15-minute Weekly Rolling VWAP
24,602 – Higher resistance
What to Watch Tomorrow
🟢 Bullish Scenario
If buyers continue defending the trendline and reclaim the 24,041–24,053 resistance area with acceptance, the market may attempt to retest the 50 EMA (23,980) and later the 200 EMA (24,370). A sustained move above these levels would strengthen the short-term structure.
🔴 Bearish Scenario
If price loses 23,817, attention shifts to the trendline support near 23,606. A break below this area would expose the next major support around 23,070.
Market Structure
The rising trendline remains an important reference. As long as it holds, buyers still have an opportunity to rebuild momentum. The key question for the next session is whether price can reclaim the nearby resistance cluster or continue respecting it as supply.
Educational market structure discussion only. Not investment advice. NIFTY: Trendline Holds — Eyes on the 200 EMAOverview
NIFTY respected the rising trendline highlighted in the previous analysis and delivered a strong recovery, confirming that buyers continue to defend the higher-low structure. The rally has successfully reclaimed the 50 EMA and moved back above the 14-Day Rolling VWAP, but the index is now approaching the Daily 200 EMA, which aligns closely with the descending trendline.
This creates an important decision zone for the next session.
Key Levels
🟢 Support
24,070 – 14-Day Rolling VWAP
24,065 – Weekly Rolling VWAP (15-minute)
24,040 – Lower Balance Zone
23,817 – Immediate support
23,606 – Rising trendline support
🔴 Resistance
24,369 – Daily 200 EMA
Descending trendline
24,602 – Previous swing high
24,698 – Upper Balance Zone
What to Watch Tomorrow
🟢 Bullish Scenario
If buyers reclaim and sustain above the Daily 200 EMA (24,369), the breakout could open the path toward 24,602. Acceptance above this level would bring the Upper Balance Zone (24,698) into focus and further strengthen the short-term structure.
🔴 Bearish Scenario
If sellers defend the 200 EMA and the descending trendline, watch the 24,070–24,040 support cluster closely. This area combines the 14-Day Rolling VWAP, Weekly Rolling VWAP, and the Lower Balance Zone. A loss of this zone could lead to a pullback toward 23,817, while a break below that would shift attention back to the rising trendline near 23,606.
Market Structure
The previous analysis correctly identified the rising trendline as the key support, and today's session confirmed its importance. The short-term structure has improved with the recovery above the 50 EMA and the 14-Day Rolling VWAP, but the Daily 200 EMA and the descending trendline remain the next major hurdles. Tomorrow's reaction around this resistance cluster is likely to determine whether the recovery extends or pauses.
Educational market structure discussion only. Not investment advice. BSE Ltd — Bouncing from 0.786 Fib Support, Fresh Bullish SetupOverview
BSE closed today at 3,596.1, up 4.02%, a strong bounce after finding support near the 0.786 Fib level (3,334.6) that we flagged as the next zone to watch in our last update. This bounce has brought price back up toward the falling wedge's upper trendline, and it's worth tracking as a fresh setup.
Follow-up Context
In our earlier post, we noted the 0.618 Fib + wedge zone (3,570–3,610) had failed to hold, and price fell through to the 0.786 Fib level. That level has now given the bounce we were watching for, with today's strong green candle confirming buyer interest at this support.
Pattern Explanation
Price has been falling in a wedge shape since the May high of 4,446.8, with both trendlines sloping down but converging. A falling wedge, like this one, is generally a bullish reversal pattern once broken decisively to the upside. Price is now testing the wedge's upper boundary again after bouncing off deep Fib support, an important test to confirm whether this bounce has real strength behind it.
Today's bounce also came on strong volume, 6.34M shares traded versus the 20-day average of 2.94M, roughly double the usual activity. That kind of volume pickup on a reversal day suggests real buying interest stepped in at this support zone, rather than just a quiet drift higher.
Trade Setup
Entry: Buy on strength above 3,600, ideally with confirmation of a close above the wedge's upper trendline
Stop Loss / Invalidation: 3,334 (below the 0.786 Fib support, would negate this bullish setup)
Target 1: 3,739 (0.5 Fib)
Target 2: 3,906 (0.382 Fib)
Key Levels
Support (Invalidation): 3,334.6 (0.786 Fib)
Wedge Resistance: ~3,600–3,650
Target 1: 3,739
Target 2: 3,906
50 EMA: 3,684.8
200 EMA: 3,261.0
Beginner's Lesson
After a sharp fall, the first bounce off a deep support level doesn't automatically mean the downtrend is over. What matters is whether the bounce can clear the resistance zone above it (here, the wedge's upper trendline) with real strength. Volume helps here too, a bounce on strong volume, like today's, carries more weight than one on light, half-hearted buying. If the bounce fails and price falls back below the recent support, it was likely just a pause within the bigger downtrend, not a reversal.
Conclusion
BSE is showing a strong, volume-backed bounce off the 0.786 Fib support and is now testing the falling wedge's upper boundary. A clean close above this zone would support further upside toward 3,739 and 3,906. A slip back below 3,334 would invalidate this bullish setup.
This is for educational purposes only and not investment advice. Please do your own research or consult a financial advisor before making any trading decisions.  Long
Long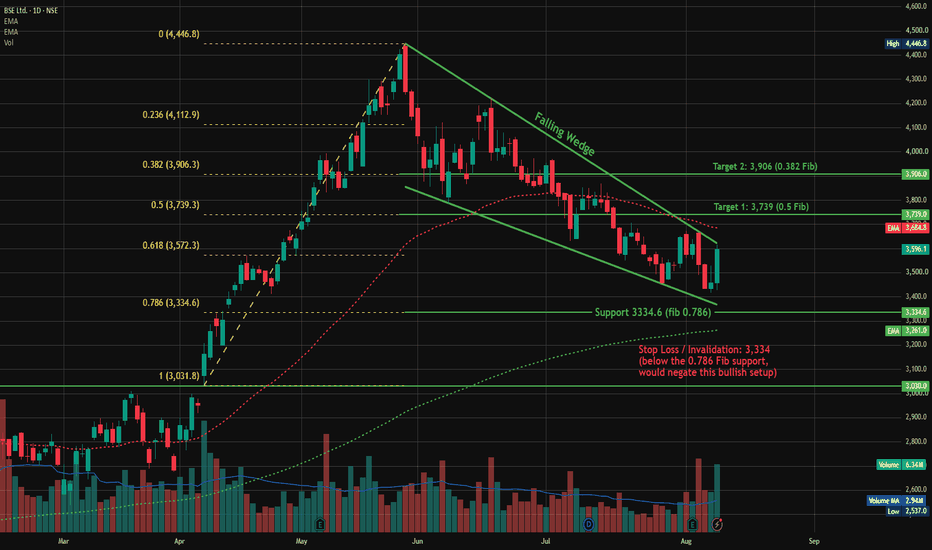
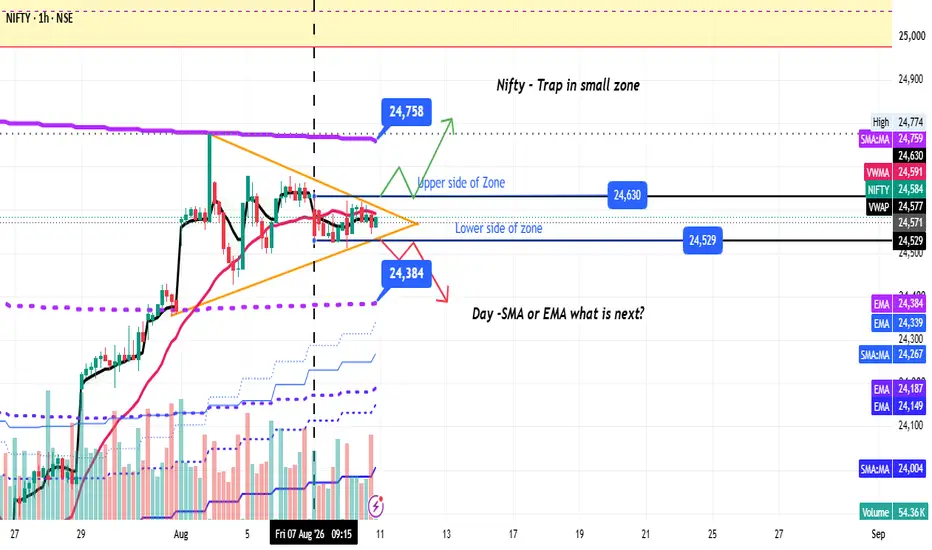
Nifty at key levels : Waiting for the breakout or breakdown Today's Monday session is over, and Nifty remained trapped in a range. My view is simple: wait for the no-trade zone to break before taking any position.
✅ Above 24,630 and a successful retest, I will look for long opportunities.
✅ Below 24,529, I will look for short opportunities.
Keep in mind that tomorrow is expiry day, so risk management is very important. Trade only if the risk-to-reward ratio is favorable. Otherwise, waiting for a clear direction may be the better option.
This is an important zone because:
200 SMA is acting as a key target/resistance area for the bullish side.
200 EMA is acting as an important support area for the bearish side.
Once this range breaks, Nifty could make a fast move. However, there's also a possibility of another sideways expiry, often called a "seller's expiry."
For now, patience is the strategy. Let the market show its direction first.
What are your views? Do you expect a breakout, breakdown, or another sideways expiry? Let's learn together. 📊😊
Disclaimer:
This is only my personal technical observation shared for learning and discussion purposes. It is not financial advice. Please do your own research and consult a financial expert before taking any trade. If my analysis is wrong, I'll treat it as a learning opportunity and improve my understanding of the market. TATA CHEMICALS — Falling Wedge Nearing Resolution, Bullish SetupOverview
Tata Chemicals closed Friday's session at 673.55, up 1.55%, right near the support of a falling wedge that has formed since the stock topped out at 854.85 in April. Falling wedges are typically bullish patterns, and price testing the lower boundary here is worth watching closely as we head into the new week.
Pattern Explanation
Since the April high, the stock has been making lower highs and lower lows, but within two converging trendlines, a steeper falling resistance and a shallower falling support. This is the classic falling wedge shape. Price is now testing the wedge support for the first time in a while, right where buyers have previously stepped in.
Trade Setup
Entry: Buy near current levels (673-676), on strength above wedge support
Stop Loss / Invalidation: 656
Target 1: 701 (near the wedge's upper trendline and 50 EMA zone)
Target 2: 751 (near the 200 EMA)
Key Levels
Wedge Support: ~660-670
Target 1: 701
Target 2: 751
Invalidation: 656
Beginner's Lesson
A falling wedge is a pattern where price keeps making lower highs and lower lows, but the two trendlines are converging, meaning the pace of the decline is slowing down. This often signals that sellers are running out of strength. Once price breaks above the wedge's upper trendline with conviction, it's usually seen as a bullish signal. Watching how price behaves right at the wedge support, like Friday's close, is key: a bounce here with strength adds confidence to the setup.
Conclusion
Tata Chemicals enters the new week at a decision point inside a falling wedge. A bounce from current levels with strength would support the bullish case toward 701 and eventually 751. A close below 656 would invalidate this setup.
This is for educational purposes only and not investment advice. Please do your own research or consult a financial advisor before making any trading decisions.  Long
Long
Breaks Above 200 SMA Early sings of strong uptrendsWhat I'm Seeing
Imagine a student who keeps trying to pass an important exam but falls short every time.
Then one day, the student finally clears it with confidence.
I think M&M (Mahindra & Mahindra) is showing something similar on the chart.
The stock has successfully closed above its 200-day SMA (Simple Moving Average). This is an important level that many traders and investors watch to understand the long-term trend.
A close above this level often suggests that buyers are becoming stronger and may be preparing for a larger move.
Why It Matters
What is the 200 SMA?
The 200-day SMA is the average closing price of the last 200 trading days.
Think of it as a long-term report card of the stock.
Price above the 200 SMA = Long-term strength.
Price below the 200 SMA = Long-term weakness.
Right now, M&M has managed to move and close above this important level, which is a positive sign.
What is MACD?
MACD (Moving Average Convergence Divergence) is a momentum indicator.
In simple words, it helps traders understand whether buyers or sellers are gaining strength.
On the daily time frame, the MACD is also showing bullish signals, suggesting that buying momentum is increasing.
When both: ✅ Price moves above the 200 SMA
✅ MACD turns bullish
it often catches the attention of many traders.
My Current View
Step 1
M&M has closed above the 200 SMA.
Step 2
The daily MACD is supporting the bullish view.
Step 3
As long as the stock remains above the 200 SMA, buyers may continue to stay in control.
Step 4
If momentum continues, the stock could make a quicker move toward higher levels over the coming weeks.
What I Expect Next
My simple expectation is:
➡️ Bullish above the 200 SMA.
➡️ MACD momentum supports the upside.
➡️ Any pullback that holds above the 200 SMA could attract fresh buyers.
➡️ The coming weeks may see a stronger upward move if buyers remain active.
For now, I am watching price action closely and letting the chart guide my decisions rather than predicting the future.
Final Thought
A stock moving above its 200-day SMA is like a train finally leaving the station after waiting for a long time. The journey may not be smooth every day, but the current signals suggest that buyers could have the advantage.
What are your thoughts? Do you see the same bullish setup, or is there something I might be missing? Let's learn together. 🚀📊
Disclaimer:
This is only my personal technical observation shared for learning and discussion purposes. It is not financial advice. Please do your own research and consult a qualified financial expert before making any investment or trading decisions. If my analysis is wrong, I will learn from the market and gain more experience.  Long
Long
Bull Run Pause or Trend Reversal? Nifty Near Key Moving AveragesWhat I'm Seeing
Imagine a person who has been running fast for a long distance. After some time, they need to slow down, catch their breath, and regain energy before deciding whether to continue running.
I think Nifty is doing something similar right now.
After a strong rally of around 5%, Nifty has started slowing down. Instead of moving higher quickly, the market seems to be taking a small break before its next big move.
Why It Matters
I am watching two popular moving averages:
200 EMA (Exponential Moving Average)
Think of it as a dynamic support line that reacts faster to recent price changes.
Many traders watch it to identify the overall trend.
As long as Nifty stays above it, the longer-term trend remains healthy.
200 SMA (Simple Moving Average)
This is a slower-moving average that gives equal importance to all past prices.
It often acts as a strong resistance or support level.
Right now, Nifty is struggling to move strongly above this level.
This tells me that buyers are not fully in control at the moment.
My Current View
Step 1
On lower time frames, I prefer to look for selling opportunities while the market remains weak.
Step 2
If Nifty continues to fall, I will watch the 200 EMA closely.
Step 3
When price reaches the 200 EMA, I will not rush into a trade.
First, I want to see how the market reacts.
Step 4
If buyers step in and the price shows strength, I may look for buying opportunities.
If support breaks, the market could move lower.
What I Expect Next
My expectation is simple:
➡️ Short-term: Market may remain weak or move sideways.
➡️ Key Zone: 200 EMA support area.
➡️ Bullish Signal: Strong buying reaction from that support.
➡️ Bearish Signal: Clean break below support.
For now, I am focusing on what the chart is telling me rather than predicting the future.
Remember: The market is the best teacher. If my view is right, I learn. If my view is wrong, I learn even more. Let's discuss and learn together. 📈😊
Disclaimer:
This is only my personal technical observation shared for learning and discussion. It is not financial advice. Please do your own research and consult a financial expert before taking any trade. If my analysis turns out to be wrong, I will learn from it and improve my understanding of the market.  Short
Short
HEROMOTOCO — Falling Wedge Resistance Holds at the 50 EMAOverview
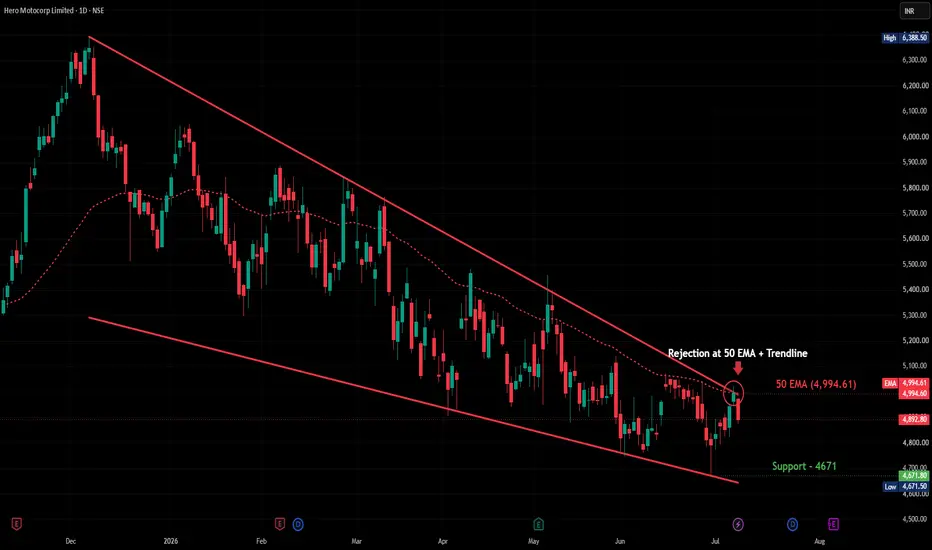
Hero MotoCorp attempted to break above its falling wedge resistance today, touching a high of 4,975 before reversing sharply to close down 2.05% at 4,892.80. Notably, this rejection occurred right at the 50 EMA (4,994.61), which has been tracking closely with the wedge's upper boundary — a double layer of resistance that proved difficult to clear on the first attempt.
Pattern Explanation
The stock has been compressing inside a falling wedge since the December high of 6,388.50, with the upper resistance trendline and the 50 EMA converging in the same zone through recent sessions. This kind of confluence — a structural trendline lining up with a widely-watched moving average — often makes for a tougher resistance to clear cleanly, and today's rejection candle reflects exactly that dynamic. Sellers stepped in decisively at this zone rather than letting price consolidate above it.
Key Levels
Resistance (Wedge Trendline + 50 EMA Confluence): 4,975–5,000
Support (Wedge Lower Boundary): tracking near 4,750–4,800 currently
Prior Swing Support: 4,671.50
Scenarios
If support holds: A pullback that stabilizes above the wedge's rising support line and the recent low near 4,671 keeps the pattern intact, setting up a possible second attempt at the 50 EMA and resistance trendline later.
If support breaks: A sustained close below the wedge's lower boundary would suggest sellers are back in control, with the pattern breaking down rather than resolving bullishly.
Beginner's Lesson
When a trendline and a moving average line up in the same price zone, it often creates a stronger resistance than either would on its own — this is called confluence. A single rejection at such a zone isn't necessarily bearish for the bigger picture, but it does tell you buyers need to work harder to clear it. Watching whether the stock holds its rising support on this pullback will say a lot about whether the next attempt has a better chance.
Conclusion
Hero MotoCorp's rejection at the 50 EMA and wedge resistance keeps the stock range-bound for now. Worth tracking how the pullback behaves relative to the wedge's support line before expecting another test of resistance. As always, wait for confirmation before drawing conclusions.
Not investment advice. For educational purposes only. Please consult your financial advisor before making any trading decisions. BHARTIARTL — Descending Triangle Testing Breakout on Daily ChartOverview
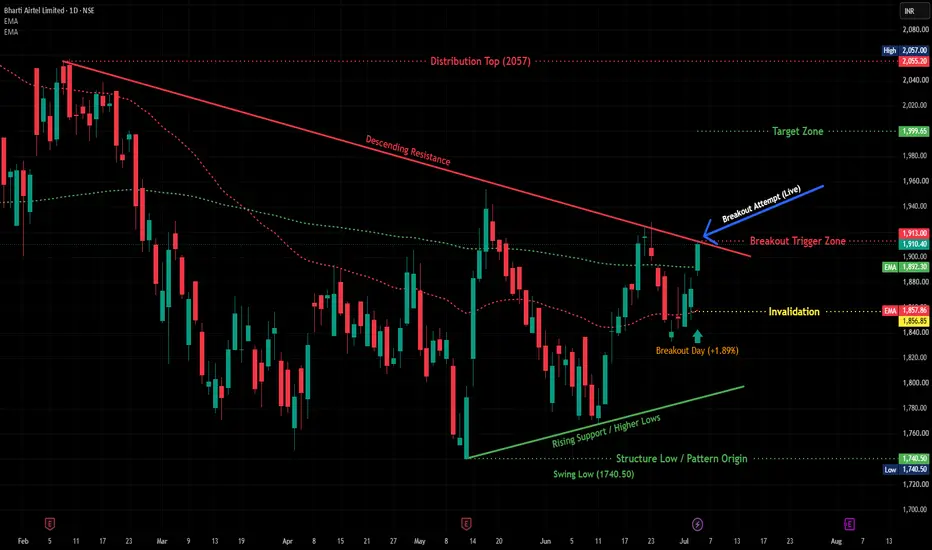
Bharti Airtel has spent the last five months carving out a textbook descending triangle on the daily chart, and today's session is where it starts getting interesting. Price rallied 1.89% off a strong base, pushing right into the resistance line that's been capping every rally since February. If this holds, we could be looking at the start of a fresh leg higher after months of range-bound grinding.
Pattern Explanation
The structure here is clean: a descending resistance line connecting the February high (2057) down through a series of lower highs, meeting a rising support line built off higher lows since the May bottom (1740.50). That's a classic descending triangle — lower highs compressing into a flat-ish floor, which usually resolves in the direction of the prevailing higher-low structure once broken.
Today's candle closed right at the confluence of that resistance line and the 1910-1913 zone, which has acted as a pivot multiple times since June. This is the first real test of the trendline with strong volume and price momentum behind it, not just a wick poking through.
Key Levels
Breakout Trigger Zone: 1910–1913
Invalidation: 1856.85 (below recent swing structure)
Target Zone: 1999.65
Structure Low / Pattern Origin: 1740.50
Distribution Top: 2057
Risk-to-reward from current levels works out to roughly 1:1.7, which is a reasonable setup for anyone tracking this on the daily timeframe.
Scenarios
Bullish scenario: A daily close above 1913 with follow-through volume opens the door toward 1980, and eventually the 1999–2000 target zone. Watch how price behaves around the 1940-1960 area — that's where the 200 EMA region previously acted as resistance during the March-April decline, so some hesitation there wouldn't be surprising.
Bearish scenario: If price fails to hold above 1910 and slips back under the rising support line (currently tracking near 1885-1890), the triangle thesis weakens and a retest of 1856-1860 becomes likely. A break below 1856.85 would invalidate the setup entirely and put the May-June range lows back in play.
Beginner's Lesson
A descending triangle is one of the more reliable continuation/reversal patterns to learn because it tells you two things at once: sellers are getting weaker (lower highs, but shallower each time) while buyers are getting stronger (higher lows). When those two lines converge, it's usually a sign that a decisive move is close. The key skill isn't spotting the pattern — it's waiting for the actual break with volume, rather than jumping in on the first touch of the resistance line. Airtel gave several false pokes at this trendline back in May and June that faded; today's move has more conviction behind it, which is what separates a real breakout attempt from noise.
Conclusion
Bharti Airtel is at a genuine decision point after months of consolidation. The structure is clean, the levels are well-defined, and today's price action gives the bulls their strongest case yet. As always, this is for educational and analytical purposes — confirm with your own risk management and position sizing before acting, and keep an eye on the 1910-1913 zone over the next couple of sessions to see if this breakout has legs.
Not investment advice. For educational purposes only. Please consult your financial advisor before making any trading decisions.  Long
Long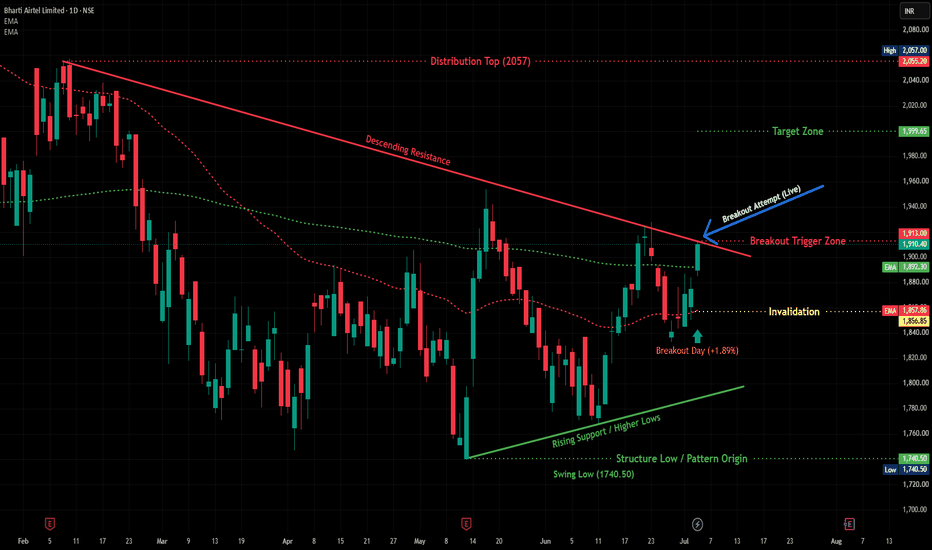
Asian Paints: Breakout or Rejection ?Asian Paints is India's largest paint manufacturer and one of the country's most respected consumer businesses. With a dominant market position, strong brand recognition, an extensive dealer network, and expansion into home décor through its Beautiful Homes business, the company has consistently demonstrated the characteristics of a long-term compounder.
After spending nearly two years in a corrective phase, the stock is once again approaching a major technical resistance. The key question now is: Is this the beginning of the next long-term uptrend, or just another rally within the correction?
Let's analyze both the chart and the business.
Technical Structure: Understanding the Pattern
Following its all-time high near ₹3,395, Asian Paints entered a prolonged correction, forming a clear descending resistance line on the weekly chart.
Over the past few months, however, the character of the price action has started to improve.
Buyers are defending higher levels.
The stock has reclaimed its long-term 200 EMA.
Higher lows are beginning to form.
Price is now approaching the long-term trendline resistance once again.
This creates an important decision zone where buyers and sellers are likely to battle for control.
Technical View
Current Trend
✅ Trading above the Weekly 200 EMA
✅ Higher High & Higher Low structure developing
✅ Testing long-term descending resistance
Breakout Trigger
A weekly close above ₹2,831 would be the first indication that buyers are gaining strength.
A sustained move above the ₹2,918–₹2,988 resistance zone would confirm a larger breakout and significantly strengthen the bullish structure.
Invalidation Level
The bullish view weakens if price loses the 200 EMA near ₹2,640 and starts making lower lows.
Pattern Origin
The current pattern originates from the September 2024 all-time high around ₹3,395, where the long corrective phase began.
Long-Term Resistance Levels
₹2,831 – Initial breakout level
₹2,918 – Major resistance
₹2,988 – Final resistance before previous highs
Long-Term Reference
All-Time High: ₹3,395
Possible Scenarios
🟢 Bullish Scenario
A weekly breakout above ₹2,831, followed by sustained buying above ₹2,918, would indicate improving momentum. If buyers successfully absorb supply in this zone, the market may gradually shift its focus toward the previous all-time high.
🟡 Neutral Scenario
The stock continues consolidating below resistance while holding above the 200 EMA. This would simply extend the current base-building phase until a decisive move occurs.
🔴 Bearish Scenario
If the stock fails to hold the 200 EMA and begins making lower lows, the current bullish structure would weaken, suggesting that sellers have regained control.
Fundamental Snapshot
(Financial data referenced from publicly available information on Screener.in. Investors should verify the latest quarterly and annual reports before making investment decisions.)
While the chart is approaching an important resistance, the business itself continues to display several characteristics of a high-quality company.
What Stands Out
✅ Revenue and earnings have started recovering after a slower growth phase.
✅ Operating margins have remained remarkably consistent around 18–21%, reflecting strong pricing power.
✅ Operating Cash Flow reached ₹7,088 Cr in FY26, comfortably exceeding reported net profit, indicating healthy earnings quality.
✅ Free Cash Flow remains strong, providing flexibility for expansion, dividends, and future investments.
✅ Manufacturing capacity has expanded, while businesses such as Beautiful Homes continue to grow, diversifying revenue beyond decorative paints.
Things Worth Monitoring
Borrowings increased during FY26 and should be watched over the coming years.
ROCE remains healthy but has moderated from earlier peak levels.
Increasing competition within the paint industry could keep margins under pressure.
None of these currently appear to change the long-term business quality, but they remain important factors to monitor.
Beginner's Takeaway
One of the biggest mistakes beginners make is focusing only on the chart or only on the company's financials.
A stronger investment process combines both.
Look for:
Strong business fundamentals
Healthy cash generation
Consistent profitability
A favorable technical structure
When business quality and price action begin aligning, the probability of a successful long-term investment generally improves.
Conclusion
Asian Paints remains one of India's highest-quality consumer businesses. Although growth has moderated compared to previous years, the company continues to generate strong cash flows, maintain healthy margins, and invest for future growth.
From a technical perspective, the stock is approaching one of its most important resistance zones in nearly two years. A confirmed breakout above this region could mark the beginning of the next long-term trend, while failure to break above it would keep the current consolidation intact.
As always, patience and confirmation are more valuable than anticipation.
Disclaimer
This analysis is shared solely for educational purposes to demonstrate how technical chart analysis can be combined with publicly available financial information. Financial figures are referenced from Screener.in and company filings. This is not a buy or sell recommendation. Please conduct your own research and consider your risk tolerance before making any investment decisions. DIFFNKG: Multi-Month Cup & Handle Near CompletionAfter spending nearly a year building a broad accumulation base, Diffusion Engineers Ltd. ( NSE:DIFFNKG ) appears to be approaching a decisive technical inflection point.
The chart shows a well-defined Cup & Handle structure, where the rounded base reflects gradual accumulation and the recent shallow pullback forms a constructive handle rather than a sign of distribution. During the handle, price remained above key moving averages while volume cooled, indicating a healthy pause after the previous advance.
⭐ Key Observations
> Multi-month Cup & Handle pattern nearing confirmation.
> Price is trading above all major EMAs (20 > 50 > 100 > 200), reflecting a strong bullish trend.
> The handle formed with controlled selling pressure and constructive price behavior.
> RSI has turned higher without showing a meaningful bearish divergence, supporting improving momentum.
> Immediate resistance lies near ₹436, which represents the neckline of the pattern as well as a previous supply zone.
> A strong daily close above ₹436, preferably supported by above-average volume, would confirm the breakout and increase the probability of continuation toward higher levels.
🎯 Potential Outlook
> If buyers successfully absorb the remaining overhead supply and price sustains above ₹436, the stock may enter the next expansion phase. The measured move from the Cup & Handle projects an ambitious long-term objective, while intermediate resistance zones should still be respected for prudent risk management.
❌ Invalidation
Failure to close above ₹436 may result in additional consolidation within the handle .
A sustained break below the ₹394 support zone would weaken the current bullish structure and delay the breakout setup.
--------------------------------------------------------------------------------------------------------------------
Disclaimer
This publication is shared solely for educational and informational purposes and reflects my personal interpretation of price action and chart structure. I am not a SEBI-registered research analyst or investment advisor. This is not financial or investment advice. Please conduct your own research and consult a qualified financial advisor before making any investment or trading decisions.  Long
Long
BAJAJ FINANCE: Fresh All-Time High BreakoutOverview
Bajaj Finance has broken out to a fresh all-time high today, closing at 1,141.2, up 8.32% in a single session on strong volume. This is a big breakout candle after weeks of steady grinding higher, and the stock is now trading in uncharted territory with no historical resistance above.
Pattern Explanation
If we look at the chart, the stock spent March to June building a base, then started a clean uptrend from June onwards, staying above both the 50 EMA and 200 EMA the whole way up. Today's candle broke clean above the previous swing high with a big green breakout candle, taking it to a new all-time high.
What makes this breakout even more convincing is the volume. Today's candle traded 40.81M shares, way above the recent average of 9.94M. High volume on a breakout day tells us this isn't just a random spike, there's real buying interest behind the move.
Since this is uncharted territory, we're using a rising trendline (connecting recent swing highs) along with recent swing levels to plan our zones.
Key Levels
Immediate Support: 1,102
Invalidation Level: 1,074 (a close below this would question the breakout)
EMA Support: 50 EMA at 999.80, 200 EMA at 956.04 (deeper support if pullback extends)
Scenarios
If Bajaj Finance holds above the 1,102–1,074 zone on any pullback, we can expect the trend to continue higher, with the stock making fresh highs step by step.
If the stock closes below 1,074, it would invalidate this breakout structure, and we may see a deeper correction back towards the 50 EMA.
Beginner's Lesson
When a stock hits an all-time high, there's no old resistance above it to worry about, every previous seller has already been proven wrong. That's why breakouts to new highs can move fast. But it also means we don't have historical price levels to rely on, so traders use tools like recent swing points and trendlines to plan supports and targets.
Volume is like a lie detector for price moves. A breakout on low volume can often fail or get reversed, but a breakout on high volume, like we see here, usually has more strength behind it and better odds of continuing.
Conclusion
Bajaj Finance is in a strong all-time-high breakout structure, backed by a clear volume surge. As long as it holds above 1,074, the path of least resistance remains up. A close below that level would be the first sign of caution.
This is for educational purposes only and not investment advice. Please do your own research or consult a financial advisor before making any trading decisions.  Long
Long
NIFTY –Holding Above Trendline,Eyes on the Descending ResistanceOverview
Nifty closed the week at 24,383.60, up 616 points or 2.59%. The index made a strong move this week, closing well above last week's high and staying above the weekly 50 EMA at 24,354.78. Price is now sitting right at the descending resistance line that has been capping every rally since February.
Pattern Explanation
If we look at the chart, Nifty has been respecting a rising trendline since late March, with each dip getting bought around that line. A couple of weeks back, we saw a clear bounce off this trendline support near 23,817, and since then the index has been climbing steadily with mostly green weekly candles.
At the same time, there's a falling trendline connecting the highs from February. This is the resistance we're watching closely right now. Nifty has tested this line multiple times over the last few weeks without a clean breakout.
Key Levels
Resistance 1: 24,601.70
Resistance 2 (falling trendline + horizontal): 24,989.35
Support 1: 23,817.80
Major Support: 23,070.15
Weekly 50 EMA: 24,354.78 (acting as support this week)
Weekly 200 EMA: 22,255.32 (far below, confirms long-term uptrend intact)
Scenarios
If Nifty closes above 24,989, it would confirm a breakout from the falling trendline, and we could see a move towards fresh highs.
If Nifty fails here and slips back below 24,354 (the 50 EMA), we may see another test of the rising trendline support near 23,800–23,900 before any further upside attempt.
Beginner's Lesson
A rising trendline connects higher lows and shows buyers are stepping in at progressively higher prices — that's a sign of strength. A falling trendline connects lower highs and shows sellers are capping every rally — that's resistance.
When a stock or index is sandwiched between one of each (like Nifty is right now), traders call it a "triangle" or "wedge" type setup. The breakout, whichever side it happens on, usually tells us the next big directional move. Until then, it's best to wait rather than guess.
Conclusion
Nifty is holding its rising trendline structure well, but the falling trendline resistance is the real test right now. A close above 24,989 would be the confirmation bulls are looking for. Until then, this remains a level-to-level market.
This is for educational purposes only and not investment advice. Please do your own research or consult a financial advisor before making any trading decisions. Cochin Shipyard: Multi-Year Support TestOverview
Cochin Shipyard is currently testing a long-term trendline support around 1,200–1,250, with the weekly 200 EMA sitting right in this zone too. Before treating this as a simple "buy the dip" opportunity, it's worth digging into the fundamentals — and the picture here is more cautious than it first appears.
What's Happening on the Chart
Price has pulled back sharply from its highs and is now testing a long-term rising trendline that's held since the stock's early years. The weekly 200 EMA (around 1,252) is right at this same zone, adding some technical weight to the level. That's the good part of the story.
What the Fundamentals Actually Show
This is where things get more nuanced. Looking at the last few years:
Revenue has kept growing — from ₹3,830 Cr (FY24) to ₹4,820 Cr (FY25) to ₹5,022 Cr (FY26) — but growth has slowed sharply, from +24% to just +4%
Net profit actually fell in FY26 — down to ₹717 Cr from ₹827 Cr the year before, even though revenue was still growing. That's a warning sign worth taking seriously
Operating margins have compressed — from 23% (FY24) down to 16% (FY26), continuing a multi-year decline rather than a one-off dip
ROCE has weakened — from 21% to 16% over the past two years, meaning the business is generating less return on the capital it uses
Working capital cycle has stretched dramatically — the cash conversion cycle has gone from 54 days (FY21) to 250 days now, driven mainly by inventory sitting on the books far longer (379 days, up from 139 days). This usually points to slower project execution or delivery delays
Debt jumped sharply — borrowings rose from ₹560 Cr to ₹1,672 Cr in just one year, roughly 3x. That's a real shift in the balance sheet that wasn't there before
One Encouraging Sign
Looking quarter by quarter within FY26, there's been a recovering trend — sales have grown steadily each quarter (1,069 → 1,119 → 1,350 → 1,484 Cr), and operating margins improved too (7% → 14% → 21%). So while the full-year picture looks weaker than FY25, the most recent quarters suggest things may be stabilizing.
Key Levels to Watch
Trendline + 200 EMA Support: ~1,200–1,252
Weekly 50 EMA (Resistance): ~1,542
What This Means
If the support holds technically: That's worth noting, but given the fundamental picture, it shouldn't be treated as an automatic buy signal on its own.
If the recent quarterly recovery continues for another cycle or two — meaning sales and margins keep improving like they did through FY26 — that would be a meaningful sign the business is turning a corner. A sustained trend like that, over one or two more quarters, could be enough to bring long-term investors back with more confidence, since it would show the recent weakness was temporary rather than a structural problem.
If the fundamentals stay weak or get worse — continued margin pressure, rising debt, stretched working capital — then this support test becomes a much less attractive opportunity, regardless of what the chart shows.
Beginner's Lesson
A stock sitting at a well-known support level can look tempting, but the chart alone never tells the whole story. Here, the technical setup looks fine, but the business has shown real signs of strain over the past year — declining profit, falling capital efficiency, and rising debt. The smart approach isn't to ignore the support test, but to wait and see whether the recent quarterly recovery holds up over the next cycle or two before treating this as a genuine opportunity rather than a falling knife.
Conclusion
Cochin Shipyard is testing an important technical level, but the fundamentals call for patience rather than urgency. If the recent quarterly improvement continues for another cycle or two, this could become a much more attractive long-term case. Until then, this is one to watch closely rather than jump into.
Chart and financial data shown are for illustration and educational purposes only. Not investment advice. Please do your own research or consult a financial advisor before making any investment decisions. Fundamental data sourced from Screener.in  Long
Long
 Long
Long
 Long
Long
AZAD ENGINEERING – Bullish Consolidation Near All-Time HighAZAD Engineering continues to maintain a strong bullish structure on the daily chart. The stock is trading above its major moving averages, with the moving averages positively aligned.
After touching the recent high near ₹2,530, the stock is consolidating in a relatively tight range. This appears to be a healthy pause after the strong July rally rather than a major reversal.
Important levels:
Immediate breakout zone: ₹2,430–₹2,460
Major resistance / previous high: ₹2,530
First upside zone: ₹2,600–₹2,650
Extended upside level: ₹2,817
Immediate support: ₹2,300–₹2,320
Strong support: ₹2,240–₹2,270
Positional trend support: ₹2,180–₹2,200
The stock is currently in a WATCH / PREPARE stage. A sustained breakout above ₹2,460 can improve momentum, while a strong daily close above ₹2,530 may confirm the next leg of the uptrend.
A pullback towards ₹2,300–₹2,320, followed by a bullish reversal, may also provide a better risk-reward opportunity.
Avoid chasing a large gap-up or an extended candle above the breakout level.
Invalidation:
A daily close below ₹2,300 would weaken the present consolidation. A sustained breakdown below ₹2,240 may lead to a deeper correction.
Bias : Bullish above ₹2,300
Setup : High-level consolidation / continuation breakout
Status : Watch near breakout
Disclaimer : For educational purposes only. Please conduct your own analysis before taking any trade.  Long
Long
 Long
Long
NIFTY Weekly updateNIFTY50 traded in the tight range of 24,000-24,500 (EMA confluence levels) during the last week, before closing ~130 points higher compared to its previous week.
The FII selling has resumed in the markets, after a pause before week, amid the reignition of geopolitical tensions. Further, the raising oil prices and higher than expected CPI numbers gave no respite to the markets.
For the current week, I expect market to trade in the range of 24,000-24,400. On the upside, 25,100 will act as the first resistance level. On the downside, 23,800 can act as first support level and the previous swing low of 23,000 further.