BSE Ltd — Pulling Back Hard, Watching the 0.618 Fib + Wedge ZoneOverview
BSE has had a strong run since April, but today it's seeing a sharp fall (currently down 2.11%, trading around 3,607). This drop has brought price right into an important zone — where an old Fibonacci level and a wedge pattern are meeting. Let's break down what we're watching.
What's Happening
Price rallied hard from 3,031 all the way to a high of 4,446 in just a couple of months. That's a big move, so some pullback is normal. Since then, price has been falling in a wedge shape (marked in red), and today's fall has pushed it right down to the 0.618 Fib level around 3,572.
Right now, price is trading between its two EMAs — below the 50 EMA (3,800) but still above the 200 EMA (3,209). This tells us the bigger uptrend isn't broken, but the stock is definitely cooling off hard after its big run.
Key Levels to Watch
Zone to Watch: 3,570–3,610 (0.618 Fib + wedge support meeting here)
If this zone breaks: next level is 0.786 Fib at 3,334
If price bounces from here: first hurdle above is 0.5 Fib at 3,739, then 0.382 Fib at 3,906
Bigger picture support: 200 EMA around 3,209
Since the Market Is Still Open Today
This is based on where price is trading right now, not a closed candle. Since we're mid-session, wait for the close today (or even a session or two more) before treating this zone as confirmed support or a broken level.
Two Ways This Can Go
If the zone holds: A bounce from here, especially with a strong green candle, would be a good sign buyers are stepping back in. Watch for price to reclaim 3,739 next.
If the zone breaks: A close well below 3,570 today or tomorrow would mean sellers are still in control, and 3,334 becomes the next zone to watch.
Beginner's Lesson
When a stock falls sharply after a big rally, it's easy to panic or get excited too early. The smart move is to mark the zone where multiple signals line up (like we did here with the Fib level and wedge), and then simply wait. Let price show you what it wants to do, rather than guessing in the middle of a sharp move.
Conclusion
BSE is testing an important zone today after a strong rally. As always, we prefer to wait for confirmation rather than jumping in mid-fall. We'll keep watching and post an update once this plays out.
For educational purposes only. Not financial advice. Always manage your risk.  Long
Long
DLF — Reclaiming EMAs After Multi-Year Trendline Support TestOverview
DLF has staged a sharp move today (+3.96%, closing at 685.75), reclaiming both its 50 EMA (615) and 200 EMA (645) after a multi-month downtrend from the 2024 high of 967.60. This bounce comes off a well-established rising trendline that has held since 2021, having been tested and respected at the 2022 low, the 2023 low, and again at the recent 2026 low — making it a genuine multi-year structural support.
Closer view of recent Chart patterrn
Pattern Explanation
The stock has been in a broad uptrend since 2021, with a long-term rising trendline connecting successive higher lows across 2022, 2023, and now 2026. Price recently pulled back to test this trendline again near the 517–520 zone before today's sharp reversal. The move has pushed price back above both EMAs in a single session, which is often an early signal of a potential trend shift after an extended decline, though it needs follow-through to confirm.
Key Levels
Resistance Zone: 806
200 EMA: 645 (644.52)
50 EMA: 615 (614.91)
Support / Invalidation Zone: 517.65
Major Reference High: 967.60
Major Reference Low: 231.85
Scenarios
If the EMA reclaim holds: Continued stabilization above the 615–645 zone would support the case that this is a genuine trend shift rather than a one-day bounce, with the Resistance Zone at 806 as the next major level to watch.
If the reclaim fails: A close back below the 50 EMA (615), and especially a break below the Support/Invalidation zone at 517.65, would suggest today's move was a temporary bounce within the larger downtrend, keeping the long-term rising trendline as the key structural level to watch instead.
Beginner's Lesson
Reclaiming key moving averages after an extended decline is a meaningful technical event, but a single strong session isn't enough to confirm a trend change on its own. What matters more is whether price can hold above these averages over the following sessions rather than slipping back below them — that follow-through is what separates a genuine shift from a short-lived bounce.
Conclusion
DLF has shown a strong reaction off multi-year trendline support today, reclaiming both EMAs in the process. As always, wait for confirmation over the next few sessions before drawing firm conclusions, and manage risk according to your own plan.
Not investment advice. For educational purposes only. Please consult your financial advisor before making any trading decisions.  Long
Long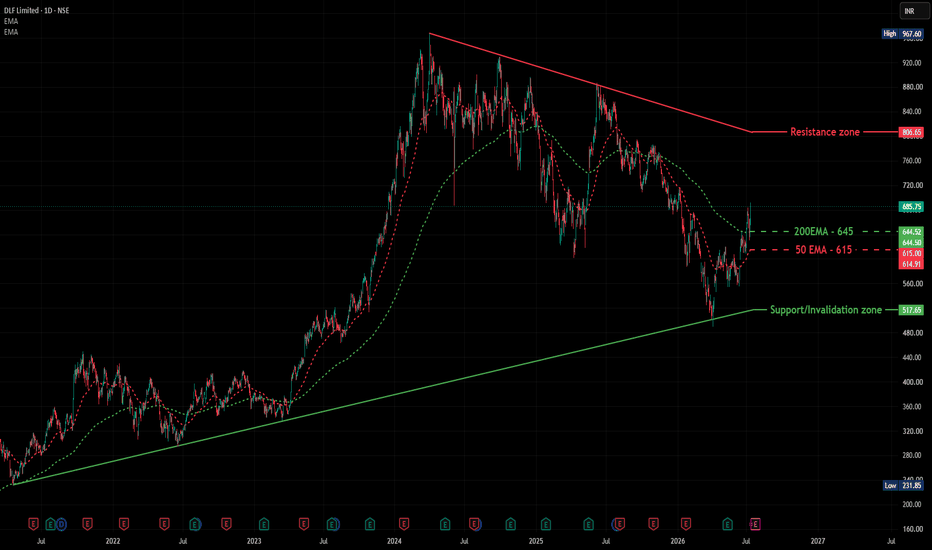
Uno Minda (W): Bullish (Angular BO & Pre-Resistance Squeeze)Timeframe: Weekly | Scale: Logarithmic
Uno Minda has successfully broken a multi-month angular downtrend line active since its All-Time High. The stock is now coiled right below a critical horizontal resistance, building momentum for the next leg up.
📈 1. The Chart Structure (The Breakout)
> The Angular Breakout: The stock definitively cleared the descending trendline that had been capping its upside since the ₹1,382 peak. Closing the week near ₹1,163–₹1,166 confirms that buyers have overpowered the bears on this axis.
> The Immediate Ceiling: The stock is currently fighting a "support-turned-resistance" horizontal level. It hit an intraday high of ₹1,179.90 on Friday before facing mild intraday profit-booking.
📊 2. Volume & Indicators
> Volume Ignition: The weekly volume of 6.09 Million is excellent. Consistent volume expansion during a breakout is the most reliable indicator of a sustainable move, showing that the "Smart Money" is participating.
> Trend Harmony:
- EMAs: The Positive Crossover (PCO) of short-term EMAs on both Daily and Weekly charts confirms that the immediate path of least resistance is up.
- Momentum: Both RSI and MACD are rising on both Weekly and Daily timeframes, indicating that bullish momentum is steadily accelerating without being overbought yet.
🎯 3. Future Scenarios & Key Levels
The trade hinges on clearing the immediate horizontal resistance.
🐂 Bullish Targets (The Markup):
Trigger: A decisive Daily/Weekly Close above ₹1,180.
- Target 1: ₹1,250.
- Target 2: ₹1,328.
🛡️ Support (The "Must Hold"):
- Immediate Support: ₹1,135. This is the critical floor. It served as a solid intraday base earlier in the week.
- Invalidation: A close below ₹1,100 would invalidate the breakout momentum and suggest a return to sideways consolidation.  Long
Long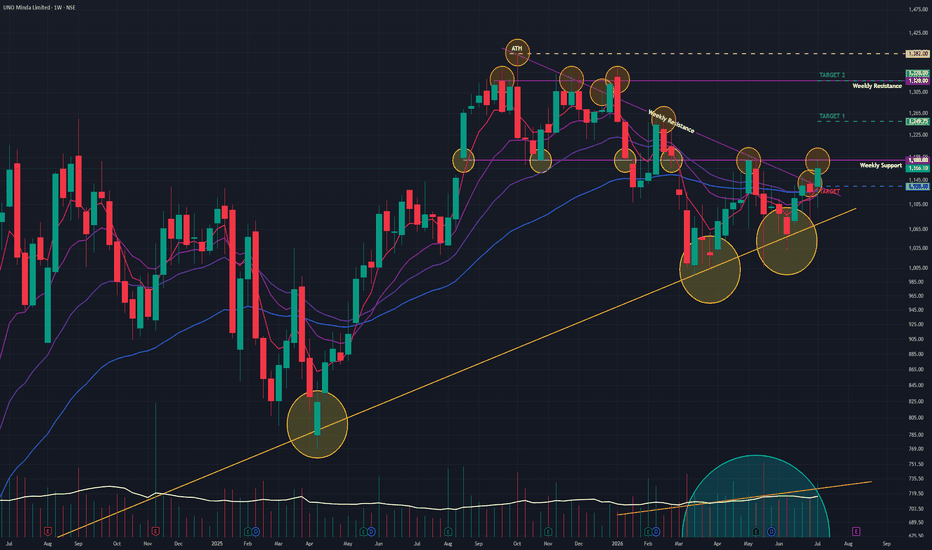
PSP Projects Ltd. (NSE: PSPPROJECT)Current Market Price (CMP): ₹836.05 (Up 8.23% in the latest session).
Following a prolonged corrective phase from its 52-week high (also ATH) of ₹1,029.90 down to a key structural low of ₹569.20, PSP Projects Ltd. has entered a decisive bullish reversal phase.
It has shown a strong recovery from its March–April 2026 lows, with the stock now trading near ₹836 after reclaiming key moving averages and witnessing improving momentum indicators. The current structure suggests a medium-term bullish continuation attempt, although some oscillators indicate short-term consolidation before the next directional move.
The trend structure currently resembles:
Accumulation → Breakout → Retest → Continuation
The stock has demonstrated:
Strong reversal from the ₹570–600 support zone
Higher highs and higher lows over recent weeks
Rising volume participation during breakout phases
Momentum improvement across RSI, MACD, and trend indicators
Chart Structural Patterns & Price Action & Technical Indicators
1. The Rounded Accumulation Base (Rounding Bottom)
The stock found structural demand between ₹570 and ₹600. The price action from Feb 2026 through May 2026 has formed a well-defined Rounding Bottom / Rounded Accumulation Base, forming a Cup and Handle pattern.
The Breakout: The recent move past the ₹780-800 milestone marks a decisive breakout from this accumulation curve.
EMA: Trading above all short, medium and long term moving averages. Recently 20EMA crossed above 50EMA, confirming bullish setup. This crossover is generally considered, a medium-confidence buy signal.
RSI: The RSI appears to be trading around the 60-63 zone after cooling off from overbought territory near 70 in early May.
MACD: The MACD indicator recently generated a bullish crossover and remains above the zero line.
ADX: The ADX has bottomed out and is beginning to curl upward beyond 20.
Bull Case: The bullish outlook confirms as long as:
Price sustains above ₹800
RSI remains above 50
MACD stays positive
Conservative traders can buy on daily close above ₹868-870; risk traders can buy now.
Potential Upside Targets
Target 1 (easier): ₹900-930 (strong resistance zone)
Target 2 (medium): ₹1,000-1,030 (will meet ATH)
Target 3 (risky): ₹1,080 only possible if momentum continues beyond ATH and breakout sustains.
Stop Loss: Daily closing below EMA support zone (around ₹760–₹770) and would invalidates this breakout setup.
Bear Case: The structure weakens if:
Price falls below ₹760
EMA bullish crossover fails (20EMA & 50EMA)
RSI breaks below 45
This could trigger, deeper correction toward ₹680–700
Happy Trading
Disclaimer: This article is for informational and educational purposes only and does not constitute financial advice or a recommendation to buy or sell any stock. Technical analysis, including the study of RSI, SMA study, MACD patterns, is based on publicly available information and on historical data, which does not guarantee future results. I am not a SEBI-registered financial advisor, and Investors should conduct their own research or consult with a SEBI-registered financial advisor before making any investment decisions. Investments in the securities market are subject to market risks; read all the related documents carefully before investing.  Long
Long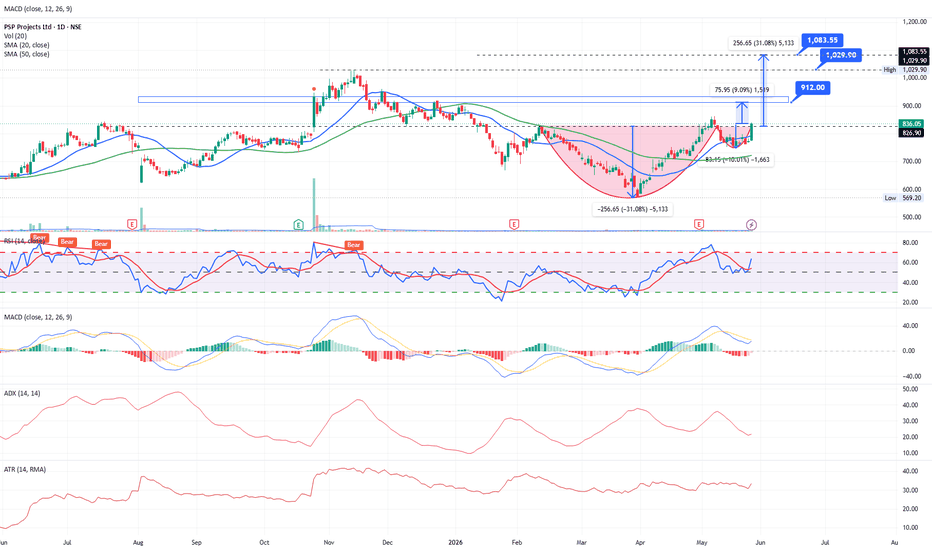
 Long
Long
 Long
Long
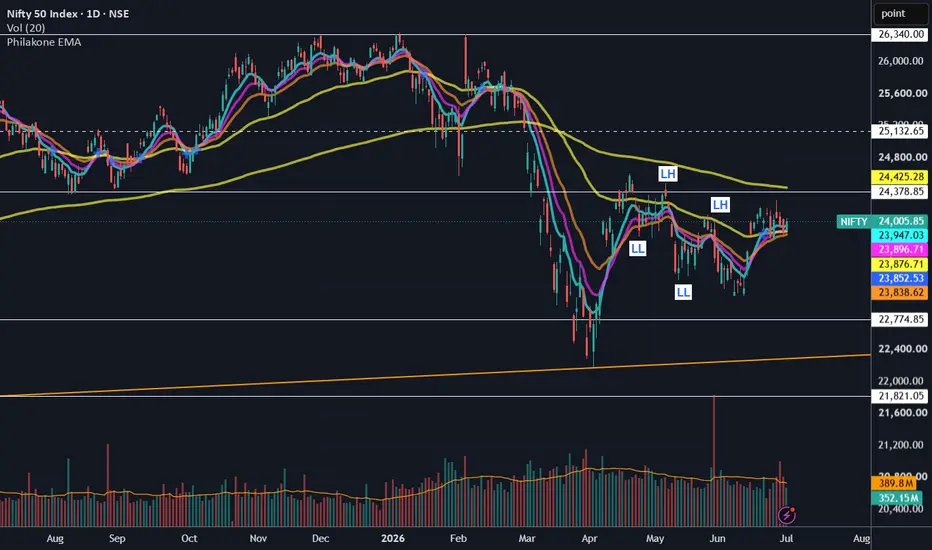
NIFTY Monthly UpdateNIFTY traded in the range of 23,070–24,260 during the month of June, closing 1.35% higher compared to May. Although geopolitical tensions have eased and crude oil prices have fallen, FII selling in equities continued in the domestic market. The EMA confluence zone of 24,000–24,400 across timeframes will be a key level to watch. On the upside, 25,100 will act as the first resistance level. On the downside, the previous swing low of 23,000 and then 22,800 will act as support levels.
Let me know your thoughts. DYOR. EURUSD — EMA Bearish Trend, Sell From Value Zone
Fundamental Analysis
EURUSD remains under bearish pressure as price continues to trade below the main EMA structure. Traders are still watching USD momentum, Fed expectations, and upcoming macro data.
For now, the technical structure still favours sellers while recovery attempts remain limited below EMA resistance.
Technical Analysis
On the 2H chart, EURUSD is trading below EMA 34, EMA 89, and EMA 200. This shows that the short-term trend remains bearish, with the EMA structure acting as dynamic resistance above price.
Price is currently around 1.1352 after a strong bearish move. The market is now consolidating below the previous breakdown area, but this reaction has not confirmed a bullish reversal.
The key sell value zone is around 1.1384 - 1.1405. This area aligns with the Fibonacci retracement zone, high liquidity area, and previous short-term structure. If price pulls back into this zone and rejects, sellers may continue to defend the downtrend.
The key support level is around 1.1325. If price breaks below this area with strong bearish momentum, the next downside target is the lower liquidity zone around 1.1229.
Important Key Levels
Current price area: 1.1352
Sell value zone: 1.1384 - 1.1405
Fibonacci + High Liquidity zone: 1.1384 - 1.1405
EMA resistance area: 1.1445 - 1.1533
Key support: 1.1325
Main downside target: 1.1229
Invalidation area: above 1.1405
Trading Scenario
Main Sell Scenario
Entry: 1.1384 - 1.1405
Stop Loss: 1.1533
Take Profit 1: 1.1325
Take Profit 2: 1.1280
Take Profit 3: 1.1229
Sell Condition
The preferred setup is to wait for EURUSD to pull back into the 1.1384 - 1.1405 sell value zone. This area combines Fibonacci retracement, high liquidity, and previous structure.
A sell setup becomes more valid if price forms bearish rejection from this zone, such as a long upper wick, bearish engulfing candle, failed breakout, or lower high below the EMA structure.
If price rejects from the sell zone and breaks below 1.1325, the bearish continuation view becomes stronger. The next downside focus would be 1.1280, followed by the main target around 1.1229.
Entry Conditions
Wait for price to retest 1.1384 - 1.1405.
Look for bearish rejection before entering sell.
A break below 1.1325 confirms stronger downside pressure.
If price breaks and holds above 1.1405, the short-term sell setup becomes weaker.
Overall, the main view remains bearish while EURUSD trades below EMA 34, EMA 89, and EMA 200. The preferred plan is to wait for a pullback into the Fibonacci and high-liquidity value zone, then look for sell confirmation toward 1.1325 and 1.1229.
Do you share the same bearish view on EURUSD, or are you waiting for a cleaner rejection from the value zone first?
 Long
Long
 Short
Short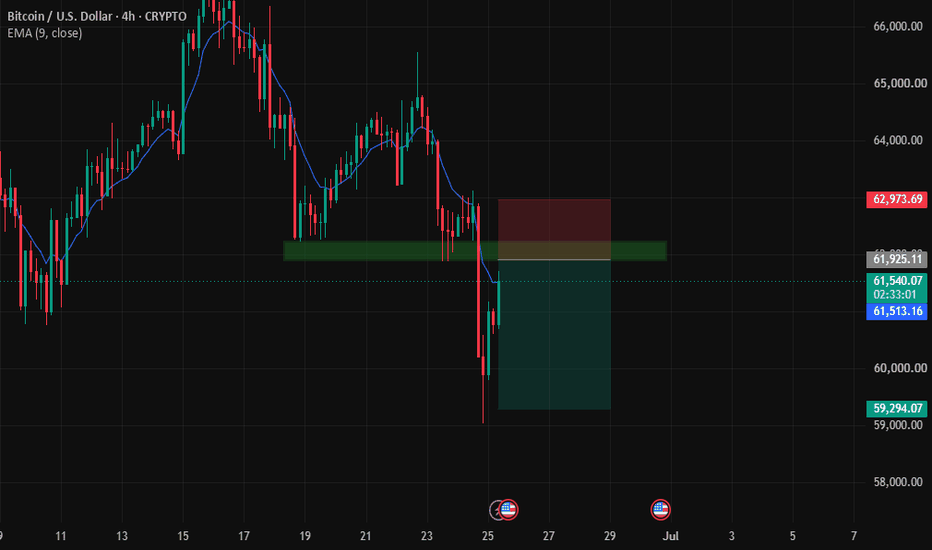
EMA Downtrend, Waiting for Fibonacci Sell EntryFundamental Analysis
Gold remains under bearish pressure as price continues to trade below the main EMA structure. Traders are still watching USD momentum, Treasury yields, and upcoming U.S. macro data.
For now, the technical structure still favours sellers while recovery attempts remain weak below the EMA resistance zone.
Technical Analysis
On the 1H chart, XAUUSD is trading below EMA 34, EMA 89, and EMA 200. The EMA structure is still pointing downward, confirming that the main trend remains bearish.
Price recently created a doji candle near the lower area around 4,060 - 4,070, showing short-term hesitation after the sell-off. However, this doji is not enough to confirm a bullish reversal while price remains below the EMA trend.
The key sell entry zone is around 4,109 - 4,117. This area aligns with the Fibonacci retracement zone, broken structure, and EMA resistance pressure. If price pulls back into this zone and rejects, the bearish continuation setup becomes cleaner.
The main downside target is around 3,989, which aligns with the Fibonacci extension area and lower liquidity zone on the chart.
Important Key Levels
Current price area: 4,064
Fibonacci sell entry zone: 4,109 - 4,117
EMA resistance area: 4,123 - 4,170
Short-term resistance: 4,086
Bearish continuation level: 4,073 - 4,064
Main Fibonacci target: 3,989
Invalidation area: above 4,146
Trading Scenario
Main Sell Scenario
Entry: 4,109 - 4,117
Stop Loss: 4,146
Take Profit 1: 4,086
Take Profit 2: 4,034
Take Profit 3: 3,989
Sell Condition
The preferred setup is to wait for gold to pull back into the 4,109 - 4,117 Fibonacci sell entry zone. This area is important because it aligns with the EMA downtrend and the previous broken structure.
A sell setup becomes more valid if price forms bearish rejection from this zone, such as a long upper wick, bearish engulfing candle, failed breakout, or lower high below the EMA range.
If price rejects from the sell zone and breaks below 4,064 again, the bearish continuation view becomes stronger. The next downside focus would be 4,034, followed by the Fibonacci extension target around 3,989.
Entry Conditions
Wait for price to retest 4,109 - 4,117.
Look for bearish rejection before entering sell.
A break below 4,064 confirms stronger downside pressure.
If price breaks and holds above 4,146, the sell setup is invalid.
Overall, the main view remains bearish while XAUUSD trades below EMA 34, EMA 89, and EMA 200. The preferred plan is to wait for a pullback into the Fibonacci sell entry zone, then look for sell confirmation toward 4,034 and 3,989.
Do you share the same bearish view on gold, or are you waiting for a cleaner rejection from the Fibonacci sell zone?  Short
Short
 Long
Long
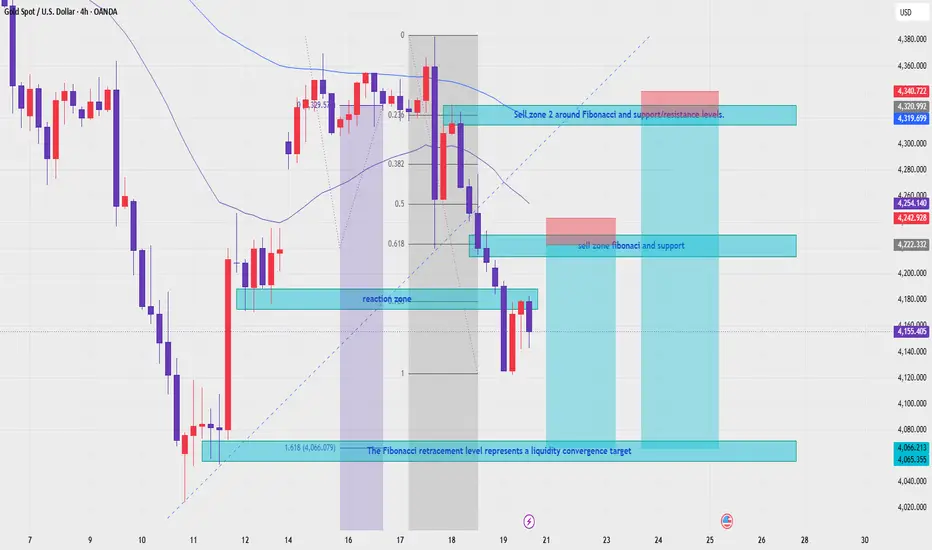
XAUUSD H4 — EMA Bearish TrendXAUUSD — EMA Bearish Trend, Two Sell Zones Toward Fibonacci Liquidity Target
Fundamental Analysis
Gold remains under bearish pressure as price continues to trade below the main EMA structure. The market is still watching USD strength, Treasury yields, and upcoming U.S. data, which may create volatility around key Fibonacci and liquidity zones.
For next week, the main view remains bearish while recovery attempts stay below the EMA resistance area.
Technical Analysis
On the 4H chart, XAUUSD is still trading below EMA 34, EMA 89, and EMA 200. This confirms that the broader short-term trend remains bearish, with the EMA structure acting as dynamic resistance above price.
Price is currently around 4,155 after a strong bearish move from the upper structure. The chart shows that gold is now reacting near a short-term reaction zone, but the recovery has not yet confirmed a bullish reversal.
The first sell area is around 4,222 - 4,243. This zone aligns with Fibonacci retracement, previous support turned resistance, and short-term liquidity. If price pulls back into this area and rejects, sellers may continue to defend the trend.
The second sell area is higher, around 4,320 - 4,341. This zone is stronger because it aligns with Fibonacci resistance, EMA pressure, and a larger support/resistance liquidity area. If gold retraces deeper into this zone, it may offer another sell opportunity with a wider structure.
The main downside target remains the Fibonacci 1.618 liquidity convergence zone around 4,066 - 4,065.
Important Key Levels
Current price area: 4,155
Reaction zone: 4,170 - 4,180
Sell zone 1: 4,222 - 4,243
Sell zone 2: 4,320 - 4,341
EMA resistance area: 4,254 - 4,320
Liquidity convergence target: 4,066 - 4,065
Invalidation for sell zone 1: above 4,254
Invalidation for sell zone 2: above 4,341
Trading Scenario
Sell Scenario 1 — Fibonacci Support Retest
Entry: 4,222 - 4,243
Stop Loss: 4,254
Take Profit 1: 4,170
Take Profit 2: 4,120
Take Profit 3: 4,066 - 4,065
Sell Condition
The first sell setup is to wait for gold to pull back into 4,222 - 4,243. This area is the nearest Fibonacci and support/resistance retest zone.
A sell setup becomes more valid if price forms bearish rejection from this zone, such as a long upper wick, bearish engulfing candle, failed breakout, or lower high below the EMA structure.
Sell Scenario 2 — Higher Liquidity Sell Zone
Entry: 4,320 - 4,341
Stop Loss: 4,365
Take Profit 1: 4,243
Take Profit 2: 4,170
Take Profit 3: 4,066 - 4,065
Sell Condition
The second sell setup is only considered if gold retraces deeper into 4,320 - 4,341. This is the stronger liquidity and Fibonacci resistance zone on the chart.
A rejection from this area would show that buyers failed to reclaim the EMA resistance zone. If sellers defend this level, the next bearish leg may target 4,243 first, then 4,170 and the Fibonacci 1.618 target around 4,066 - 4,065.
Entry Conditions
Wait for price to retest one of the sell zones.
Look for bearish rejection before entering sell.
Do not sell directly at the low without a pullback.
A break below 4,120 would strengthen the move toward 4,066.
If price breaks and holds above 4,341 - 4,365, the bearish setup should be reassessed.
Overall, the main view remains bearish while XAUUSD trades below EMA 34, EMA 89, and EMA 200. For next week, the preferred plan is to wait for a pullback into 4,222 - 4,243 or 4,320 - 4,341, then look for sell confirmation toward the Fibonacci liquidity convergence target around 4,066 - 4,065.
Do you share the same bearish view on gold for next week, or are you waiting for a cleaner pullback into the higher sell zone first?
Short 
XAUUSD — EMA Consolidation Before Bearish Continuation
Fundamental Analysis
Gold remains under short-term pressure as traders continue to watch USD momentum, Treasury yields, and upcoming U.S. macro data.
For now, the recovery has not confirmed a bullish reversal. Price is still reacting around the EMA area, so the current move may be only a short-term consolidation before sellers attempt another push lower.
Technical Analysis
On the 2H chart, XAUUSD is trading around 4,304 after a strong rejection from the upper value range. Price is now consolidating near the EMA 34 and EMA 89 area, showing that the market is pausing before choosing the next direction.
The key zone to watch is 4,301 - 4,320. This area aligns with the Fibonacci retracement zone, volume reaction, and short-term EMA structure. If price fails to hold above this area, sellers may regain control.
The stronger resistance remains around 4,359 - 4,382. As long as gold stays below this value range, the bearish view remains preferred.
If price breaks below the current EMA consolidation zone, the next downside levels are 4,257 and 4,219. A deeper bearish continuation may target the larger convergence support zone around 4,118 - 4,125.
Important Key Levels
Current price area: 4,304
EMA consolidation zone: 4,301 - 4,320
Fibonacci retracement + volume zone: 4,301 - 4,320
Upper value range resistance: 4,359 - 4,382
First downside target: 4,257
Second downside target: 4,219
Major convergence support zone: 4,118 - 4,125
Invalidation area: above 4,382
Trading Scenario
Main Sell Scenario
Entry: 4,301 - 4,320
Stop Loss: 4,382
Take Profit 1: 4,257
Take Profit 2: 4,219
Take Profit 3: 4,118 - 4,125
Sell Condition
The preferred setup is to wait for gold to react around the 4,301 - 4,320 EMA and Fibonacci value zone.
A sell setup becomes more valid if price forms bearish rejection from this zone, such as a long upper wick, bearish engulfing candle, failed breakout, or a lower high below the upper value range.
If price breaks below 4,257 with clear bearish momentum, the next downside focus will be 4,219. Below that, the larger target zone is 4,118 - 4,125.
Entry Conditions
Wait for rejection around 4,301 - 4,320.
Do not sell if price breaks strongly above the value zone.
A move below 4,257 confirms stronger bearish pressure.
If price breaks and holds above 4,382, the sell setup is invalid.
Overall, the main view remains bearish while XAUUSD stays below the upper value range and fails to reclaim stronger resistance. Price may continue to consolidate around the EMA zone in the short term, but if sellers defend 4,301 - 4,320, gold may continue lower toward 4,257, 4,219, and 4,118 - 4,125.
Do you share the same bearish view on gold, or are you waiting for a clearer breakdown below the EMA consolidation zone?
Short 
 Long
Long
GBPUSD — Sell From EMA Value Zone & Fibonacci Levels
Fundamental Analysis
GBPUSD remains under short-term pressure as traders continue to watch USD strength, U.K. data, and upcoming macro events.
For now, the recovery has not confirmed a bullish reversal. Price is still trading below the key EMA resistance area, so pullbacks into value may continue to offer sell opportunities.
Technical Analysis
On the 2H chart, GBPUSD is trading around 1.3323 after a sharp bearish move from the upper range. Price is currently reacting near the strong support area, but the broader structure still favours sellers while the EMA 34, EMA 89, and EMA 200 remain above price.
The key zone to watch is the EMA value zone around 1.3380 - 1.3395. This area also aligns with the Fibonacci 0.382 retracement and previous broken support. If price pulls back into this zone and rejects, sellers may regain control.
There is also a short-term Fibonacci reaction level around 1.3355 - 1.3363, which can create a scalping sell reaction if price fails to recover strongly.
As long as GBPUSD remains below the EMA value zone, the main bias stays bearish. A rejection from the Fibonacci retracement levels may send price back toward 1.3320, then deeper to 1.3260.
Important Key Levels
Current price area: 1.3323
Strong support area: 1.3315 - 1.3330
Sell scalping zone: 1.3355 - 1.3363
Main EMA value sell zone: 1.3380 - 1.3395
Fibonacci 0.382 value zone: 1.3380 - 1.3395
Upper invalidation area: above 1.3415
First downside target: 1.3315
Main downside target: 1.3260
Trading Scenario
Main Sell Scenario
Entry: 1.3380 - 1.3395
Stop Loss: 1.3415
Take Profit 1: 1.3330
Take Profit 2: 1.3315
Take Profit 3: 1.3260
Sell Condition
The preferred setup is to wait for GBPUSD to pull back into the 1.3380 - 1.3395 EMA value zone. This area is important because it combines EMA resistance, Fibonacci retracement, and previous broken structure.
A sell setup becomes more valid if price forms bearish rejection from this zone, such as a long upper wick, bearish engulfing candle, failed breakout, or lower high formation below the EMA structure.
If price rejects from the value zone and breaks back below 1.3330, bearish pressure may continue toward 1.3315 and 1.3260.
Entry Conditions
Wait for price to retest 1.3380 - 1.3395.
Look for bearish rejection before entering sell.
Do not sell directly at strong support without a pullback.
If price breaks and holds above 1.3415, the sell setup is invalid.
Overall, the main view remains bearish while GBPUSD trades below the EMA value zone. The preferred plan is to wait for a corrective pullback into 1.3380 - 1.3395, then look for sell confirmation toward 1.3330, 1.3315, and 1.3260.
Do you share the same bearish view on GBPUSD, or are you waiting for a cleaner rejection from the EMA value zone?
EURUSD — EMA Bearish Trend, Sell From Value Zone
Fundamental Analysis
EURUSD remains under pressure as the market continues to watch USD momentum, Fed expectations, and upcoming U.S. macro data. If the dollar stays supported, recovery attempts on EURUSD may remain limited.
For next week, the main focus is whether price can retest the value zone above before continuing lower in line with the EMA trend.
Technical Analysis
On the 4H chart, EURUSD is still trading inside a descending channel. EMA 34, EMA 89, and EMA 200 remain above price, showing that the main structure is still bearish.
Price is currently around 1.1565 after reacting from the lower support area. However, this recovery is moving toward the Fibonacci value zone and EMA resistance area near 1.1615.
The main sell zone is around 1.1612 - 1.1627. This area aligns with the 0.382 - 0.5 Fibonacci retracement, EMA resistance, previous broken structure, and liquidity above price.
The key bearish confirmation level is around 1.1500 - 1.1510. If price rejects from the value zone and breaks back below this support, the bearish continuation scenario becomes stronger.
The weekly downside target is the Fibonacci 1.618 extension around 1.1387.
Important Key Levels
Current price area: 1.1565
Main sell zone: 1.1612 - 1.1627
Value zone / Fibonacci area: 1.1612 - 1.1627
Liquidity above: 1.1644 - 1.1646
EMA resistance area: 1.1592 - 1.1646
Key support zone: 1.1500 - 1.1510
Weekly Fibonacci target: 1.1387
Invalidation area: above 1.1646
Trading Scenario
Main Sell Scenario
Entry: 1.1612 - 1.1627
Stop Loss: 1.1646
Take Profit 1: 1.1510
Take Profit 2: 1.1450
Take Profit 3: 1.1387
Sell Condition
The preferred setup is to wait for EURUSD to pull back into the 1.1612 - 1.1627 sell zone. This area is the main value zone on the chart and also aligns with EMA resistance, Fibonacci retracement, and previous broken structure.
A sell setup becomes more valid if price forms bearish rejection from this zone, such as a long upper wick, bearish engulfing candle, failed breakout, or lower high below the EMA structure.
If price rejects from the sell zone and breaks below 1.1500 - 1.1510, the bearish continuation view becomes stronger. The next downside focus would be 1.1450, followed by the weekly Fibonacci target around 1.1387.
Entry Conditions
Wait for price to retest 1.1612 - 1.1627.
Look for bearish rejection before entering sell.
A break below 1.1500 - 1.1510 confirms stronger downside pressure.
If price breaks and holds above 1.1646, the sell setup is invalid.
Overall, the main view for next week remains bearish while EURUSD trades below the EMA structure and inside the descending channel. The preferred plan is to wait for a pullback into the Fibonacci value zone, then look for sell confirmation toward 1.1510, 1.1450, and the weekly Fibonacci target at 1.1387.
Do you share the same bearish view on EURUSD, or are you waiting for a cleaner rejection from the 1.1615 value zone first?
 Long
Long