Investment Doubler - Buy Chennaipetro
**CHENNAI PETROLEUM CORPORATION LTD (CPCL) — Monthly + Weekly Multi-Timeframe Analysis**
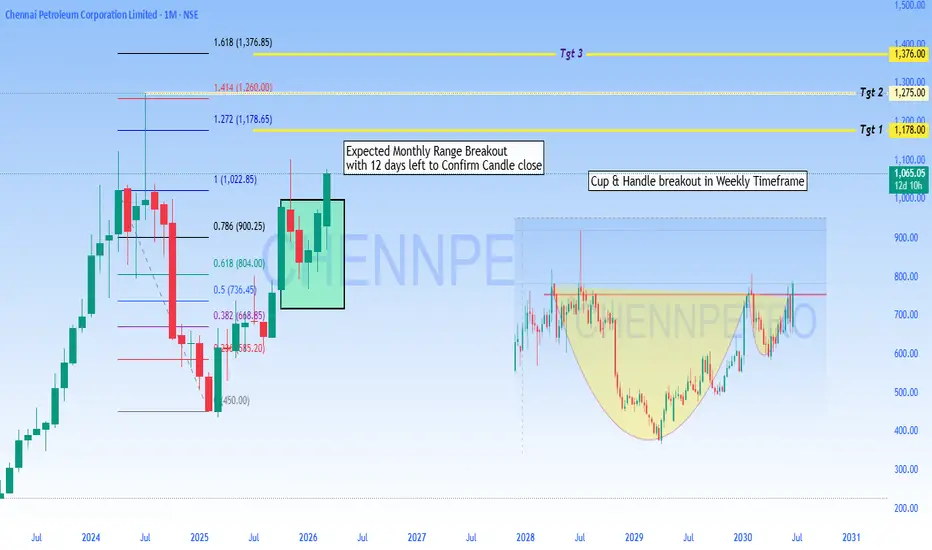
CPCL is currently trading at **₹1,065**, breaking out above the **1.0 Fibonacci extension (₹1,022.85)** on the monthly chart, with **12 days remaining** to confirm the monthly candle close.
**Monthly Timeframe — Fibonacci Breakout:**
- Price bottomed near **₹450** in early 2025 and has since staged a powerful recovery
- Currently breaking out of a highlighted consolidation zone (green box)
- Monthly close
Multiple Time Frame Analysis
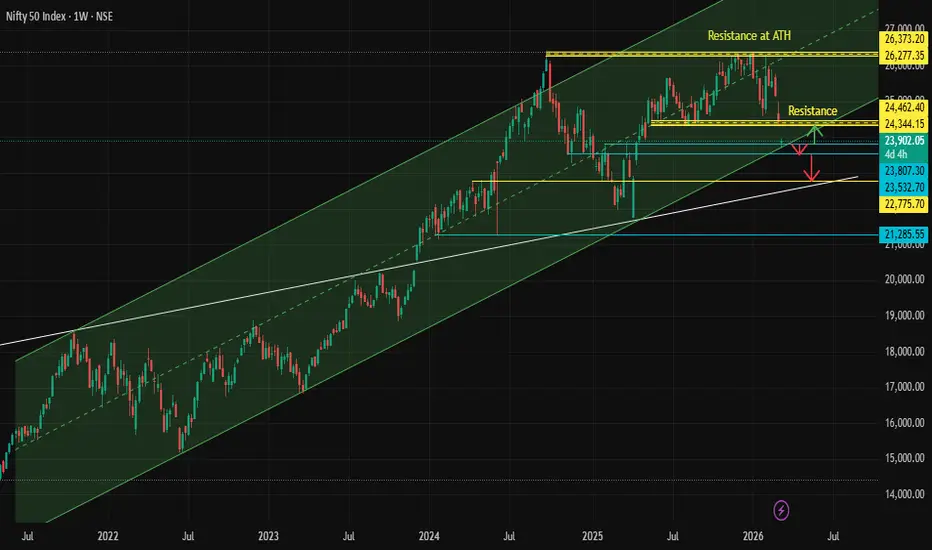
NIFTY heading towards 23800 now!As we can see its another day NIFTY managed to recover from our trendline support and pyshcological level exactly as analysed. Now that it has managed to sustain itself above the trendline, we may see NIFTY to continue its upmove towards 23800 which is its next important supply zone so plan your trades accordingly and keep watching everyone.
STRONG REVERSAL exactly as analysed.As we can see NIFTY reversed exactly from 23000 level which has been analysed in our previous post. Now that it has shown signs of REVERSAL from the demand zone, we can expect NIFTY to remain BULLISH from here and view should be changed from SELLING on RISE to BUYING on every DIP as long as 23000 level is protected so plan your trades accordingly and keep watching everyone.
23000 is almost here! REVERSAL COMING UP!??As we can see NIFTY has shown unidirectional beasirshness exactly as analysed and anticipated but now it can be seen trading at important trendline support. Moreover, we can see NIFTY heading towards important psychologival level of 23000 which can also act as a DEMAND ZONE hence we may expect Bulls to finally take control and show signs of reversal from here so plan your trades accordingly and keep watching everyone.
MARAL — Dynamic Risk MapperMARAL — Dynamic Risk Mapper- New script
From static trade levels to live execution intelligence
Most trade-management tools stop at drawing a few levels.
They show an entry, a stop, a target, and leave the trader alone once price starts moving.
But in live markets, that is exactly where the real problem begins.
A trader does not struggle only with where to enter.
A trader struggles with what happens after the trade is mapped:
Is price still respecting the entry zone?
Is invalidation pressure in
IGB 10Y Weekly UpdateBonds have traded largely within a range of 6.64%-6.76%, amid geopolitical tensions in West Asia, rising oil prices, and supply shortages due to the closure of the Strait of Hormuz. RBI purchases of ₹57,000 Cr in the first week of March, along with OMO purchases of ₹50,000 Cr each on March 9 and 13, supported yields within this range—even as inflation fears from geopolitical tensions weighed heavily.
For the coming week, bond yields are expected to trade in a similar range of 6.64%-6.78%. A bre
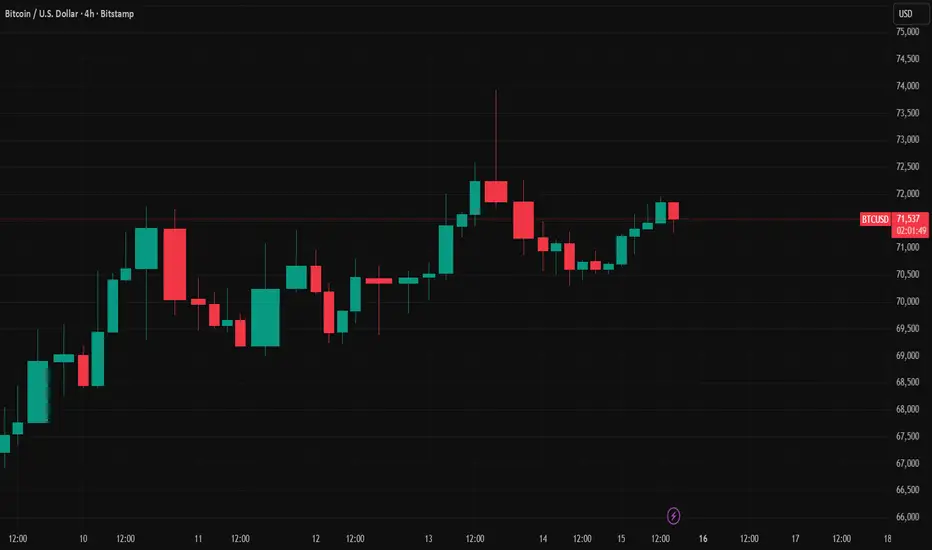
MARAL Execution Workflow — Turning Chart States into Live AlertsThe attached BTCUSD chart is a simple but powerful example of why modern execution tools should never stop at visual markers alone.
A marker on a chart is useful only if the trader is watching the screen at the exact moment it prints. But a serious execution framework is not built for passive viewing. It is built for state detection, permission control, and timed communication. That is exactly where the MARAL alert architecture changes the role of an indicator on TradingView.
This chart is not
We are getting closer towards 23000As we can see despite the try NIFTY failed to sustain itself above and fell in the second half showing no signs of respite. Now, we can expect NIFTY to remain weak unless next important demand zone is reached which can be seen towards 23000 level which is also a psychological level so plan your trades accordingly and keep watching everyone.
When a Long Trap Appears — But MARAL Still Says No Trade
Reading the Trap Panel beyond emotion, beyond candles, beyond guesswork
Most traders see one thing after a liquidity event:
a sharp reaction, a reversal candle, and the feeling that “this is the entry.”
But trap trading is not about spotting a wick.
It is about identifying whether one side of the market has actually been trapped and whether the environment is strong enough to convert that trap into a valid execution opportunity.
That is exactly where the MARAL Trap Entry / Exit Permission Pan
NIFTY has space to move above and fill the GAPAs we can see NIFTY managed to close forming a bullish hammer candle showing signs of strength, we can also see NIFTY has space which needs to be filled till 24500 levels hence we may expect NIFTY to fill its gap making it bullish until it hits the supply zone and important psychological level od 24500 so plan your trades accordingly and keep watching everyone.
MARAL SMFT-X+Flow Governance: Reading RealMoves or TrapConditionMarkets do not fail traders only because direction is wrong.
Very often, direction is broadly correct, but the quality of the move is poor, the timing is premature, or the price action is being driven by deceptive liquidity behavior rather than true continuation.
That is the purpose of the Participation & Flow Governance panel and the SMFT-X panel inside the MARAL Execution Workflow.
These panels were not designed to predict tops, bottoms, or guaranteed outcomes. Their purpose is more practica
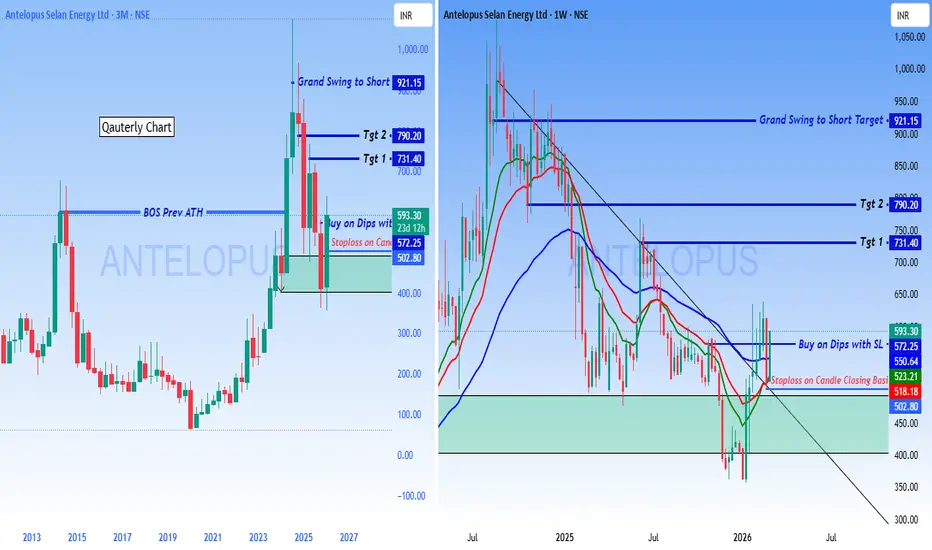
Swing to Short term Investment - Antelopus
**Antelopus Selan Energy Ltd (NSE) – Multi-Timeframe Analysis**
📊 **Quarterly & Weekly Chart | BOS Prev ATH Confirmed**
Price has broken out above the previous All-Time High on the quarterly chart and is currently pulling back. A **Buy on Dips** setup is active near the **502.80–572.25 zone** with stop loss on a candle closing basis.
🎯 **Targets:**
- Tgt 1: 731.40
- Tgt 2: 790.20
- Grand Swing Short Target: 921.15
📍 **Current Price:** ₹593.30
🛑 **SL:** Below 502.80 (candle close basis)
Pat
NIFTY doesnt looks to be in good shape!As we can see NIFTY recovered strongly exactly as anlsysed but we did not see a strong closing. So, we can see NIFTY being sideways to negative unless it breaks and sustains itself above 25000 mark so until and unless we are above that! every rise can be sold so plan your trades accordingly and keep watching everyone.
We might see NIFTY recovering from here! As we can see NIFTY showed strong recovery from the demand zone and close above the demand zone which is very strong! Hence we can expect NIFTY to recover from here if manages to sustain above the demand zone so plan your trades accordingly and keep watching everyone.
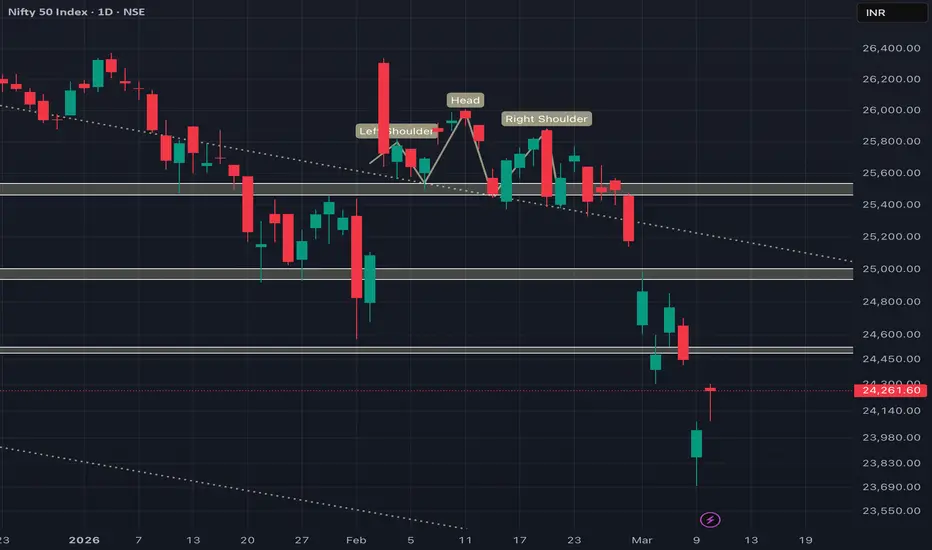
NIFTY to remain weak below 25000As we can see NIFTY remained weak throughout the day and managed to recover but still below our demand zone hence we can expect NIFTY to remain negative below 25000 level as this demand zone will not act as a SUPPLY ZONE. Moreover, we can expect more of bearishness if NIFTY broke below 24600 levels so plan your trades accordingly and keep watching everyone.
NIFTY to remain bearish for now!As we can see NIFTY fell strongly exactly from our given levels exactly as analysed. Following the global cues, we can see NIFTY to continue its bearishness following the global cues which can add fuel to the fire. So until and unless NIFTY closes itself 25500 we are very bearish. so, plan your trades accordingly and keep watching everyone.
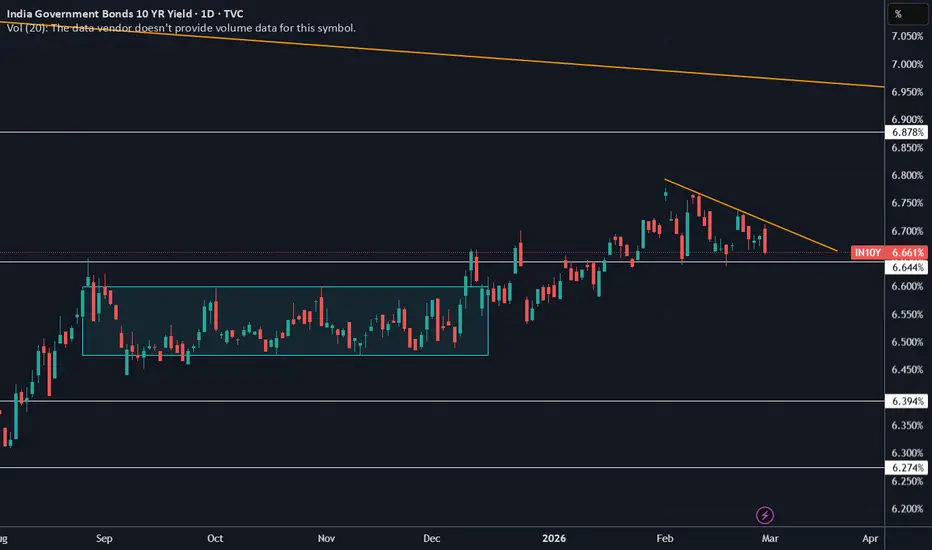
IGB 10Y Weekly/Monthly UpdateIGB 10Y has formed a descending triangle on daily charts, with 6.64% acting as a support level. A breakout from the pattern indicates a drop in the yields to 6.50%.
Hence for the coming month are expected to trade in the range of 6.50%-6.78%. 6.65% has been acting as a crucial support since last few weeks and it expected to remain the same. If it breaches, this level, it likely to find support at 6.60%, which acted as resistance in the earlier range bound motion. On the upside, if it breaches 6