ONGCONGC
Price above all EMA on weekly and daily chart shows its strength.
Recently it closes above its weekly/monthly range and price sustain above the level.
May have little hurdle near 290-300 but then it moves above 300
QoQ shows improving
Rest sectorial stocks like BPCL, IOC, MGL etc are showing showing strong moves.
NB: I am not a Registered analyst, do take advice from your financial advisor prior trade.
Multiple Time Frame Analysis
We are very bearish below 25400Following the structure we can see the demand zone has been tested multiple times making it weaker and the rise in OI also adds fuel to the fire making NIFTY extremely weak and looking further we can see there is no eminent demand zone below 25400 so we may expect a sharp unidirectional downfall in coming trading sessions which could lead NIFTY to 24100-25000 so plan your trades accordingly and keep watching everyone.
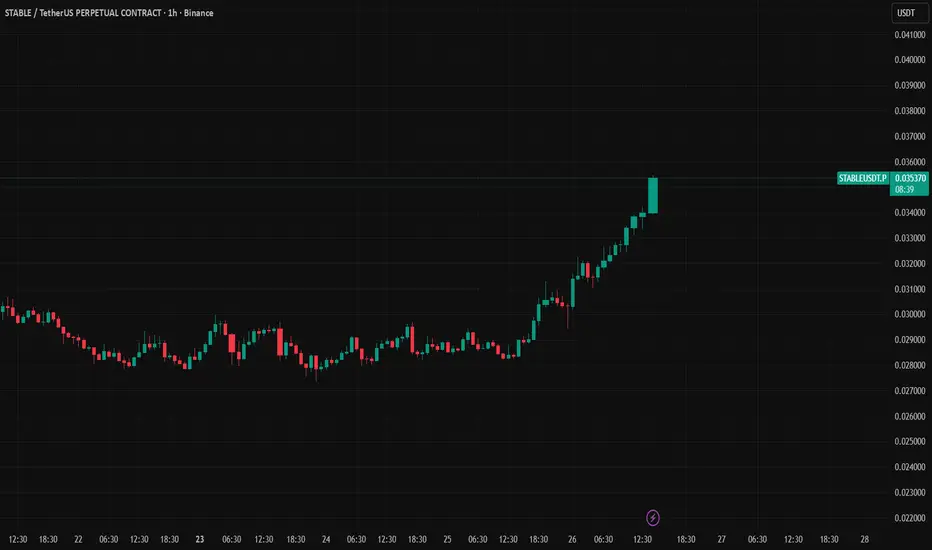
Traders Demon Finder: The Hidden Reason Retail Traders LoseTraders Demon Finder (Live Panel Walkthrough): When a “Perfect Long” Is Still a Trap — and How MARAL Filters It
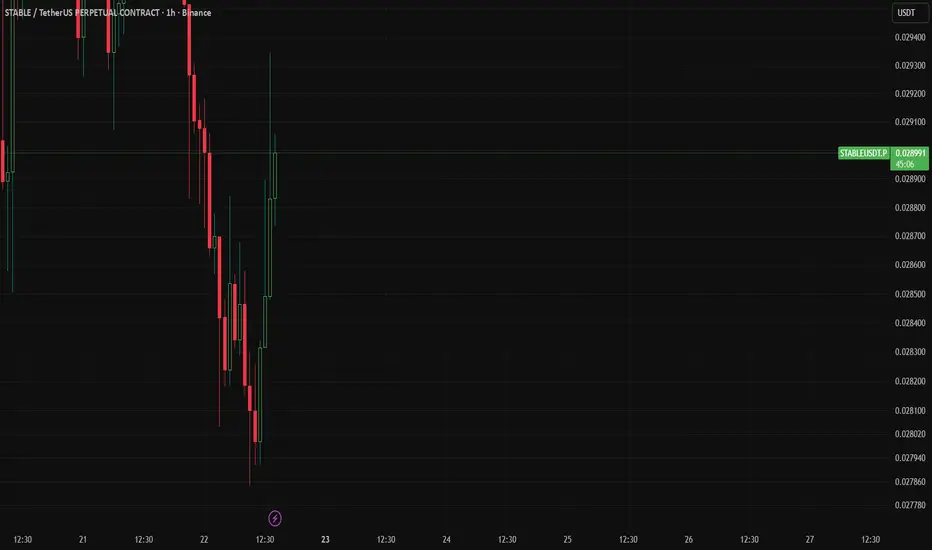
Chart reference: STABLEUSDT.P (1H) with MARAL — Execution Workflow panels (Router + Regime + Cost + Stress Bridge + Cap27)
Retail traders usually lose on moves like this even when the direction is correct.
Not because the market “cheated” — but because the hidden demon shows up:
The Demon = “Permission ≠ Safety”
Retail sees green, sees bullish candles, enters hard…
…and gets puni
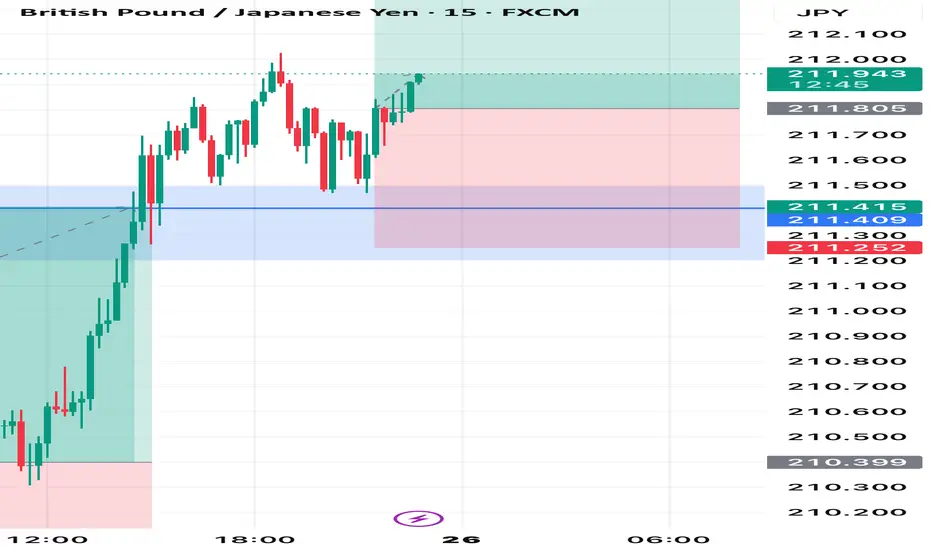
GBPJPY Bullish Bias - 2With very strong bullish power coming in and netting us a profit, I believe GBPJPY still has a good potential to head to the upside, with targets expected upwards of 213.000
Manage risk properly and use proper scaling plan. Risk past profits to ensure mitigation of principal capital.
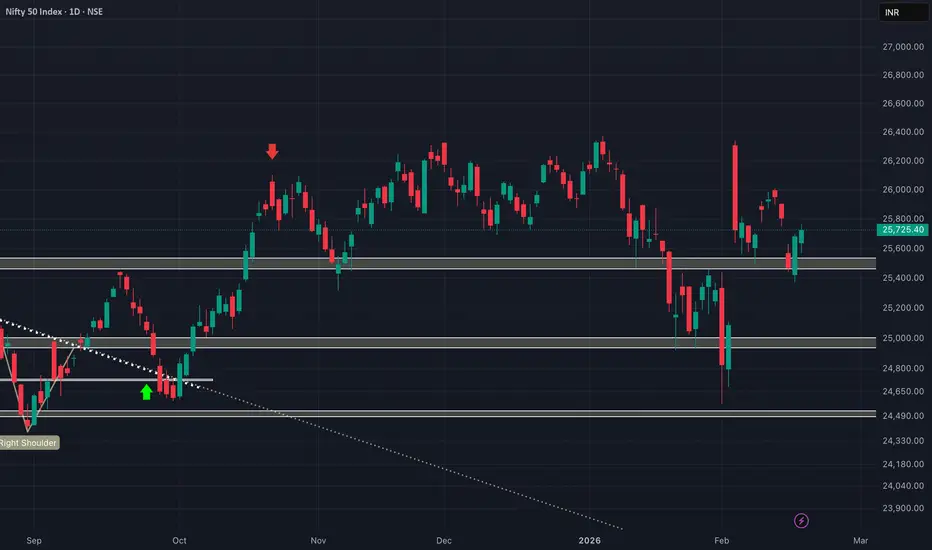
Back at DEMAND ZONE! Another REVERSAL!?As we can see NIFTY can be seen trading at important demand zone which is also supported by the neckline of the head and shoulders pattern hence we nmay expect another strong upmove in NIFTY if manages to close itself above 25450 levels so plan your trades accordingly and keep watching everyone
Bullish Bias Intact — Gap Fill Reversal Loading This WeekAs outlined in my pre-session analysis, the higher-timeframe bias remains clearly bullish — price action is simply confirming the plan. The market opened with a gap that is still unfilled, and inefficiencies like this rarely stay untouched. Expect a controlled reversal to fill the gap within this week — potentially initiated from Tuesday’s move, otherwise likely toward the weekly close.
If you agree with the analysis, comment below after the price action confirms.
NIFTY doesnt looks strong enough!as we can see despite the recovery NIFTY coudlnt form a promising candle above our demand zone which coud result in weakness in coming trading sessions but strong weakness will only follow if NIFTY manages to close itself below the demand zone so plan your trades accordingly and keep watching everyone.
We are back above our demand zone! Signs of BULLISHNESS!?As we can see NIFTY again took support at our demand zone and recovered substancially. Now that it managed to close itself above the demand zone, we may expect NIFTY to continue its upmove unless it breaks below so plan your trades accordingly and keep watching everyone.
IGB 10Y Weekly UpdateIndia Goverment Bonds 10Y for the coming week are expected to trade in the range of 6.65%-6.78%. 6.65% has been acting as a crucial support since last few weeks and it expected to remain the same. If it breaches, this level, it likely to find support at 6.60%, which acted as resistance in the earlier range bound motion. On the upside, if it breaches 6.75% level,it may find resistance at 6.88% levels.
MARAL — Long & Short Permission | Liquidity Print + Entry WindowMARAL — Long & Short Permission | Liquidity Print + Entry Window
A Structured Execution Framework for Liquidity-Driven Markets
This is a new Trading View tool built under the MARAL Execution Workflow system:
MARAL — Long & Short Permission.
In modern markets—especially high-liquidity pairs—price does not move randomly.
It typically moves from liquidity to liquidity.
Breakouts fail.
Highs get swept.
Lows get reclaimed.
Chop destroys R:R.
The problem is rarely the market.
The problem is unstruct
Short Trade – HPCL
• Instrument: Hindustan Petroleum Corporation Limited (NSE)
• Timeframe: 125-minute
Technical Setup
• Confluence Zone:aligned with the 21-period DEMA.
Higher time frame suggest bearish continuation
• Price Action: The stock has rejected the confluence zone, showing weakness below resistance.
Trade Plan
• Bias: Short (bearish)
• Entry Zone: Near 447–449 resistance confluence
• Target: Retest of recent lows around 431 and potentially lower if momentum continues
• Stop-Loss: 25%DATR above th
HEAD and SHOULDERS pattern in NIFTY!!? AS analysed NIFTY fell unidirectionally from our resistance excatly as analysed and managed to close itself around the demand zone hence we may see NIFTY trying to reverse but the broekn demand zone could act as RESISTANCE now so unless it manages to close itself above the demand zone, we might get bearish again leading to continued downfall so plan your trades accordingly and keep watching everyone.
Vodafone Idea VCP bullishVodafone Idea is in Uptrend structure with HH and HL formation.
Chart is making VCP on Monthly TF, price is making a retest as marked via red rectangle (waiting for close of this month, for volume analysis).
Post successful retest, price can reach a new high.
SL can be below the marked rectangle post completion of retest and take profit at next resistance area (marked as horizontal line).
Only for educational purpose, not a trade recommendation.
EUR/USD – Tactical Short
1H Supply Repricing Within Established Bearish Order Flow
Execution Timeframe: 5M | Risk Model: Intraday Tactical Allocation
I. Market Context & Structural Bias
EUR/USD remains in a clearly defined 1H bearish auction structure, characterized by sequential lower highs and lower lows. The latest expansion leg has printed a fresh 1H lower low, confirming downside initiative and continuation order flow.
The current upward move is a corrective repricing phase into
NIFTY might show rejection from here!As we can see NIFTY did show some strong recovery exactly from our demand zone which was well analysed in our previous post. Now after unidirectional rally and gap filling we my see NIFTY getting rejected as GAPS acts as a great resistance hence we may expect a temporary retracement until it continues its upside journey so plan your trades accordingly and keep watching everyone.
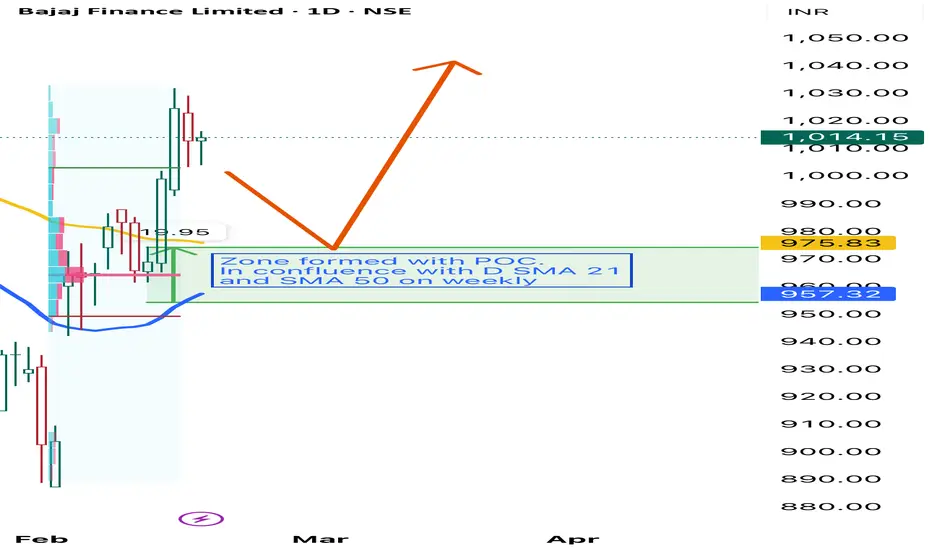
Long Trade Setup: Bajaj Finance• Zone Highlighted: marked as a demand zone with POC.
Trade Thesis
• The highlighted zone acts as a support area, aligned with both the 21-day and 50-SMAs on the weekly chart.
• Price has bounced above this zone, suggesting buyers are defending it.
• The upward arrow indicates potential continuation of the bullish trend.
• Risk–Reward Ratio: 1:3 (favorable).
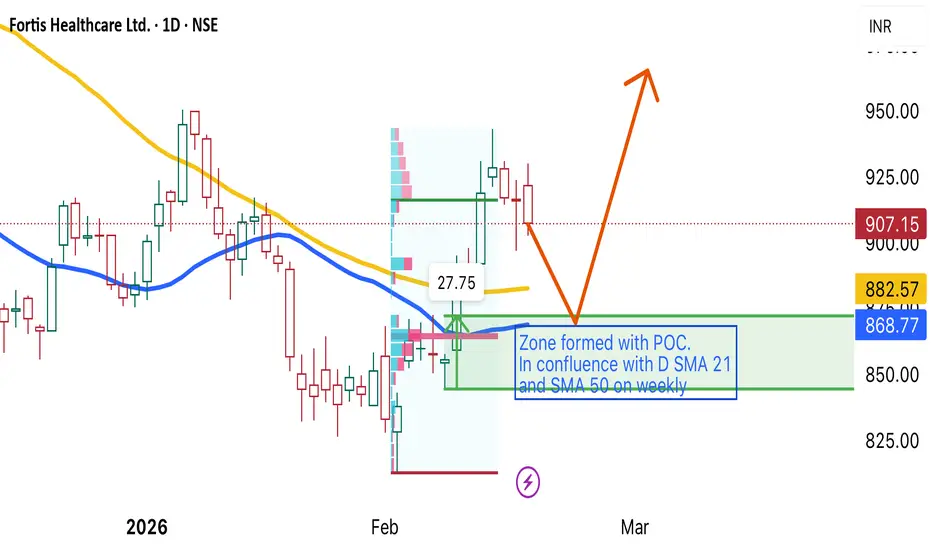
Fortis Healthcare Ltd : Long Trade SetupEntry Zone:
Price has pulled back into a strong demand area formed around ₹882–₹868, which aligns with:
• Point of Control (POC) from volume profile
• Daily SMA 21 support
• Weekly SMA 50 confluence.
Rationale:
The confluence of moving averages and volume profile support suggests institutional buying interest. The recent corrective move appears healthy within the broader uptrend, offering a favorable risk-reward setup for long trade.
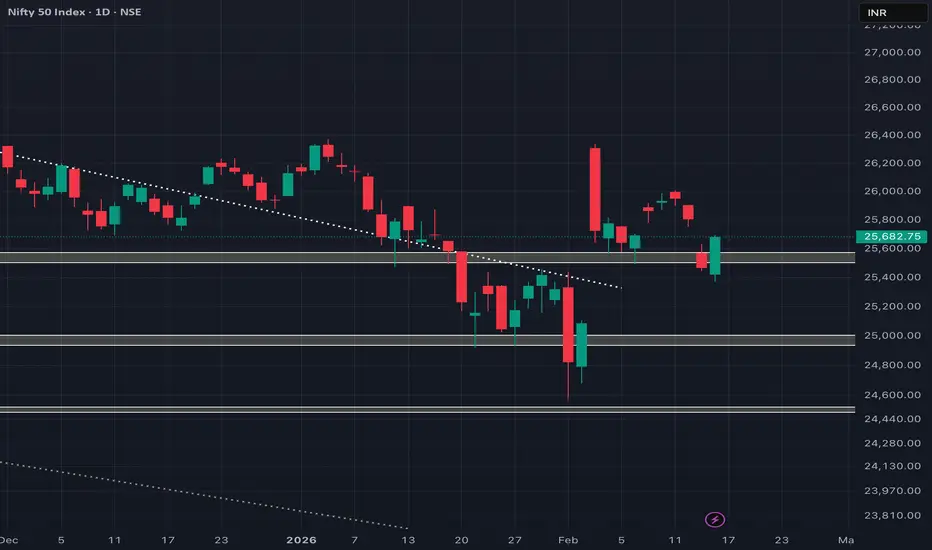
NIFTY to remain bullish above 25500As we can see NIFTY managed to sustain itself above the demand zone and had been bullish throughout the day as analysed in our last post in which we clearly discussed that above our demand zone, every dip can be bought. Now that it has managed to sustain itself above the demand zone, we may see further continuation of bullishness until and until NIFTy manages to close below 25350 levels so plan your trades accordingly and keep watching everyone.
Trade Plan #Nifty50 17th Feb26The first step of a successful trader is to build a Trade plan & review what he has done. (educational purpose for all )
*Trend is up.
*Trade plan: Buy on Dip
* Critical Levels:
* Resistance:25800/26000
* Support: 25687/25572
Jai Hind.
Disclaimer :
This video is only for educational purposes. Please consult your financial advisor before you take any trade.
RECOVERY from our demand zone! Will it sustain!?as we can see NIFTY did show a strong sign of reversal and managed to close above our demand zone which changed changed bias from selling or side to buy-in on dips hence as long as NIFTY manages to sustain itself above the demand zone, it could remain bullish unless the mother candle formed today's low is breached so plan your trades accordingly and keep watching everyone.
Bearishness to continue!!?As we can see NIFTY is back trading in our demand zone and has also closed below it showing signs of bearishness hence if no signs of reversal is seen from here then NIFTY can continue its bear run as 25500 being a pscyhological level will act as a resistance now hence until and unless NIFTY manages to sustain itself above the demand zone, every rise can be sold for next demand zone so plan your trades accordingly and keep watching everyone.
NIFTY will get even weaker below 25750As we can see NIFTY remained negative to sluggish thorought the day exactly as analysed and it’s been 3 days now and expected to remain the unless it breaks and sustains below 25750 levels that will make him even weaker leading him towards immediate demand zone which can show signs of rejection hence we can expect another negative day if our criteria’s are met. So plan your trades accordingly and keep watching everyone