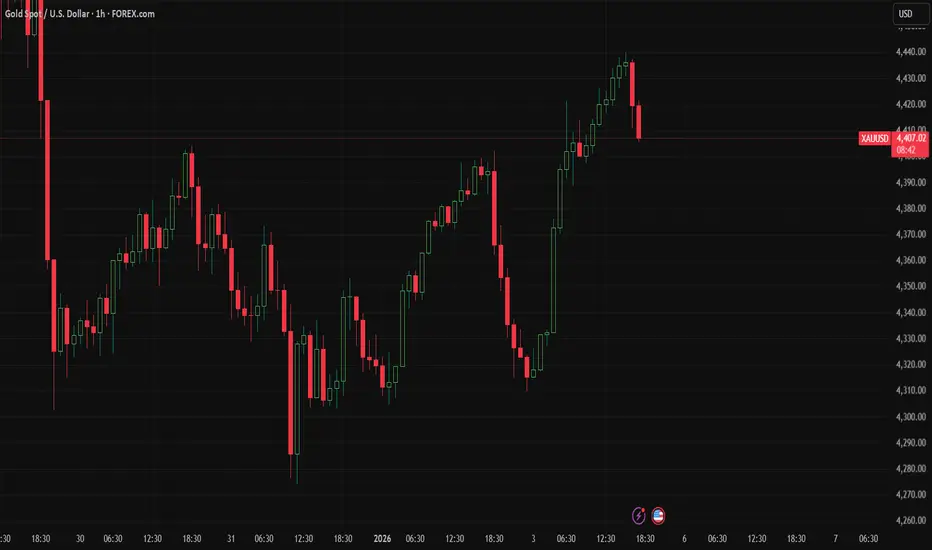
Chapter 11 — Late Entry Trap (What traders keep repeating)Deep Dive on “Late Entry Trap” Mistakes (What traders keep repeating)
(Reference: the attached XAUUSD 1H chart)
This chart is a perfect example of a common trading failure pattern:
1) The real trader problem here (human behavior)
After a strong impulsive move, the brain does something dangerous:
A) “I missed it” becomes urgency
• When price runs without you, it creates pain.
• That pain turns into a decision like: “I must enter now to fix the regret.”
• This is not analysis. It’s emotional com
Multiple Time Frame Analysis
NIFTY might get rejected from here!AS we can see NIFTY is heading towards new ATH for NIFTY but it seems like this a strong supply zone hence despite breaking new ATH, we may see NIFTY getting rejected from here so any signs of rejection from here can show good downside so plan your trades accordingly and keep watching everyone.
Strong RECOVERY exactly as analysed! But will it sustain!?As we can see NIFTY recovered sharply exactly as analysed as it took support at our demand zones! But it is too quick now to judge the upcoming trend by single day move as it could be a sentiment based volume which doesn’t last long. Hence as long as NIFTY doesn’t crosses and closes itself above previous swing, shorting at signs of rejection around supply zones can be done so plan your trades accordingly and keep watching everyone.
SIGN of REVERSAL!?As we can see NIFTY did manage to form more like a doji called showing indecision around our demand zone. This shows we are trading at demand zone but yet to test the trendline support hence a great would be when we could see a sign of reversal around the trendline so plan your trades accordingly and keep watching everyone
BTC Weekly downtrend & Potential Reversal zoneson 27th Oct, BTC had its buyside sweep on Daily chart and later confirmed to be the Lower High for its weekly bearish trend reversal.
(Marked with grey arrow)
Earlier we had the bullish fib marking 2nd swing target of 124.4k & that marked the end of bullish trend in October this year.
With current weekly downtrend, we have 1st , 2nd & 4th swing targets.
(refer to the red downward fib)
1st swing target zone - 90.9k till 82.1k
2nd swing target zone - 73.2k till 64.4k
( this is also confluenc
BUY THE STRONGEST ONE_PFOCUS_LONGTERM TRADEHi traders,
Posting the interesting Topic on PFOCUS with Technical Analysis long-term view.
Currently PFOCUS is trading at INR 241.86 with longer term bullish Veiw.
Entry at current level with stoploss of 12 Months low. Ride the trend until it closes previous yearly low price or Market Structure.
Note:_ Only for Educational purpose Since investments in Securities and market are subjected to market risk
Target achieved !! Will NIFTY show respite from here!?As we can see NIFTY had been falling unidirectionally and is about to reach the trendline support which previously acted as a resistance. Hence we might see a recover arise 25850-900 levels but will only trade is signs of reversal is witnessed so will plan trade according to the market sentiment. Our targets achieved.
More weakness coming in!?As we can see NIFTY had been falling unidirectionally from our supply zone as analysed. now we can expect NIFTY to fall even more covering the gaps and testing the trendline and act as a retest to trendline before finally taking support at the trendline and continuing its upmove so plan your trades accordingly and keep watching everyone.
KEI LONG SETUPLogic : KEI is on Uptrend and is trying to break the consolidation on the weekly, entering long on the 125 mind marked demand zone would be a good opportunity. The stock has tried to break the previous high and is retracing too.
The zone also co incides with 50% length of the weekly candle.
Keep strict SL below the zone
NBCC LONG setupLogic: Nbcc has been in Uptrend on Daily and weekly. The demand zone formed is evident on most time frames.
2 scenario can be seen
Scenario 1: if price tries to retrace to the level then entering long is definitely an opportunity
Scenario 2: if price does not retrace and a small inside candle is formed on the daily time frame, then entering long on break of the high of the candle as marked can be a equivalent opportunity, the reason behind, as price may not retrace on strong uptrending stock
WAAREE ENERGIESWAAREE Energies | Daily TF | SMC Setup
Price has entered a strong bullish Order Block (Demand zone) after a corrective move.
Clear bearish BOS earlier, but current candles show order flow shift and buying reaction from the OB.
📌 Trade Plan (Pullback Buy):
Buy Zone: 3000–3050
SL: 2880 (Daily close below OB = invalidation)
🎯 Targets:
T1: 3300–3350
T2: 3600–3650
T3: 3850–3900
📊 Logic:
OB respected with strong rejection
Minor structure shift inside demand
Expect pullback → continuation t
BAJAJ AUTO LONG SETUPLogic: BAJAJ AUTO is creating an up flag pattern on the weekly, followed by uptrend on the Daily.
The marked demand is strong setup.
Inspite of the fact that a stronger zone exist below that zone, but with understanding that if prices retrace into the below level the strength might be lost for an upmove.
The zone also is near 21 DEMA level.
Hence considering that and keeping strict SL below the marked level of atleast 10%DATR, long opportunities can be seen.
NIFTY back on track! Weakness to continue!!as we can see NIFTY started to get rejected exactly from our given supply zone. Now, we can expect NIFTY to remain weak until and unless it sustains itself above 26200 so every rise can ve shorted keeping sl on closing basis above the supply zone so plan your trades accordingly and keep watching everyone.
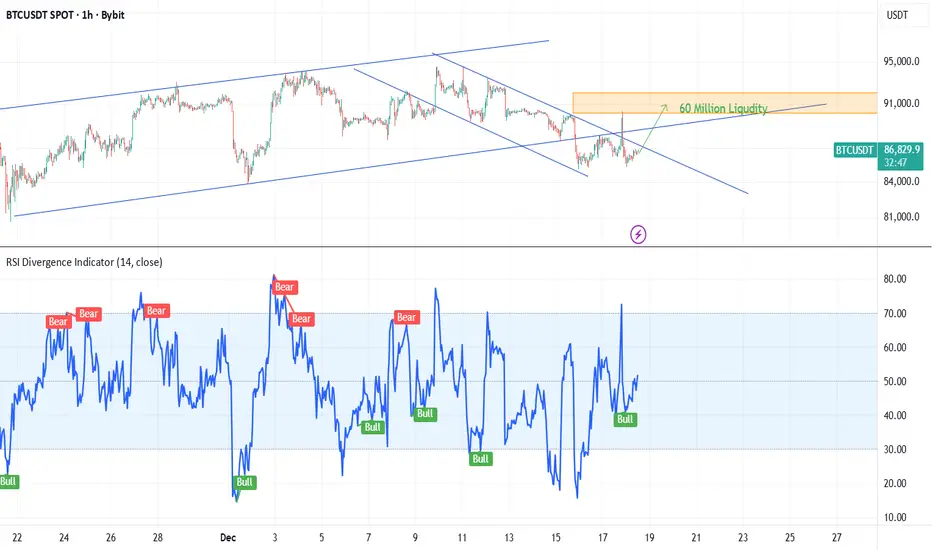
60 million Liquidity Built-up again on top BTC could not break 85k. Instead, it created a bullish divergence on 1 hour, and there is no liquidity on the down; most of the liquidity still exists on top, around 60 million
If this push-up happens again, that will set 4-hour Divergence into bullish, so 95k, I'm still in the picture
1. 90200 - 60% Probability
2. Drop in the US Market 25%
3. Raise the rally before Christmas to 100k 25%
SIGNS OF REJECTION!?As we can see NIFTY did take a halt and has formed more like a doji kinda candle in daily time frame which shows its rejection from 26200 supply zone! Hence we will stay negative until and unless this doji candle is broken above and sustained so plan your trades accordingly and keep watching everyone.
India Indices (4H) — MARAL Execution Workflow (WAIT / SKIP) India Indices (4H)—MARAL Execution Workflow (Technical WAIT/SKIP Example)
(NIFTY • SENSEX • BANKNIFTY • CNXFINANCE—educational only, no trade call)
These snapshots show an important execution concept:
Bullish higher-timeframe context can exist, while execution permission remains OFF.
MARAL separates bias (Context Board) from permission (Qualification Gate) and regime/risk (Management Desk).
When the gate reads SKIP, the correct action is WAIT—even if the bias looks supportive.
1) What the pa
STRONG UPMOVE in NIFTY! is this a Trap!?As we can NIFTY finally managed to close above 26150 but this doesn't confirms the further continuation of upmove , it could be a potential trap as weekly candle is yet to form and its just a first day. We can see a strong g supply zone around 26200 which NIFTY might break above inviting buyers before finally continuing its fall. Hence for now, I will wait for both weekly candles formation as well as closing above 26200. So, plan your trades accordingly and keep watching everyone.
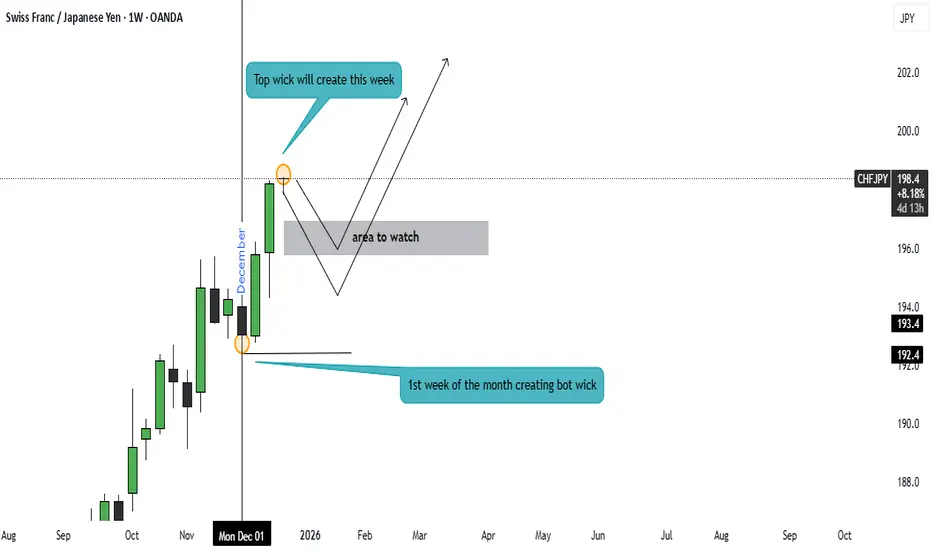
CHFJPY – Monthly Top Wick Expected This Week.Waiting for 2026CHFJPY is currently in a higher-timeframe bullish structure.
This week, price may form a top wick on the monthly candle, indicating short-term pause or consolidation.
From the second week of January, if volume supports the move, bullish continuation to the upside is expected.
This is a higher-timeframe bias and roadmap, not a lower-timeframe entry signal.
Waiting for confirmation before taking any position.
NIFTY isn't bullish unless it sustains itself above 26050!As we can see NIFTY showed strong closing past 2 trading sessions which was well anticipated and discussed in our previous post i.e after continuous weakness, we might expect a short covering move and it happened. Now, standing by our analysis, until and unless NIFTY sustains itself above 26050-26100 level, every rise can be sold. so plan your trades accordingly and keep watching everyone.