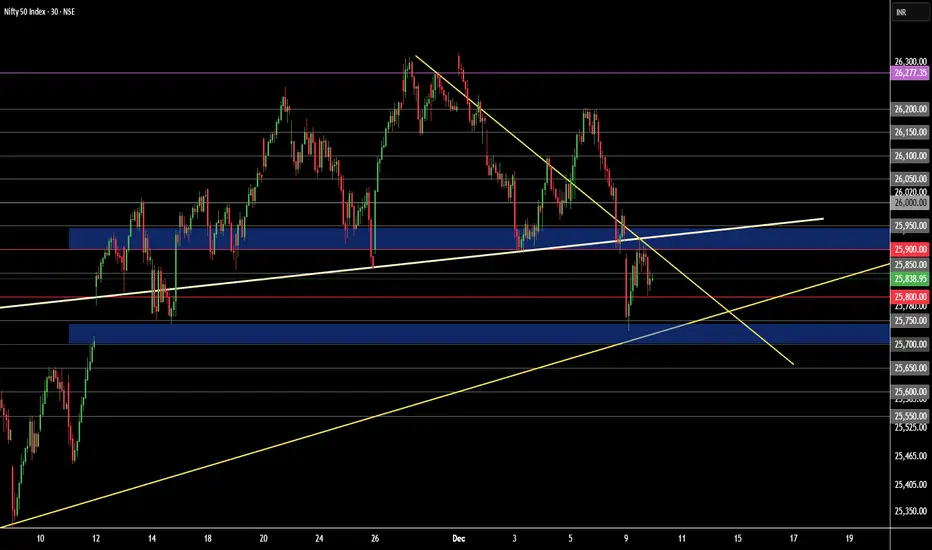
Strong downfall coming below 25700!As we can see NIFTY did show some recovery exactly as analysed in our previous post but despite that it couldn't hold itself above and fell showing bearish dominance. Now, we can expect Nifty to show some respite due to US's inflation news but will maintain its bearish rally in longer run so plan your trades accordingly and keep watching everyone.
Multiple Time Frame Analysis
Shriram Fin (D): Cautiously Bullish - Breakout with IndecisionTimeframe: Daily | Scale: Linear
The stock has attempted a breakout from a multi-week consolidation range, hitting a new All-Time High. However, the formation of a Neutral Candle on high volume signals a fierce battle between buyers and sellers at the top. The breakout needs confirmation.
📈 1. The Chart Structure (Consolidation)
> The Range: The stock has been trapped between ₹820 (Support) and ₹870 (Resistance) .
> The Breakout Attempt: Today (Dec 18, 2025), the stock pierced the
NIFTY continues in our direction.As expected NIFTY remained weal throughout the day after getting rejected from 26050 level. Now, we don't see any eminent Support that could lead in strong recovery but we may see small upmoves in daily time frame before finally achieving our target so 25500. so, plan your trades accordingly and keep watching everyone.
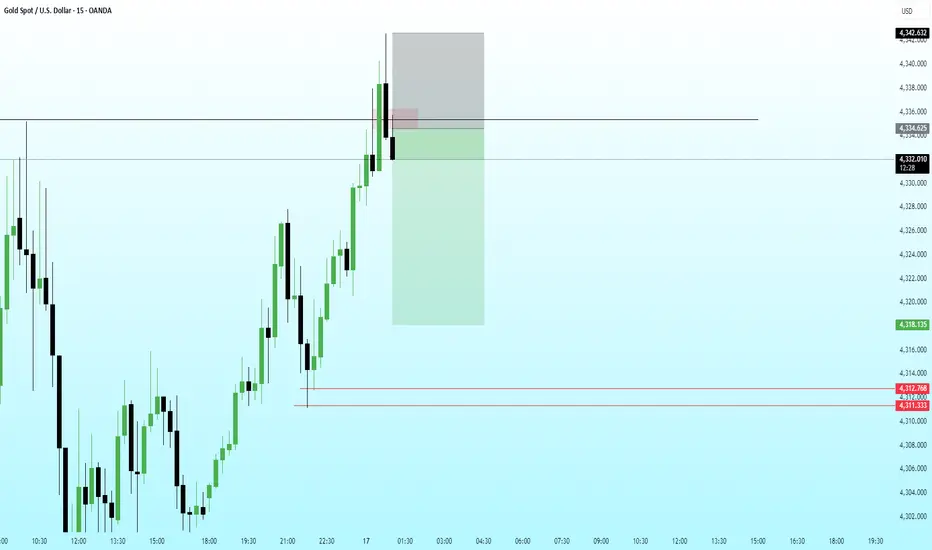
XAUUSD (Gold) – 15M | SMC Trade IdeaPrice has delivered a clean impulsive bullish leg, displacing above prior structure and confirming bullish BOS on the 15M timeframe. The move was followed by a brief pause, forming a premium supply reaction, which is now being used as a mitigation entry.
SMC Context
Strong bullish displacement confirms institutional intent
Entry aligned at discount to premium flip after BOS
Stop placed above the protected high to invalidate bullish narrative
Targets aligned with liquidity resting below equa
NIFTY back on track towards 25500!?As we can see NIFTY got rejected exactly as analysed and fell unidirectional based on our analysis. Moreover we can see NIFTY forming head and shoulders pattern in bigger time frame which is a bearish sign hence we can expect NIFTY to continue its bear run as long as it sustain itself below 26050 so plan your trades accordingly and keep watching everyone.
We are still below 26050!!As we can see NIFTY despite opening weak, we saw strong recovery in index but despite that it couldn't close above 26050 which could confirm the upmove but now that it couldnt close above the given zone, we are still weak and can result in negative bias so plan your trades accordingly and keep watching everyone.
PowerGrid – A Steady Dividend GiantPowerGrid has consistently rewarded investors with strong dividend payouts, backed by stable cash flows from its transmission business. The chart reflects resilience even in volatile markets, making it a reliable choice for long-term dividend income seekers. With government backing and steady expansion, it remains a defensive play in any portfolio.
Can NIFTY hold itself above 26000 level!?As we can see NIFTY managed to close itself above 26000 but despite that being a strong supply zone we might expect NIFTY to show some rejection from here. Hence, following the cues, we can expect NIFTY to show weakness in coming trading sessions unless it manages to close itself above 26050 level. So, plan your trades accordingly and keep watching everyone.
Weekly Wrap : #Nifty50 How strong a rebound will be?First Step of a successful trader is to build a Trade plan & review what he has done. (education purpose for all )
*Trend is up.
*Trade plan: Buy on Dip
* Critical Levels:
* Resistance:26180/26300
* Support: 25900/25800
Jai Hind.
Disclaimer :
This video is only for educational purposes. Please consult your financial advisor before you take any trade.
We might see NIFTY getting REJECTED at 26000!!As we can see NIFTY got rejected from the gap which acted as a strong demand zone and showed strong recovery, Despite the recovery there are multiple supply zones from where NIFTY can reject and the major one is 26000 level which is also a psychological level so we can expect NIFTY to remain volatile tomorrow so plan your trades accordingly and keep watching everyone.
Nifty 50 Price Structure Analysis [12/12/2025: Friday]Top-Down Nifty 50 Price Structure Analysis for 12th of December 2025. The day is Friday.
(1) Monthly Time Frame:
Red piercing candle. Powerful support is at the level 25700. Level 25700 zone is strong as it was the closing level for the month of October 2025 and the opening level for the month of November 2025. In November, the price broke down the level 25700 but again regained its level above it. Similarly, this month's price touched the level of 25700 and showed strong buying interest. Th
25500 is coming up!!As we can see NIFTY had been weak throughout the day as analysed in our previous post. Now, we can see a pending gap which is yet yo be filled. Hence, we can expect NIFTY to continue its bearishness till 25500 which is its next important demand zone so plan your trades accordingly and keep watching everyone.
Nifty 50 Price Structure Analysis [11/12/2025: Thursday]Top-Down Nifty 50 Price Structure Analysis for 11th December 2025. The day is Thursday.
(1) Monthly Time Frame:
Red marubozu. Red piercing candle. The green body of the previous month is almost engulfed. It is an inside month so far with a bearish bias. Clear signs of trend reversal. No sign of bullishness. Major resistance is at level 25900. Minor support is at level 25700. The view is indecision to bearish.
(2) Weekly Time Frame:
Perfect red marubozu after a red hanging man candle. It
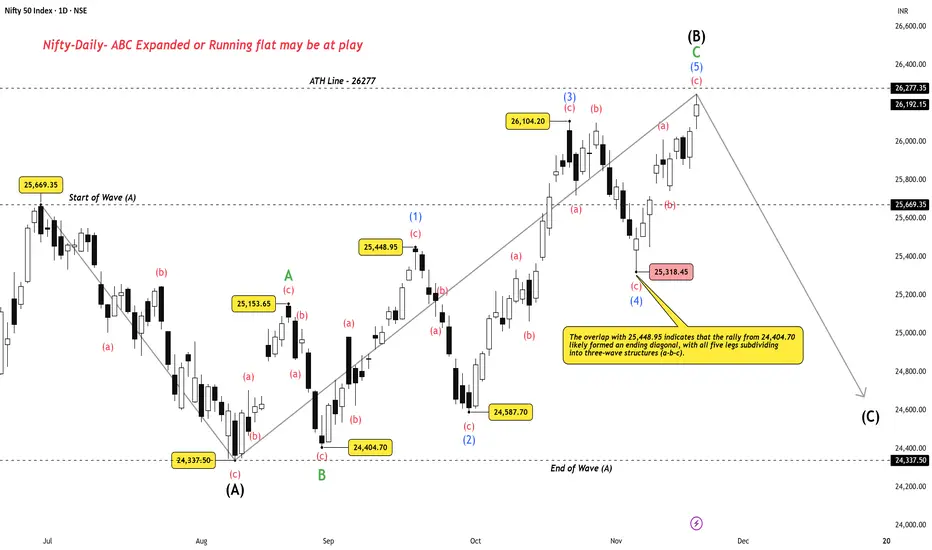
Why Nifty’s Ending Diagonal Turns the Bias BearishAfter my previous bullish take on Nifty (see linked related publications), the view has now flipped.
And no — it’s not because the US indices are cracking.
And no — it’s not because Bitcoin is collapsing and draining liquidity.
Those may add pressure, sure.
But the core reason I’m turning bearish is right on the chart — in the structure itself.
Daily Chart – Why the Tone Has Changed
The key shift came from the overlap at 25,448.95 , which strongly hints that the rally from 24,404.70 unf
NIFTY heading towards 25500!As we can see NIFTY continued its bearish sentiment and had been bearish throughout the day. Now, following the structure , we can expect NIFTY to continue its bearishness until a strong demand zone comes up which can be seen around 25500 so we can target that level so one can plan their trades accordingly.
Nifty 50 Price Structure Analysis [10/12/2025: Wednesday]Top-Down Nifty 50 Price Structure Analysis for 10th of December 2025. The day is Wednesday.
(1) Monthly Time Frame:
Red piercing candle. Sign of indecision and trend exhaustion. Major resistance is at level 26000. Major support is at level 25700. The view is indecision to bearish.
(2) Weekly Time Frame:
Red marubozu with weak lower wick. The previous week's candle is also a red hanging man. Today's price gave a breakdown below 3 weeks of consolidation. Signs of trend reversal and previou
Nifty 50 Price Structure Analysis [09/12/2025: Tuesday] Top-Down Nifty 50 price structure analysis for 09th December 2025. The day is Tuesday.
(1) Monthly Time Frame:
Red indecisive candle. Major resistance is at level 26100. Minor support is at level 25900. The view is indecisive to bearish.
(2) Weekly Time Frame:
First day of the week. Today's red candle confirms that last week's red paper umbrella was a hanging man. Clear sign of trend reversal. Major resistance is at level 26100. Minor support is at level 25900. The view is bearish.
(3
Weekly Wrap : #Nifty50 Bulls are here to stay? First Step of a successful trader is to build a Trade plan & review what he has done. (education purpose for all )
*Trend is up.
*Trade plan: Buy on Dip
* Critical Levels:
* Resistance:26300/26470
* Support: 26060/25950
Jai Hind.
Disclaimer :
This video is only for educational purposes. Please consult your financial advisor before you take any trade.
NIFTY – Multi-TF Breakdown | Structure, Levels & What Comes Next📌 Higher-Timeframe Bias (1D)
Nifty continues to respect bullish market structure on the daily timeframe, holding above the recent Break of Structure (BOS) and defending the previous demand zone.
Key notes from the chart:
Price rejected from the premium zone near 26,350–26,400 (EQH area + weak high).
Strong reaction from the discount OB + FVG around 25,350–25,450 zone.
As long as Nifty holds above 25,800, higher-timeframe bullish bias remains intact.
Daily Structure:
HH → HL sequence intac