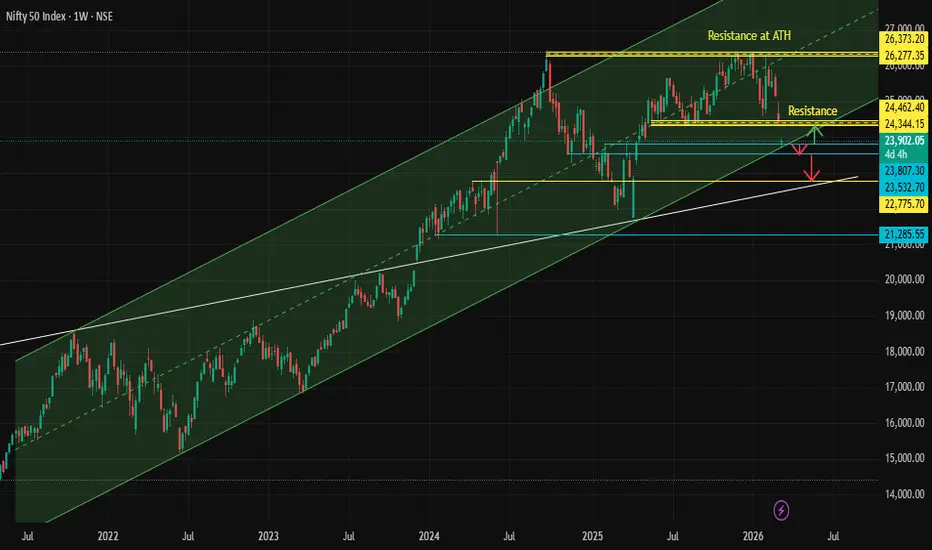
NIFTY Weekly UpdateNIFTY has seen one of its worst weekly falls, losing 5.3% amid geopolitical tensions in West Asia, rising oil prices, and supply shortages due to the closure of the Strait of Hormuz. This is the first time the NIFTY has fallen this much since June 2022.
For the coming week, 22,800 can act as a good support level. If it breaches this, the previous swing low of 21,800–22,000 can act as support. On the upside, 23,850 should act as a resistance level, with 24,400 beyond it.
Let me know your thoughts. DYOR.  Short
Short
 Long
Long
 Long
Long
Shortterm Investment - Buy MindaCorpHere's a breakdown of the **positives for buying Minda Corporation (MINDACORP) as a Short-term investment**:
Apart from the Strong Technical, added the following Fundamentals of the Stock.
**Strong & Growing Financials**
Net profit has risen for four consecutive quarters, growing from ₹52 Cr to ₹85.7 Cr, with an average quarterly increase of around 14.8%. Revenue has also grown for five straight quarters, averaging 5.2% growth per quarter.
**Record Revenue Performance**
The company recently posted a record quarterly revenue of ₹1,560 crores, reflecting a robust 25% year-on-year increase fueled by strong demand across vehicle segments.
**Ambitious Revenue Target**
Minda Corp is targeting ₹17,500 crore in revenue by 2030, implying a 22% CAGR, including ₹4,000–₹4,500 crore from acquisitions. That's a very aggressive growth ambition.
**EV & Future-Ready Business**
Strategic partnerships in EV power electronics are enhancing market access, and recent trade agreements with major economies promise further expansion. The company is also developing advanced driver assistance systems (ADAS) and launching new products.
**Diversified Product Portfolio**
Minda Corporation manufactures a diverse range of automobile components for two and three wheelers, passenger vehicles, commercial vehicles, and off-road vehicles, and operates across India, Asia, Europe, North America, and South America.
**Institutional Confidence**
Institutional investors hold a 27.52% stake in Minda Corporation — a level that typically reflects confidence in the company's fundamentals and governance, as these investors conduct thorough due diligence.
**Short-Long - Term Bullish Trend**
The stock is maintaining a bullish long-term trend, trading above both its 150-day and 250-day moving averages.
**Strong Debt Servicing & Margins**
Quarterly results for December 2025 showed operating profit margin improving to 11.76%, the highest ever recorded for the company.
**A note of caution:** I'm not a financial advisor, and this is not investment advice. The stock currently has a **"Hold" rating** from some analysts, and has seen some short-term price weakness. Always do your own research or consult a SEBI-registered financial advisor before investing. Investment Doubler - Buy Chennaipetro
**CHENNAI PETROLEUM CORPORATION LTD (CPCL) — Monthly + Weekly Multi-Timeframe Analysis**
CPCL is currently trading at **₹1,065**, breaking out above the **1.0 Fibonacci extension (₹1,022.85)** on the monthly chart, with **12 days remaining** to confirm the monthly candle close.
**Monthly Timeframe — Fibonacci Breakout:**
- Price bottomed near **₹450** in early 2025 and has since staged a powerful recovery
- Currently breaking out of a highlighted consolidation zone (green box)
- Monthly close above ₹1,022 confirms continuation toward:
- **Tgt 1 — ₹1,178** (1.272 extension)
- **Tgt 2 — ₹1,275** (1.414 extension)
- **Tgt 3 — ₹1,376** (1.618 extension)
**Weekly Timeframe — Cup & Handle Pattern:**
- A large **Cup & Handle formation** is projected on the weekly chart spanning approximately **2028–2030**
- The cup bottom is projected around **₹400**, with the handle forming near **₹750–800**
- A breakout from this pattern would set up a much larger long-term move, confirming the bullish macro structure
**Key Takeaway:**
Two powerful patterns aligning across timeframes — a **near-term Fibonacci breakout** on the monthly, and a **longer-term Cup & Handle** on the weekly — both pointing toward sustained bullish momentum for CPCL over the coming years.
**Bias:** Strongly bullish on both short and long-term timeframes, subject to monthly candle confirmation.
Disclaimer:
The analysis and chart shared here is purely for educational and informational purposes only and should not be construed as financial, investment, or trading advice. I am not a SEBI-registered research analyst or financial advisor.
The views expressed are based on personal technical analysis and are subject to change without notice. Past performance of any stock is not indicative of future results.
Investing in the stock market involves substantial risk of loss. Please do your own due diligence and consult a certified financial advisor before making any investment decisions.
I hold no responsibility for any profit or loss arising from the use of this information. Trade and invest at your own risk.  Long
Long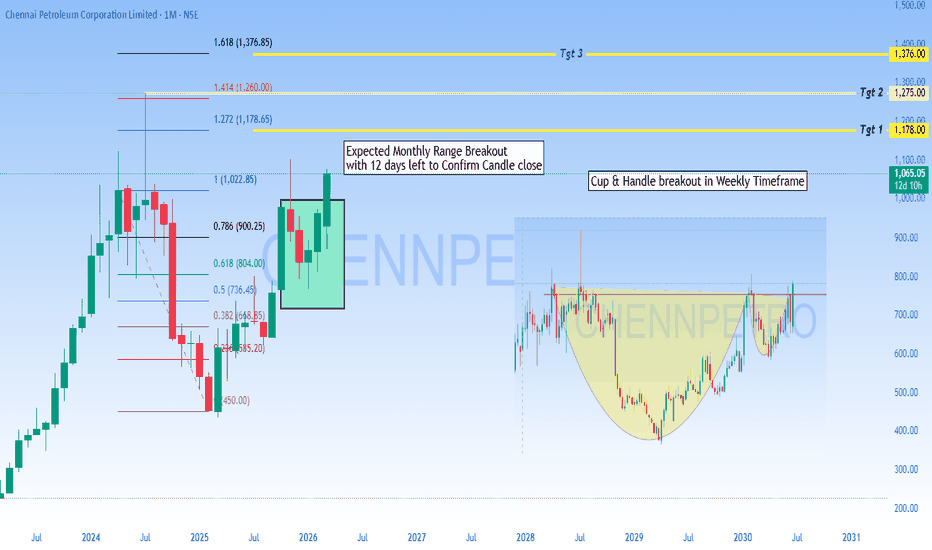
MARAL — Dynamic Risk MapperMARAL — Dynamic Risk Mapper- New script
From static trade levels to live execution intelligence
Most trade-management tools stop at drawing a few levels.
They show an entry, a stop, a target, and leave the trader alone once price starts moving.
But in live markets, that is exactly where the real problem begins.
A trader does not struggle only with where to enter.
A trader struggles with what happens after the trade is mapped:
Is price still respecting the entry zone?
Is invalidation pressure increasing?
Is TP1 close enough to require management?
Is the trade still healthy, or is momentum fading?
If price moved toward SL and came back, is that a real recovery or just noise?
Should the trader hold, protect, reduce, or exit?
That is the purpose of MARAL — Dynamic Risk Mapper Pro.
This script is built as a discretionary trade-mapping and management-support framework designed to help traders read the evolving condition of a mapped trade in a more structured and practical way.
It is not an automated system.
It does not place orders.
It does not guarantee outcomes.
It is a workflow tool built to improve clarity, execution discipline, and live management awareness.
Why this tool was built
Most traders already have enough chart tools.
What they often do not have is a system that can help them read the relationship between:
entry
invalidation
managed stop
target structure
pressure
recovery behavior
action response
in one live framework.
The goal of MARAL — Dynamic Risk Mapper Pro is to convert a manually planned trade into a living management map.
The trader provides only two core inputs:
Trade Side
Manual Entry Price
From there, the script organizes the trade into a dynamic map that continuously evaluates how price is behaving relative to that trade.
This makes the chart less about static lines and more about execution interpretation.
What the script does
Once a trade is defined, the script can map:
Base SL
Managed SL
TP1 / TP2 / TP3
invalidiation zone
momentum condition
confidence context
recovery behavior
live management posture
Instead of only asking, “Where is my stop?”, the script helps the trader ask:
What is this trade doing right now?
That shift matters.
Because a trade is not only a price level.
It is a condition that changes over time.
The example chart
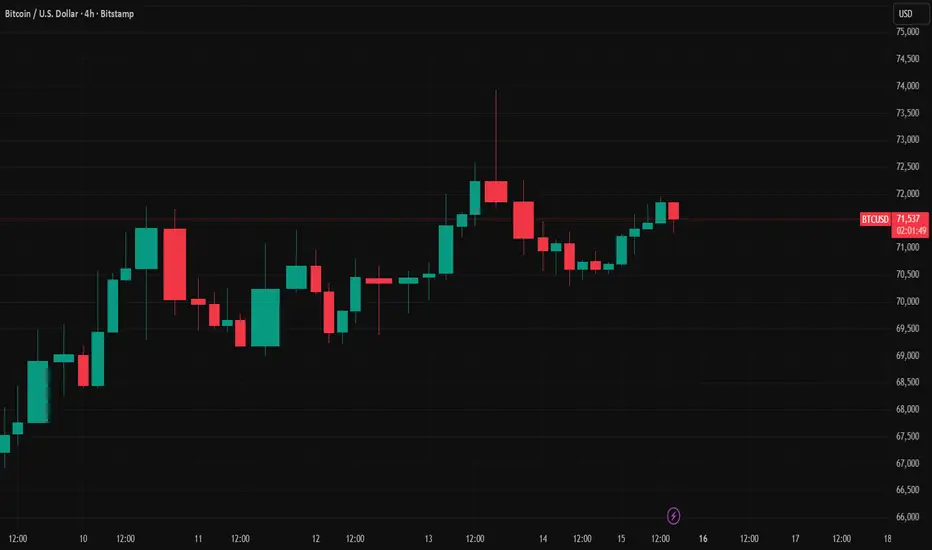
This example uses BTCUSD on the 4-hour chart with a manually defined Long entry at 71,200.00.
The script has mapped:
Entry at 71,200.00
Managed SL below the trade
higher target structure above price
live panel output on the right side of the chart
What makes this example useful is that it is not showing a fully expanded winner.
It is showing a more realistic live situation:
price is still around the entry area,
momentum is not yet cleanly expanding,
the trade remains valid,
but stronger acceptance is still needed.
That is exactly the kind of situation where traders usually become emotional or impatient.
This is where the script adds value.
Panel 1 — Dynamic Risk Mapper
The first panel is the live location panel.
It explains where price is relative to the mapped trade.
In this example it shows:
Side = Long
Entry State = Near Entry
Candle Bias = Bear
Zone = Entry Zone
SL State = Safe
TP1 State = TP1 Far
Event = Trail Update
Confidence = 6.3 / 10 | Moderate
What this means
The trade is mapped for a long-side idea, but price is still working around the entry region.
The chart is not showing a clean breakout away from entry yet.
That is why the script classifies the trade as Near Entry and Entry Zone rather than “cleared” or “expanding”.
The Candle Bias = Bear reading is important.
It means the immediate candle behavior is not fully aligned with the long-side trade.
That does not automatically invalidate the map, but it does reduce short-term conviction.
At the same time, SL State = Safe tells the trader that price is not yet under immediate stop-pressure conditions.
So this is not a panic state.
It is a patience state.
TP1 State = TP1 Far also matters.
It means the trade has not reached the stage where active target-management should dominate the trader’s decision.
And the Confidence = Moderate reading communicates the exact balance of the situation:
the map is active,
the trade is still usable,
but the environment is not yet strong enough to justify aggressive confidence.
This is one of the main advantages of the tool:
it gives the trader a structured way to recognize the difference between valid and fully favored.
Those are not the same thing.
Panel 2 — Management Response Desk
The second panel is the behavior panel.
It does not focus on where price is.
It focuses on how the mapped trade is behaving.
In the example it shows:
Trade Status = Valid
Momentum = Weakening
Pressure = Low
TP1 Response = Wait
Action = Hold
What this means
The trade has not failed.
The structure is still valid.
But price is not yet delivering the kind of strong follow-through that would justify more aggressive trade confidence.
That is why Momentum = Weakening is an important reading here.
The script is not saying the trade is broken.
It is saying the trader should not confuse a valid map with a strong expansion.
This is a critical distinction in real trade management.
The Pressure = Low output is also important.
It tells the trader that while momentum is softer, the trade is not yet under high invalidation stress.
The script therefore avoids overreacting.
Then the panel shows:
TP1 Response = Wait
Action = Hold
This is another major design advantage of the tool.
Instead of forcing premature management decisions, the script recognizes that TP1 is not yet the dominant problem in this chart state.
So it does not push unnecessary partial exits or over-management.
The posture remains calm:
the map is valid,
pressure is controlled,
but stronger confirmation is still needed.
Panel 3 — Trader Guidance Panel
This is where the script becomes especially practical.
The third panel translates the live state into clear sentence-style guidance.
In the example it says:
Comment: Price is testing the entry zone.
Risk Note: The entry is active only if the zone is respected.
Next Step: Wait for acceptance before holding with confidence.
This is one of the strongest practical advantages of the script.
Most tools give technical status.
Very few tools convert that status into a readable live instruction.
This panel is designed to reduce confusion and emotional overreaction by turning technical conditions into operator guidance.
Not signals.
Not promises.
Not predictions.
Guidance.
That is a very important difference.
What this example really teaches
This example is not a chart where everything is already perfect.
That is why it is a good example.
It shows a mapped long trade that is:
still structurally valid
not under immediate stop pressure
not close enough to TP1 for target-driven management
but still lacking clean expansion away from entry
That is a realistic condition many traders face.
Without a structured map, this is exactly where traders start making mistakes:
entering too aggressively
doubting too early
tightening too soon
taking profit too early
holding with false confidence
confusing survival with strength
The script helps separate these conditions.
It helps the trader understand that:
a trade can still be valid without yet being strong.
That single distinction can improve trade-management discipline significantly.
Advantages for traders
1) Better live trade awareness
The script helps traders understand where price is relative to entry, SL, and TP structure without relying only on visual estimation.
2) More disciplined invalidation reading
Instead of reacting emotionally when price moves toward risk, traders get structured context around:
stop pressure
risk zone behavior
recovery watch
recovery confirmation
3) Clearer target-management timing
The script does not treat all target conditions the same.
It helps traders distinguish between:
TP still far
TP approaching
TP reached
target response required
4) Stronger post-entry clarity
Many tools are strongest before entry and weakest after entry.
This script is designed to stay useful after the map is active.
5) Plain-language guidance
The commentary panel reduces mental noise by converting market condition into direct trade-management language.
6) Engineering-style workflow
The structure is designed to feel more like a management console than a simple indicator stack.
That helps traders work with process, not impulse.
What this tool is not
This script is not:
a broker-connected system
an automated execution engine
a guaranteed target model
a buy/sell recommendation service
a replacement for personal judgment
It is a trade-mapping and management-support framework built to help traders operate with more structure.
Final note
Markets do not become easier because a few lines are drawn on the chart.
They become more manageable when the trader can understand:
where the trade is
what condition it is in
what pressure is changing
what response is appropriate now
That is the purpose of MARAL — Dynamic Risk Mapper
It is built to help traders move from static trade marking
to live execution intelligence.
Note : Education purpose only
 Education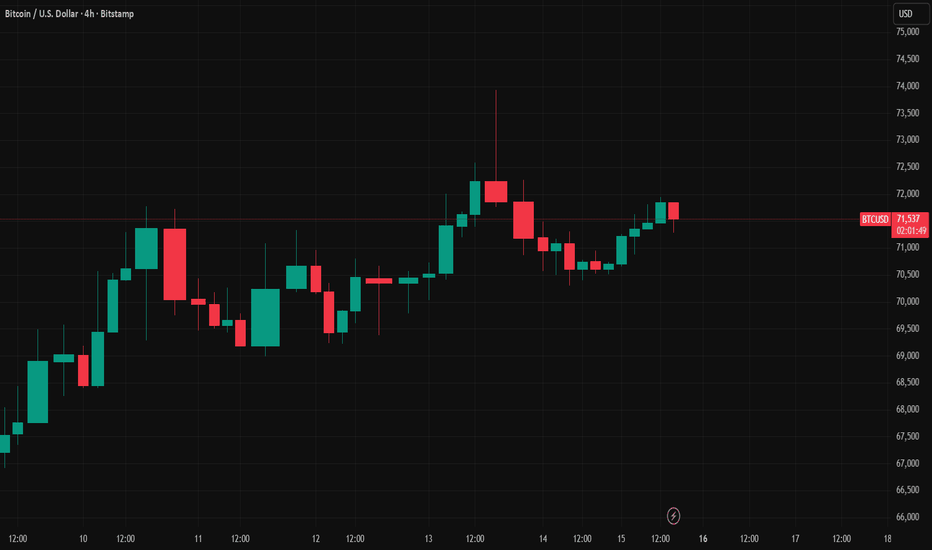
MARAL Execution Workflow — Turning Chart States into Live AlertsThe attached BTCUSD chart is a simple but powerful example of why modern execution tools should never stop at visual markers alone.
A marker on a chart is useful only if the trader is watching the screen at the exact moment it prints. But a serious execution framework is not built for passive viewing. It is built for state detection, permission control, and timed communication. That is exactly where the MARAL alert architecture changes the role of an indicator on TradingView.
This chart is not just showing candles. It is showing a workflow. It is showing how market structure, trap logic, execution permission, and trade-health monitoring can be converted into a live alert system that speaks to the trader at the moment the condition becomes actionable.
Why this feature matters
Most indicators stop at one of two levels:
They either draw signals after the fact, or they generate generic alerts with poor context.
That is not enough for serious traders.
A professional alert system must answer six questions immediately:
What happened?
In which direction?
On which timeframe?
What is the quality of the condition?
What is the operational meaning of the event?
What should the trader do next?
MARAL answers all six inside the alert message itself.
So instead of receiving a weak notification like “buy signal” or “sell signal,” the trader receives a structured execution-grade event such as:
MARAL | TRAP EXPANSION LONG PERMISSION | DIR: LONG | TF: 1 | QUALITY: STRONG | NOTE: TL marker triggered | PX: 70123.45
That is not cosmetic improvement. That is decision compression.
It reduces interpretation time, cuts confusion, and transforms alerting from noise into operational intelligence.
The core architecture behind the alert engine
The strength of this system is not that it sends alerts. The strength is that it sends state-aware alerts.
In MARAL, alerts are separated into layers:
1. Trap alerts
These identify the early emergence of a trap-side condition before the trader assumes that the market has already committed to trend continuation.
2. Execution alerts
These do not simply say direction. They confirm when execution permission becomes active based on the system’s internal gating logic.
3. Trap Expansion alerts — TL / TS
This is one of the most important additions.
When the chart prints a TL or TS marker, the trader should not have to discover it later. The system now pushes that event immediately through the realtime alert engine.
4. Trade-monitor alerts
The system continues to work after entry.
It can escalate warnings for weakening trade health, deteriorating momentum, TP1 interaction, BE exit, SL event, and final closure.
This means MARAL is not acting like a signal lamp.
It is acting like an execution console.
Why TL and TS alerts are important
This is the difference between visual logic and executable logic.
A TL or TS marker on the chart is valuable, but only if it reaches the trader in time. If the marker exists and the trader sees it ten minutes later, then the marker has become historical information, not live execution information.
By wiring TL and TS into the realtime engine, MARAL closes that gap.
Now the marker is no longer only a plotted symbol.
It becomes an event.
That matters because trap-expansion moments are often the transition points where the market moves from hesitation into directional expression. Missing that transition can mean worse entry quality, wider stop placement, or no valid trade at all.
So the alert is not merely telling the trader that a symbol appeared.
It is telling the trader that a structural state has changed.
Functional alerts vs realtime alerts
This distinction is extremely important.
Functional alerts are the named alert conditions that appear inside the TradingView alert menu set any time frame as per the trading style . These are useful when a trader wants to selectively monitor a specific class of events such as:
MARAL QUICK LONG ENTRY PERMISSION
MARAL QUICK SHORT ENTRY PERMISSION
MARAL TRAP TO EXPANSION LONG PERMISSION
MARAL TRAP TO EXPANSION SHORT PERMISSION
MARAL LONG PERMISSION
MARAL SHORT PERMISSION
Realtime alert-engine alerts are different.
These are pushed through Any alert() function call and are driven by the script’s event logic in real time. TradingView notes that for alert()-based alerts, the script controls the message and firing behavior, not the alert dialog itself.
That makes them ideal for MARAL’s execution-layer communication because the message can include:
event name
direction
timeframe
quality grade
note
live price
This is what makes the system suitable for fast execution environments.
Technical benefit to traders
The practical value to traders is significant.
First, it reduces screen dependency.
A trader no longer needs to stare at every candle waiting for state transitions.
Second, it reduces interpretation load.
The message itself tells the trader what changed.
Third, it improves response timing.
Instead of discovering a marker after the move, the trader receives the event when the logic becomes active.
Fourth, it supports disciplined trading.
Because the system can communicate both permission and deterioration, it helps traders avoid the classic mistake of focusing only on entry while ignoring trade quality after entry.
Fifth, it improves process consistency.
A trader using structured alerts is far less likely to trade based on emotion, impulse, or delayed recognition.
This is especially for traders operating in fast intraday conditions, multi-chart environments, or funded-account contexts where hesitation and overreaction both carry real cost.
Ordinary indicators tell traders what the chart looks like.
A serious workflow tells traders what the market is allowing.
That is the difference.
MARAL is not designed around excitement.
It is designed around permission.
Not every bullish candle deserves a long.
Not every bearish move deserves a short.
Not every trap deserves execution.
Not every setup deserves continuation.
The alert engine exists to communicate those distinctions with precision.
That is why this architecture is far more aligned with professional execution than with retail-style signal chasing.
TradingView implementation value
From a TradingView workflow perspective, this feature is powerful because it converts Pine logic into an event-driven operating system for the trader.
TradingView’s documentation confirms that users create script alerts by selecting the script in the Condition field and then choosing “Any alert() function call.” It also notes that if a script alert fires more than 15 times within three minutes, the alert will stop automatically, which is an important engineering consideration for any serious realtime system.
That means a properly designed alert engine must be selective, stable, and intentional.
MARAL is built with that philosophy.
It does not treat alerts as decoration.
It treats alerts as controlled transmissions.
Final thought
The future of execution tools is not more colors, more arrows, or more noise.
The future is controlled state communication.
The attached chart is a visual snapshot.
But the real innovation is what the trader does not need to watch continuously anymore.
When trap logic becomes actionable, MARAL can speak.
When execution permission opens, MARAL can speak.
When TL or TS prints, MARAL can speak.
When trade health weakens, MARAL can speak.
When risk escalates, MARAL can speak.
That is the difference between a chart tool and an execution system.
MARAL is not built to show the market.
It is built to tell the trader when the market changes state.
Note : This article presents the logic and operational value of MARAL’s alert architecture as an execution-support framework. It is designed to improve timing awareness, reduce missed structural transitions, and support systematic trade management through functional and realtime alerts. It should be understood as a workflow and chart-interpretation tool, not as a promise of outcome or a substitute for independent risk control. Education 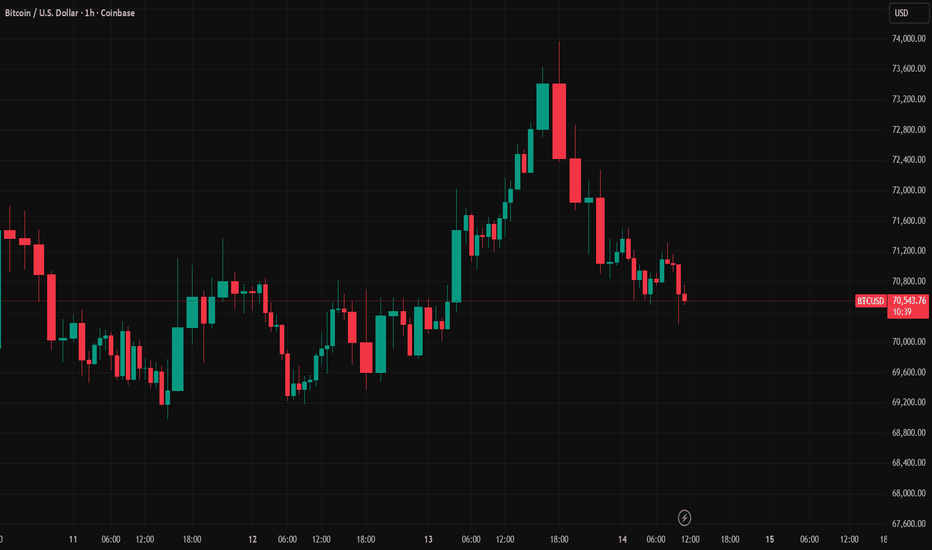
When a Long Trap Appears — But MARAL Still Says No Trade
Reading the Trap Panel beyond emotion, beyond candles, beyond guesswork
Most traders see one thing after a liquidity event:
a sharp reaction, a reversal candle, and the feeling that “this is the entry.”
But trap trading is not about spotting a wick.
It is about identifying whether one side of the market has actually been trapped and whether the environment is strong enough to convert that trap into a valid execution opportunity.
That is exactly where the MARAL Trap Entry / Exit Permission Panel becomes critical.
In the BTCUSD 15-minute chart shown here, the panel detected a Long Trap, but it still refused to authorize entry.
That difference is the entire point.
A trap detected is not the same as a trap approved
This is one of the biggest mistakes retail traders make.
They assume:
liquidity taken = instant reversal
trap seen = immediate entry
one strong candle = confirmation
emotion = conviction
But a professional execution framework cannot work like that.
A real trap setup must answer deeper questions:
Which side is trapped?
Is the trap strong enough?
Is participation supporting the move?
Is flow aligned or conflicting?
Is the market in release mode or churn mode?
Is failure risk acceptable?
Does the total score justify execution?
If those layers do not align, then the correct action is not prediction.
The correct action is restraint.
What the Trap Panel showed in this case
From the panel in the screenshot:
Trap Side: Long Trap
Entry Permission: Blocked
Exit Permission: No Trade
Trap Strength: Weak
Participation: Bearish
Flow Alignment: Conflict
Trap State: Comp Churn
Failure Risk: High
Trap Score: 1 / 5
This is a perfect educational example.
On the surface, a trader may think the market is creating a long-side opportunity because sell-side liquidity has been taken.
But the Trap Panel is saying something very different:
Yes, a trap condition may be forming — but the quality is not sufficient, the flow is not aligned, the environment is unstable, and execution is not permitted.
That is advanced governance.
Why the entry was blocked
1) Long Trap does not mean immediate long entry
The panel identified a Long Trap.
That means the model sees a possible trapped-side narrative developing on the bearish side of price behavior.
But MARAL does not stop there.
It still checks whether the trap is clean, supported, and executable.
This is where many traders fail.
They turn market observation into market action too early.
2) Trap Strength was weak
A weak trap is not a premium trap.
Weak trap strength often means:
insufficient displacement
soft rejection
poor follow-through
incomplete reclaim behavior
low structural authority
So even though a trap label is present, the panel is saying:
the market has not yet produced enough force to justify trust.
3) Participation remained bearish
This is a major warning.
If trap logic is leaning long, but participation is still bearish, then the engine sees that seller pressure is still active in the market.
That means the market may not be ready for true long continuation.
It may still be in a rotational or deceptive phase.
In other words:
the trap narrative is not yet winning against the actual active pressure.
4) Flow Alignment was conflict
This is one of the strongest blockers.
Even if a local trap appears, MARAL checks whether broader flow agrees with it.
If flow alignment is marked as Conflict, then the trap is not harmonized with the wider market engine.
That means:
the trap may be early
the environment may be mixed
the move may fail quickly
the setup is not synchronized across layers
In MARAL logic, conflict reduces trust.
5) Trap State was Comp Churn
This is extremely important.
Comp Churn means the market is still operating inside a compression / churn condition rather than a clean directional release.
That kind of environment is dangerous because it creates:
false starts
repeated bait on both sides
noisy entries
unstable follow-through
emotional overtrading
This is exactly where inexperienced traders get trapped by the idea of a trap.
The panel is doing the opposite.
It is protecting the trader from entering before the market has truly transitioned out of churn.
6) Failure Risk was high
Once failure risk is marked High, the system is already warning that the trap idea has a large probability of breakdown or invalidation.
A high failure-risk environment means even if price gives a temporary push, the odds of continuation are still weak.
This is where disciplined frameworks outperform intuition.
7) Trap Score was only 1/5
This is the final compression of the entire logic.
The score tells you how many required conditions have actually passed.
A reading of 1/5 means the setup is far from execution quality.
That single number kills emotional trading.
Because once the score is that low, the question is no longer
“Can price bounce?”
The real question becomes:
“Does this deserve capital?”
And here, the answer is clearly no.
What this means in practical trading
This panel was not built to excite traders.
It was built to stop bad trades.
That is why this example matters.
A less structured trader might have entered simply because:
liquidity was taken
price reacted
trap concept looked attractive
candle behavior looked tempting
But the Trap Panel kept the execution blocked because the deeper conditions were not aligned.
That is how a professional execution framework should behave.
It should not reward impatience.
It should not convert every chart movement into a trade.
It should not confuse possibility with permission.
The real function of the Trap Panel
The MARAL Trap Panel is not a reversal toy.
It is not a signal sticker.
It is not a visual decoration.
It is an execution-governance layer.
Its job is to separate:
trap appearance from trap quality
market reaction from executable structure
emotional temptation from permission-based action
That is the difference between seeing a setup and qualifying a setup.
Final takeaway
This BTCUSD example shows a powerful lesson:
A trap can be visible, but still not be tradable.
That is the value of a rules-based framework.
The panel identified the possibility.
Then it tested the quality.
Then it rejected the execution.
That is not weakness.
That is discipline engineered into the workflow.
And in real trading, that discipline is often more valuable than the entry itself.
Educational conclusion
Do not trade because a trap looks interesting.
Trade only when the trap is supported by:
confirmed side logic
sufficient trap strength
aligned participation
aligned flow
stable state
acceptable failure risk
valid score
Until then, the best trade may be no trade.
Disclaimer:
This publication is for educational and workflow demonstration purposes only. It is not financial advice, not a buy/sell recommendation, and not a profit claim. The Trap Panel is designed to support structured decision-making and execution discipline. Education 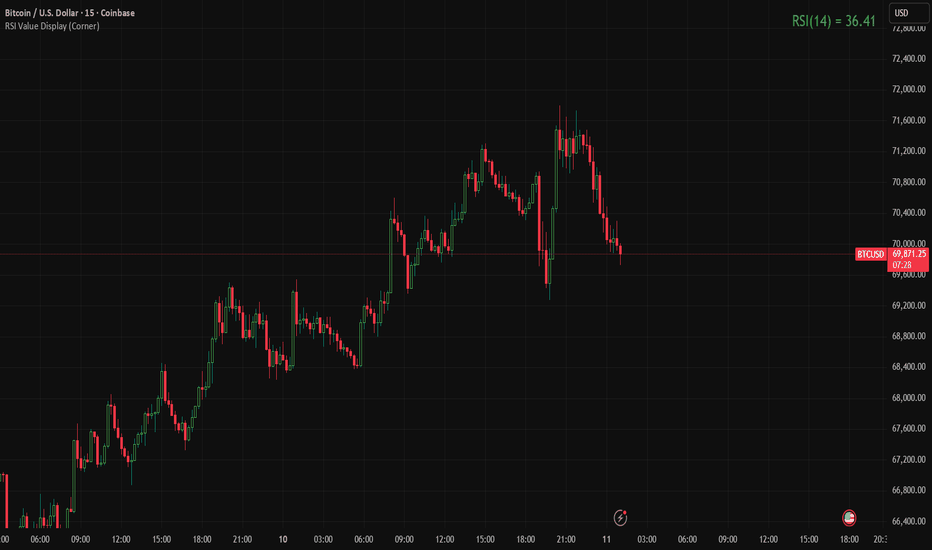
MARAL SMFT-X+Flow Governance: Reading RealMoves or TrapConditionMarkets do not fail traders only because direction is wrong.
Very often, direction is broadly correct, but the quality of the move is poor, the timing is premature, or the price action is being driven by deceptive liquidity behavior rather than true continuation.
That is the purpose of the Participation & Flow Governance panel and the SMFT-X panel inside the MARAL Execution Workflow.
These panels were not designed to predict tops, bottoms, or guaranteed outcomes. Their purpose is more practical and more structural:
to evaluate whether a move is behaving like real directional participation, or whether it is more likely to be churn, trap behavior, short-covering, long liquidation, or a squeeze-prone transition.
In other words, they help answer one of the most important questions in execution:
Is this move tradable, or is it only moving?
Why price movement alone is not enough
A candle can look strong and still be weak.
A breakout can print and still fail.
A trend can remain intact on higher timeframes while lower timeframe execution becomes unstable, noisy, and dangerous.
This is where many traders get trapped. They interpret movement as confirmation. But in many cases, the market is not expanding with clean directional intent. It is only passing through a phase of:
compression,
liquidity recycling,
mid-range churn,
stop-hunting,
reactive repricing,
or temporary inventory adjustment.
That distinction matters.
A strong-looking move is not automatically a high-quality move.
A correct bias is not automatically a clean entry.
A valid setup is not automatically a valid execution.
The MARAL framework treats these as separate layers.
The role of the Participation & Flow Governance panel
The Participation & Flow Governance panel is designed to measure the behavioral quality of the move before execution quality is judged.
Its function is to read whether there is actual directional participation in the market or whether the tape is still unstable.
It does this through several components:
1. Control State
This estimates whether the market is currently showing:
buyer dominance,
seller dominance,
weak directional control,
or neutral balance.
This matters because many failed trades begin in environments where structure appears directional, but control state is still mixed or weak.
2. Phase
The panel identifies whether price is in:
Expansion
Compression
Transition
This is critical.
A compression environment is one of the most common sources of false starts, because price can move in both directions without real takeover.
3. Sustainability
Not every push can sustain.
The sustainability reading helps distinguish between:
a move that can continue,
a move that is losing internal support,
or a move that has not yet proven itself.
4. Aggression
The panel separates buyer aggression and seller aggression instead of simplifying the market into a basic bullish/bearish label.
This is useful because traps often occur when one side appears visually active on price, but aggression readings do not support the apparent move.
5. Displacement Quality
This is a key concept.
A move that is real usually leaves evidence:
stronger candles,
clearer expansion,
less hesitation,
and better follow-through.
A move with no real displacement often lacks commitment.
6. Liquidity Conversion
This is one of the most important sections of the panel.
It helps answer whether a sweep has been converted into actual directional continuation, or whether the market only touched liquidity and then failed to continue.
That is the difference between:
liquidity event
and
liquidity conversion
This distinction is essential.
Many traders recognize a sweep.
Far fewer can judge whether that sweep has actually converted into control.
The role of SMFT-X
If the Participation & Flow Governance panel measures internal flow quality, the SMFT-X panel acts as the execution validity filter.
SMFT-X stands for:
Smart Money Flow + Trap + Squeeze
The name is intentional.
The goal is not to claim that an indicator can “see smart money” directly.
The goal is to validate whether the move is behaving like:
real aggressive participation,
or deceptive liquidity behavior.
SMFT-X is therefore a classification layer, not a prediction engine.
It asks:
Is the flow strong enough?
Is the move actually expanding?
Did the move begin from a meaningful liquidity event or only from mid-range churn?
Is the reclaim or rejection actually confirmed?
Is follow-through present?
Is trap risk elevated?
Is squeeze risk elevated?
These questions matter because a trader can be directionally correct and still be stopped out if the move is not yet structurally valid.
How SMFT-X distinguishes real move vs trap
The strongest contribution of SMFT-X is that it separates movement from valid movement.
That means it can help distinguish between:
Real expansion
A real move typically shows:
meaningful flow strength,
usable displacement,
directional aggression,
a credible liquidity origin,
reclaim/reject confirmation,
and follow-through.
When these align, the move begins to behave like genuine continuation or genuine reversal acceptance.
Trap behavior
A trap often shows:
movement without displacement,
weak or mixed aggression,
unclear reclaim/reject behavior,
weak follow-through,
or a mid-range origin without true conversion.
This is the kind of environment where price can look active while still lacking real commitment.
Squeeze-prone movement
A squeeze-prone move often appears when:
phase remains compression or transition,
aggression is mixed,
trap risk is not low,
and the market is vulnerable to taking obvious stops before confirming direction.
This is especially relevant in leveraged and fast-moving markets.
Why this matters during a live trade
These panels are not useful only before entry.
They also support decision-making during the trade.
That is important.
A panel that helps only at entry but becomes irrelevant during live exposure is incomplete.
The purpose here is broader: to improve trade governance while the position is active.
During trade, these panels help answer:
Is the move still behaving like a real continuation?
Is flow still supportive?
Is follow-through deteriorating?
Is the move degrading into weak churn?
Is the trade entering a trap-prone environment?
Should the position be held, reduced, protected, or treated more cautiously?
This makes the panels useful for:
managing conviction,
reducing overconfidence,
avoiding emotional re-entry,
and identifying when market behavior no longer matches the original execution logic.
How they work together inside MARAL
The best way to understand these panels is not as standalone indicators, but as part of a layered execution workflow.
Context layer
The broader MARAL context helps define direction, structure, and high-level environment.
Flow layer
The Participation & Flow Governance panel evaluates whether the market is actually showing usable control.
Validity layer
SMFT-X decides whether that movement is:
real,
degraded,
trap-prone,
squeeze-prone,
or context-only.
Execution layer
Only after those conditions are aligned does the workflow become suitable for higher-confidence execution logic.
This layered structure is important because it prevents one good-looking candle from being treated as sufficient confirmation.
A technical advantage of this approach
Many tools attempt to simplify the market into “buy” or “sell.”
The problem is that this often collapses too many layers into one output.
The SMFT-X and Flow Governance design takes a different approach.
Instead of asking only:
“What direction?”
it asks:
“What is the quality of the current flow, what is the validity of the move, and what is the execution risk right now?”
That is a more useful execution question.
It does not eliminate uncertainty.
No tool can do that.
But it can reduce the number of trades taken in conditions where direction appears clear but participation quality is not yet proven.
Why “real move or trap” is such an important distinction
A large amount of trading damage does not come from being completely wrong.
It comes from engaging during the wrong phase of the move.
Examples include:
entering during compression before real expansion,
shorting before a squeeze completes,
longing before reclaim is actually confirmed,
treating a liquidity touch as a converted move,
or mistaking weak reaction for true continuation.
That is why “real move or trap” is not a cosmetic distinction.
It is one of the most important differences in execution quality.
A workflow that can separate those two states is often more valuable than a workflow that simply identifies direction.
How to interpret these panels practically
When both panels show:
stronger control,
confirmed conversion,
usable displacement,
low trap pressure,
and manageable squeeze risk,
the environment is more coherent.
When they show:
compression,
weak sustainability,
mixed aggression,
failed conversion,
unclear reclaim,
and medium-to-high trap or squeeze risk,
the move should be treated more defensively.
That does not mean the market cannot continue.
It means the evidence for immediate execution is weaker.
That distinction is central to disciplined trading.
Final perspective
The Participation & Flow Governance panel and SMFT-X panel are designed to help MARAL move beyond simple directional interpretation.
Their purpose is not to promise accuracy, predict every reversal, or replace trader judgment.
Their role is to provide a more technical way to judge whether price is:
truly being accepted,
genuinely being driven,
or merely rotating through deceptive liquidity conditions.
That makes them useful not only for entry selection, but for trade quality assessment, trap filtering, and execution discipline.
In short:
Flow Governance measures whether the market is behaving with real internal directional support.
SMFT-X measures whether that behavior is clean enough to be treated as a real move rather than trap or squeeze structure.
That is the practical value of the framework.
both attached charts are very good examples of why the SMFT-X panel is useful.
At first look, both charts can tempt a trader to think:
buyers are active,
candles are moving,
maybe a long is forming.
But your system is correctly saying:
not enough quality yet.
Common message in both examples
In both charts, SMFT-X is reading:
Flow Strength = Moderate
Displacement = None
Aggression = Buyer Dom
Liq Origin = Mid-Range
Reclaim/Reject = Unclear
Follow-Through = Weak
Trap Risk = Medium
Squeeze Risk = Medium
Final State = COMP CHURN
Permission = CONTEXT ONLY
That is extremely important.
It means:
buyers are trying to lift price, but the move is not starting from a clean structural origin, it is not displacing with force, and it is not confirming with follow-through.
So this is activity, but not yet validated expansion.
1) BTC example — what it means
In the BTC chart, the Execution Console shows:
Global State = WAIT
Setup = WAIT
Entry Permission = WAIT
Liquidity Reason = Low Liquidity
Exit Permission = No Trade
The PFG panel shows:
Control State = Buyer Weak (59)
Phase = Compression
Sustainability = Low
Buyer Aggression = 32.3
Seller Aggression = 20.3
Displacement Quality = None
Liquidity Conversion = Failed (SSL)
Shift Watch = Buyers Gaining
Confidence/Gate = No Permit | Context only
What this means technically
BTC is showing a reactive bid, not a confirmed directional takeover.
Why?
Because:
buyers are stronger than sellers,
but the strength is still weak-quality strength,
there is no usable displacement,
the move is still in compression,
and the liquidity conversion has failed.
So the panel is correctly separating:
buyer interest
from
tradable bullish continuation
That is a major difference.
Real interpretation
This is not a clean long.
This is more like:
buyers trying to stabilize price inside a compressed environment, but without proving control.
That is why SMFT-X says:
COMP CHURN
and
CONTEXT ONLY
Meaning:
watch it,
respect the context,
but do not treat it as a real expansion yet.
2) SENT example — what it means
In the SENT chart, the Execution Console is even stricter:
Global State = ENTRY_BLOCKED
Setup = WAIT
Entry Permission = SKIP | L: BLOCKED | S: BLOCKED
Liquidity Reason = Low Liquidity
Exit Permission = No Trade
The PFG panel shows:
Control State = Neutral (54)
Phase = Compression
Sustainability = Low
Buyer Aggression = 25.5
Seller Aggression = 16.6
Displacement Quality = None
Liquidity Conversion = Failed (SSL)
Shift Watch = Buyers Gaining
Confidence/Gate = No Permit | Context only
And the SMFT-X panel is almost the same as BTC:
moderate flow,
no displacement,
buyer dominance,
mid-range origin,
weak follow-through,
medium trap/squeeze,
comp churn,
context only.
What this means technically
This one is even weaker than BTC.
Why?
Because in BTC the control state is at least Buyer Weak (59).
Here it is only Neutral (54).
So in SENT, buyers are visible, but not strong enough to change the market character.
This is a classic case of:
apparent lift without structural proof.
The move is trying to bounce, but it is still:
low quality,
compression-based,
low sustainability,
and not converting liquidity into directional control.
That is why the Execution Console moves from simple WAIT in BTC to ENTRY_BLOCKED in SENT.
3) Why both charts examples
Both charts show something very important:
Buyer dominance alone is not enough
A trader can see:
green candles,
local bounce,
buyers gaining,
small upward reaction,
and still get trapped.
Your panels are correctly saying:
Do not confuse reactive buying with real bullish expansion.
That is the exact strength of SMFT-X and Flow Governance.
Because both examples have:
Buyer Dom / Buyers Gaining
but also
No displacement
Weak follow-through
Failed liquidity conversion
Compression
Mid-range origin
So the move is not yet “real” in execution terms.
4) Main difference between the two charts
BTC
slightly stronger internal reading
Buyer Weak (59)
still watchlist quality
not tradable yet
SENT
weaker internal reading
Neutral (54)
more unstable
system blocks it harder
So BTC is like:
“Not ready yet.”
SENT is like:
“Even worse quality — do not touch.”
That difference is very valuable.
5) What “Failed (SSL)” means here
In both charts, Liquidity Conversion = Failed (SSL) is a major warning.
That means:
sell-side liquidity interaction happened,
but price did not convert that event into strong bullish continuation.
So the market touched a potentially useful liquidity area, but the flow quality after that was poor.
This is exactly where many traders enter too early.
They see:
liquidity taken,
buyers active,
small bounce,
and assume:
reversal started.
But your system correctly says:
No — the conversion failed.
That is a big institutional-style filter.
6) Final conclusion for both examples
Both screenshots are showing:
Not a real bullish move
Even though buyers are visible.
Why not real?
Because the market is still missing:
strong displacement,
strong follow-through,
confirmed reclaim,
clean liquidity origin,
strong sustainability,
low trap/squeeze profile.
So the system correctly keeps the state at:
COMP CHURN
and
CONTEXT ONLY
That is the right answer.
Best one-line explanation for these two charts
Both BTC and SENT show reactive buyer presence inside compression, but neither chart shows enough displacement, conversion, or follow-through to qualify as a real expansion.
Very important lesson from these examples
These two charts prove that SMFT-X is not just reading direction.
It is reading move validity.
That is why this panel is powerful.
Because it can say:
buyers are present,
but also
the move is still poor quality,
still compression-based,
still trap-prone,
still not ready for permission.
That is exactly what a serious execution framework should do.
Note : This workflow is intended for market structure analysis, participation assessment, and execution-quality filtering. It is educational and analytical in nature. It does not guarantee outcomes, does not make performance claims, and should not be treated as automated financial advice or a promise of results.
Education