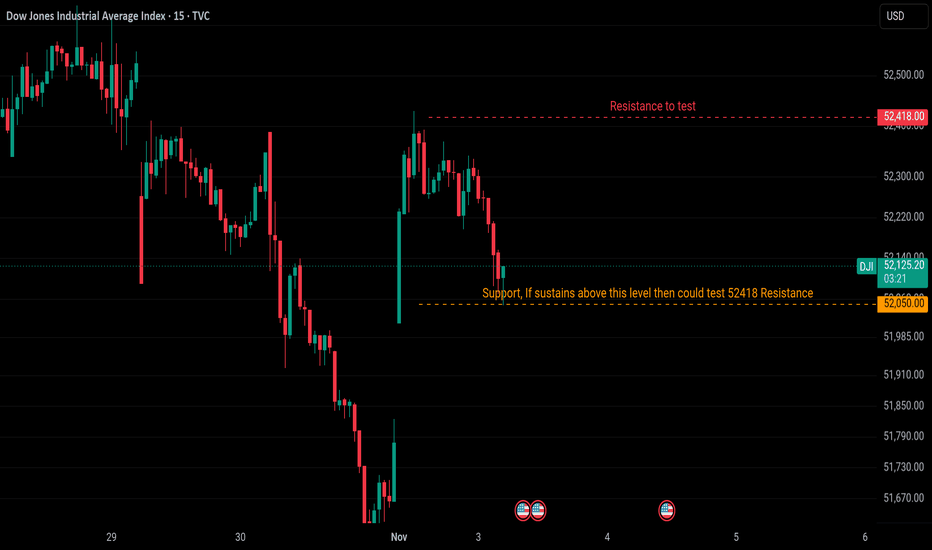
DJIDJI 15m: Technical Resistance and Support
Upside Breakout Plan
• Ticker: DJI (Dow Jones Industrial Average Index) via TVC
• Timeframe: 15-Minute (15m)
• Current Price: 52,100.20 USD (0.00%)
Key Technical Levels
• Overhead Resistance Target: 52,418.00 USD (Critical structural barrier marked as: "Resistance to test").
• Defined Support Base: 52,050.00 USD (The key horizontal floor marked by the label: "Support, If sustains above this level then could test 52418 Resistance").
Market Analys
Community ideas
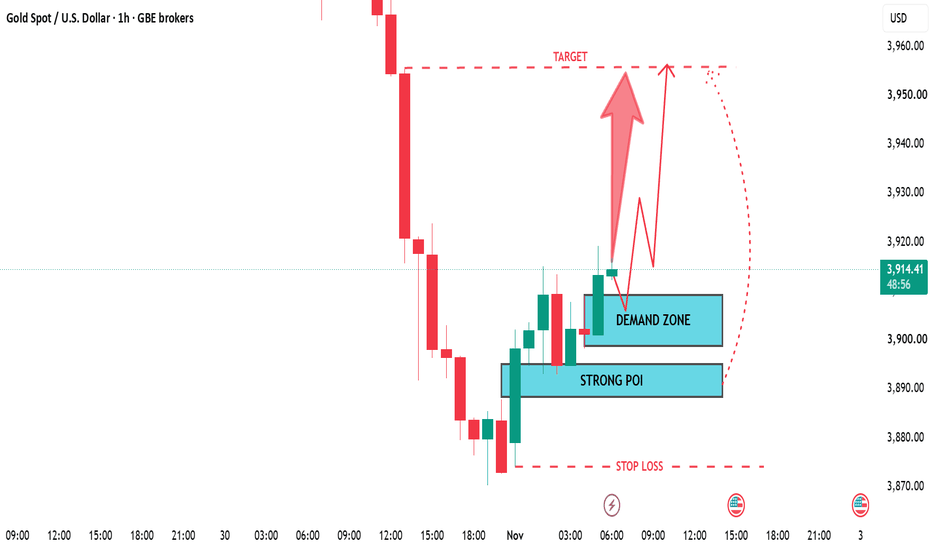
XAUUSD 1H Analysis: Bullish Bounce Setup from Demand Zone ?Overview Asset: XAUUSD (Gold Spot / U.S. Dollar) Timeframe: 1-Hour (1h) Current Price: ~3,914.61 Bias: Bullish / Long Setup
Technical AnalysisMarket Structure & Recent Action: After a sharp impulsive drop down toward the 3,870 level, Gold has formed a strong recovery phase, printing green bullish candles and stabilizing near 3,914.61. Demand Zone & Strong POI: Price is currently interacting with an established Demand Zone (approx. 3,900 – 3,910) with a deeper Strong POI (Point of Interes
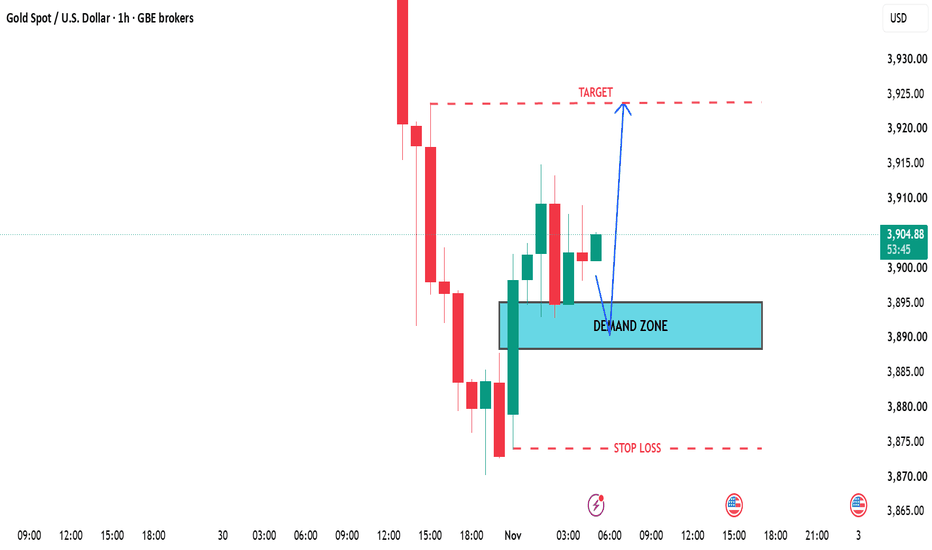
XAUUSD (Gold) Setup: Bullish Bounce from Demand ZoneTechnical Analysis & Setup Strategy
Demand Zone: Price has retraced into a clearly defined Demand Zone (approximately between 3,888 and 3,895), which previously acted as an area of strong buying interest.
Price Action & Rejection: Following a sharp impulsive decline, price has stabilized, formed a base, and is showing signs of bullish rejection within the highlighted support/demand area.
Trade Direction: Long / Buy Target (TP): Positioned near the previous structural resistance level aro
FRVP+VFP+IFAGOLD (XAUUSD) — WEEKLY MARKET OUTLOOK
Q4 2026 | Institutional Demand & Price Action
As we enter the final quarter of 2026, my basic gold analysis focuses on the Weekly Buyer Zone, where potential institutional buying interest may be concentrated.
Major market participants include central banks, BlackRock, State Street, hedge funds, pension funds, and other institutional investors.
During Q3, gold demand was influenced by global ETF activity, including US and UK Gold ETFs, alongside central ba
PCBL Chemical: Buy Dips, Breakout in formationPCBL Chemical appears to be transitioning from a prolonged corrective phase into a base-building structure. The recent price action suggests that selling pressure is gradually easing and buyers are beginning to regain control. At current levels around ₹306, the stock sits at a critical inflection point, where patience and confirmation may offer a better risk-reward profile than chasing price strength. Below two different trade scenario can be drawn from the todays price action
1. Range Trading
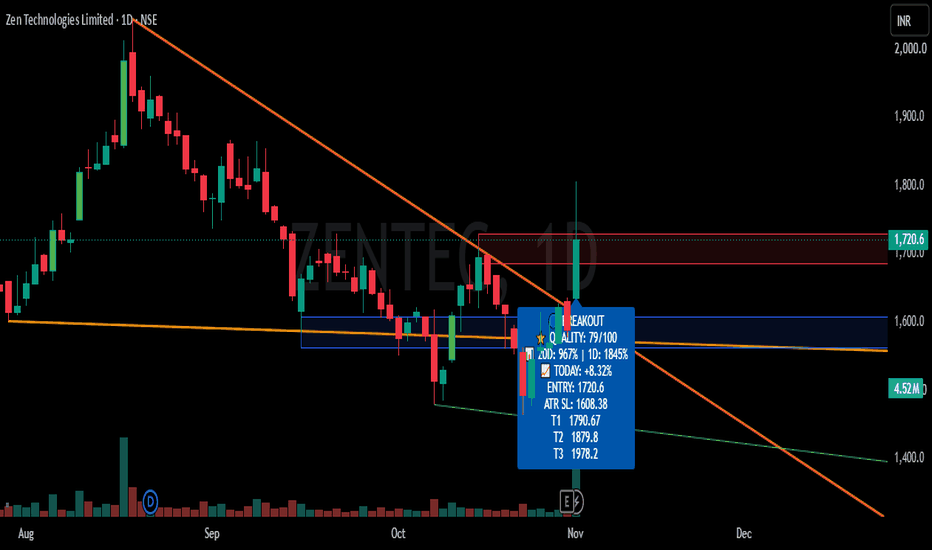
ZEN TECHNOLOGIES – CORRECTION IN PROGRESS........??????ZENTEC – CMP: ₹1687.4; RSI: 50.70
On the monthly and weekly timeframes, the larger price structure is consistent with a completed 5-wave impulsive advance, followed by a potential ABC corrective phase. Within this structure, the C-wave appears to be developing, although the Elliott count remains a working hypothesis.
On the daily timeframe, a potential double-top formation is visible around ₹2,024–2,044, with the key neckline near ₹1,600.
The stock recently fell to ₹1,585.6, briefly breachin
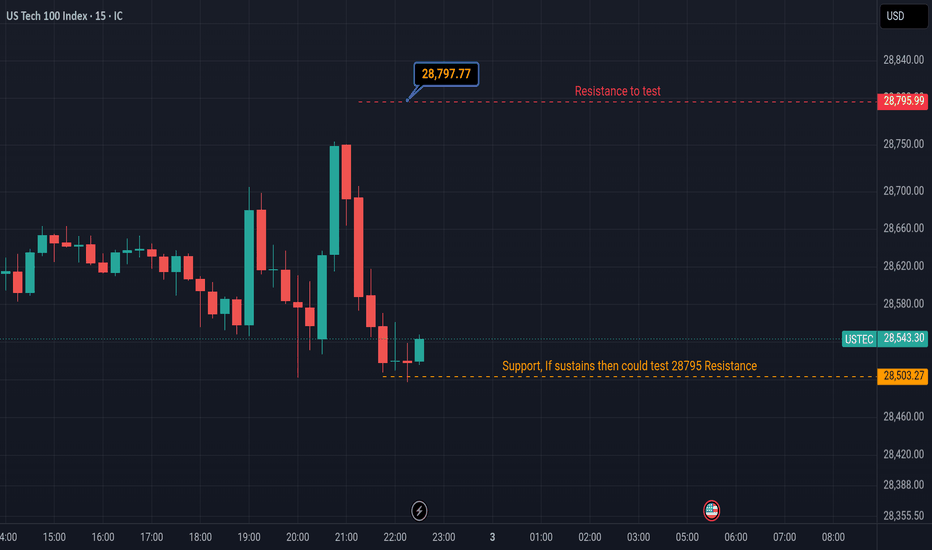
USTECUSTEC 15m: Technical Resistance and Support
Upside Breakout Plan
• Ticker: USTEC (US Tech 100 Index / NASDAQ) via TradingView
• Timeframe: 15-Minute (15m)
• Current Price: 28,505.00 USD (-0.01%)
Key Technical Levels
• Overhead Resistance Target: 28,795.00 USD (Critical structural barrier marked as: "Resistance to test").
• Defined Support Base: 28,503.27 USD (The key horizontal floor marked by the label: "Support, If sustains then could test 28795 Resistance").
Market Analysis & Structura
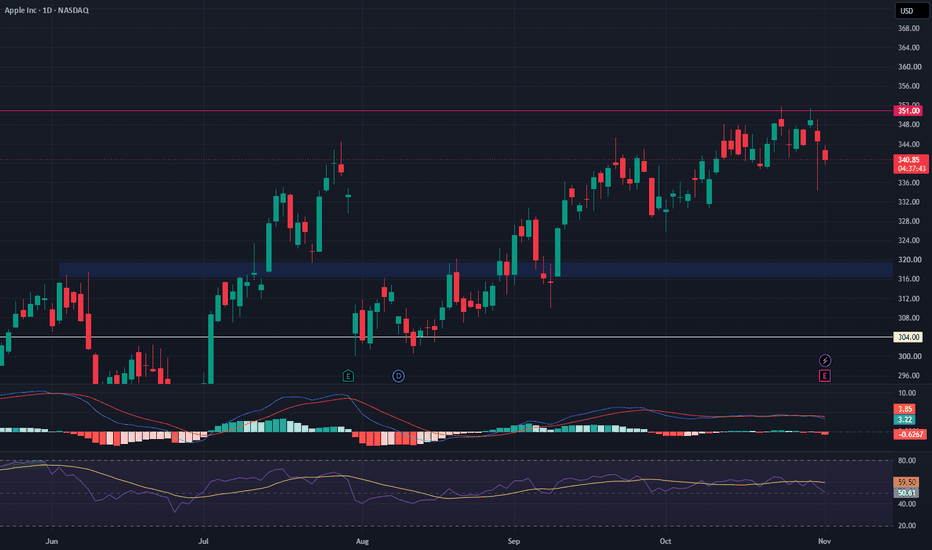
AAPL: $351 Rejection | $316 Buy Setup Ahead of EarningsApple NASDAQ:AAPL is trading near $341, down around 1% after facing rejection at the $351 resistance level. The company is expected to release its Q4 earnings after the US market closes on Monday, November 2, making the upcoming earnings announcement a major catalyst for price volatility.
Apple's fundamentals remain strong, with its latest quarterly revenue reaching $109.4 billion (+16% YoY) and EPS increasing 29% to $2.02. Analysts expect approximately $113.4 billion in Q4 revenue and $1.99
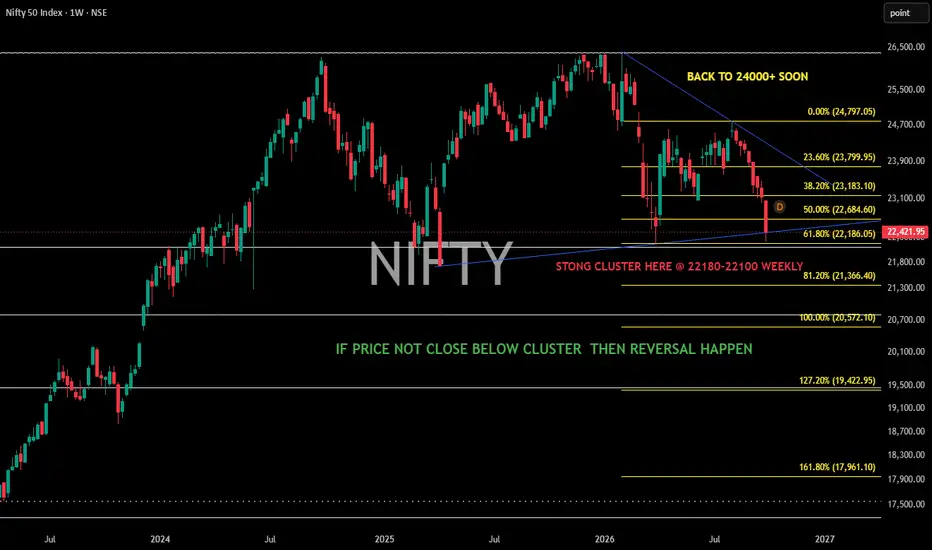
NIFTY Weekly: Strong Support Cluster at 22,180–22,100NIFTY — Weekly Timeframe
NIFTY is currently approaching a strong weekly support cluster around 22,180–22,100.
This zone has multiple technical confluences:
Trendline Support — price is approaching the rising weekly trendline.
61.8% Fibonacci Support — 61.8% level is around 22,186.
Fibonacci Extension/Projection — the extension structure also places an important area around this zone.
Price-Based Support — 22,180–22,100 is the key weekly closing support area.
Key Observation
If NIFTY holds th
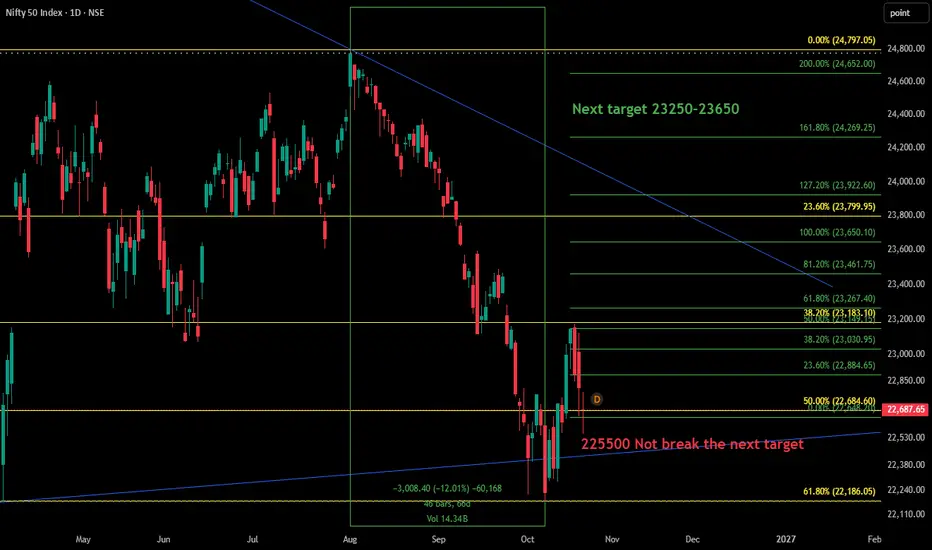
NIFTY 50: 22,500 Support Holding — Is the Next Impulsive Wave NIFTY 50 | Daily Chart | Elliott Wave Analysis
NIFTY 50 is struggling to break below the crucial 22,500 support zone. As long as this level holds, the possibility of a bullish recovery remains on the table.
Based on the Elliott Wave perspective, the lower timeframes may be preparing for the beginning of a new impulsive move, provided price action confirms the reversal.
Key Levels to Watch
Major Support: 22,500
Initial Upside Target: 23,250–23,650
Immediate Resistance Zone: 23,000–23,200
C
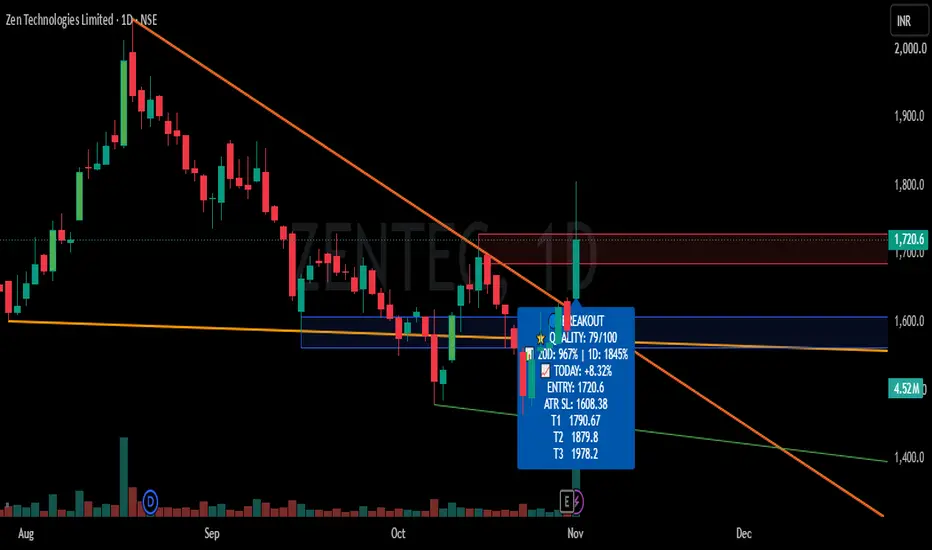
Buy Today, Sell Tomorrow for 3-5% - Daily Breakout SetupZENTECH — BTST BREAKOUT SETUP
Entry, Stop Loss & Targets Are Clearly Defined — Helping You Plan Your Trade With Confidence.
📊 Stock Strength: 79/100
(Note: Higher score indicates stronger stock conditions, not guaranteed returns.)
A bullish breakout has appeared on the 1D timeframe with positive price action and strong volume expansion.
🔄 Trade Type: BTST
────────────────────
🎯 TRADE LEVELS
ENTRY: ₹1721
🛑 STOP LOSS
Previous Candle
🎯 TARGETS
3–5%
────────────────────
📈 VOLUME
20D Volum
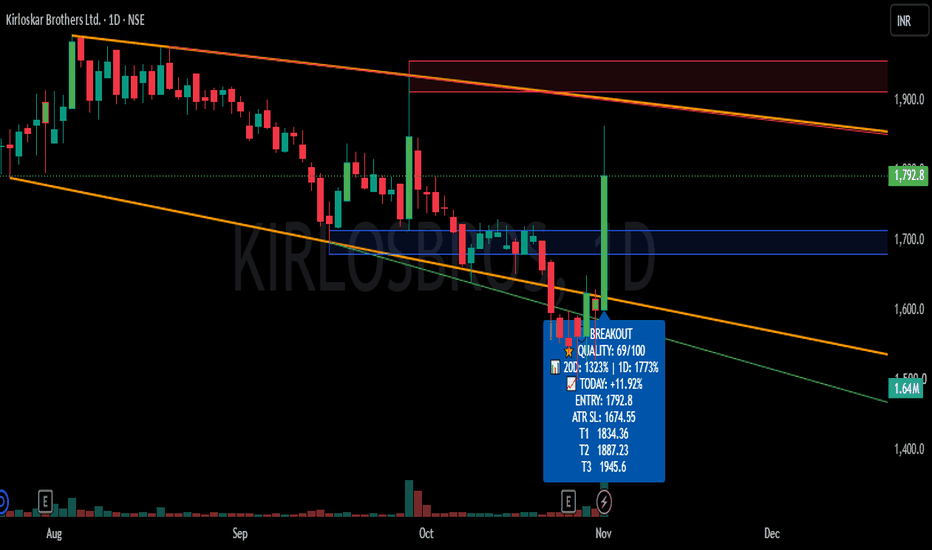
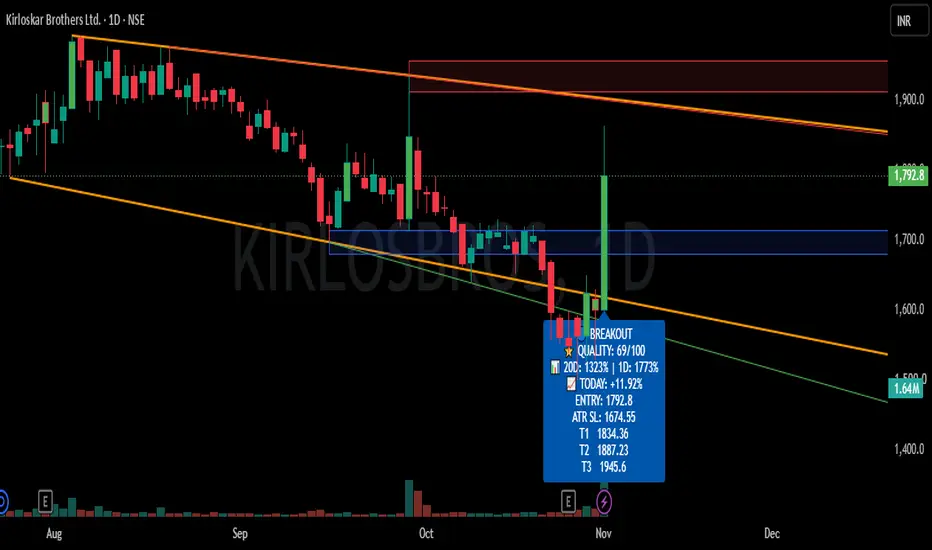
Buy Today, Sell Tomorrow for 3-5% - Daily Breakout SetupKIRLOSBROS — BTST BREAKOUT SETUP
Entry, Stop Loss & Targets Are Clearly Defined — Helping You Plan Your Trade With Confidence.
📊 Stock Strength: 69/100
(Note: Higher score indicates stronger stock conditions, not guaranteed returns.)
A bullish breakout has appeared on the 1D timeframe with positive price action and strong volume expansion.
🔄 Trade Type: BTST
────────────────────
🎯 TRADE LEVELS
ENTRY: ₹1793
🛑 STOP LOSS
ATR SL: ₹1675
🎯 TARGETS
3–5%
────────────────────
📈 VOLUME
20D Volu
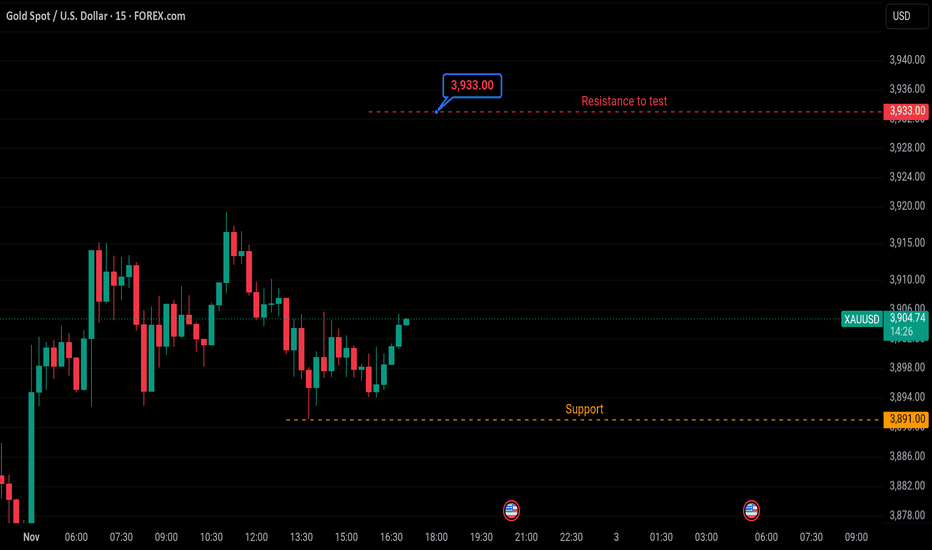
XAUUSDXAUUSD 15m: Technical Resistance and Support
Upside Breakout Plan
• Ticker: XAUUSD (Gold Spot / U.S. Dollar) via FOREX.com
• Timeframe: 15-Minute (15m)
• Current Price: 3,904.56 USD (-0.01%)
Key Technical Levels
• Overhead Resistance Target: 3,933.00 USD (Critical structural barrier marked as: "Resistance to test").
• Defined Support Base: 3,891.00 USD (The key horizontal floor marked by the label: "Support").
Market Analysis & Structural Outlook
• Price Action: Following a sustained do
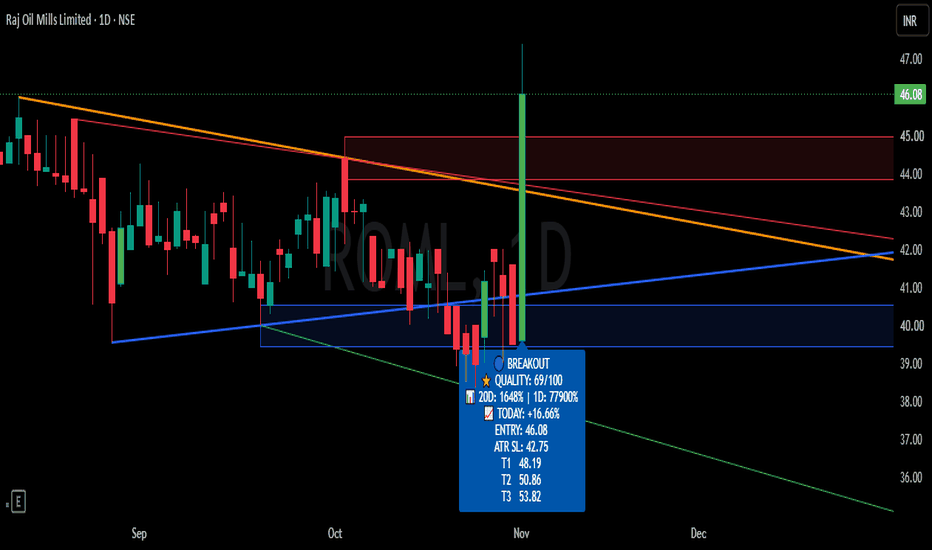
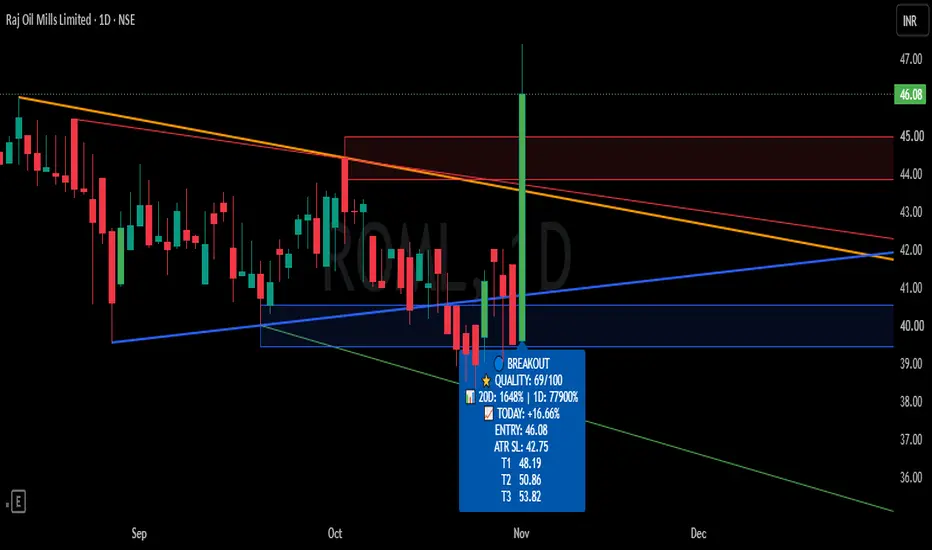
Buy Today, Sell Tomorrow for 3-5% - Daily Breakout SetupRAJ OIL — BTST BREAKOUT SETUP
Entry, Stop Loss & Targets Are Clearly Defined — Helping You Plan Your Trade With Confidence.
📊 Stock Strength: 69/100
(Note: Higher score indicates stronger stock conditions, not guaranteed returns.)
A bullish breakout has appeared on the 1D timeframe with positive price action and strong volume expansion.
🔄 Trade Type: BTST
────────────────────
🎯 TRADE LEVELS
ENTRY: ₹46
🛑 STOP LOSS
ATR SL: ₹43
🎯 TARGETS
5%
────────────────────
📈 VOLUME
Good
───────────
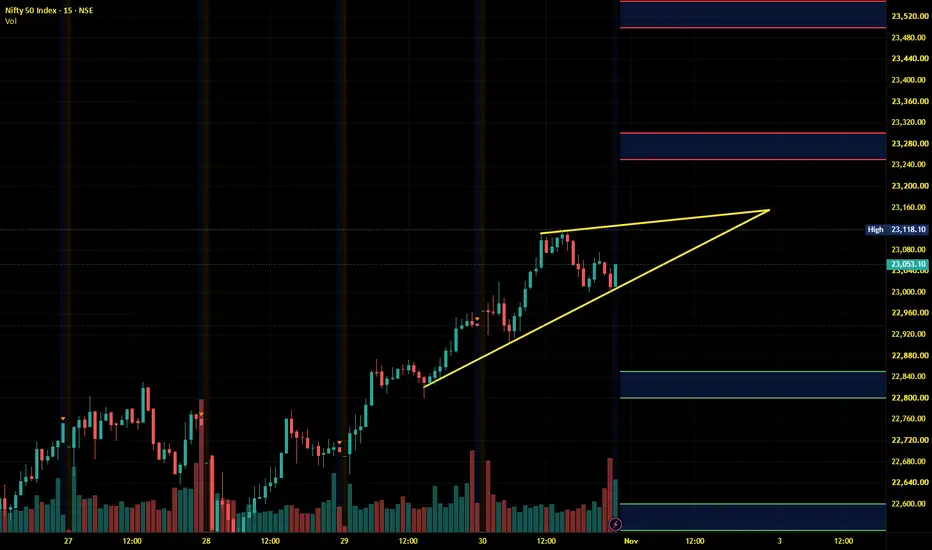
Nifty Intraday Analysis for 02nd November 2026NSE:NIFTY
Index is above the 22800 - 22700 support range and this support range is expected to be respected if there is any downward movement. On the upside, current trend may lead the Index for another 400 - 500 points.
The upward movement may lead to 23250 – 23300 resistance range and if the index crosses and sustains above this level then may reach near 23500 – 23550 range.
On the contrary, The downward moment may drag the Index to 22850 – 22800 support range in downward momentum an
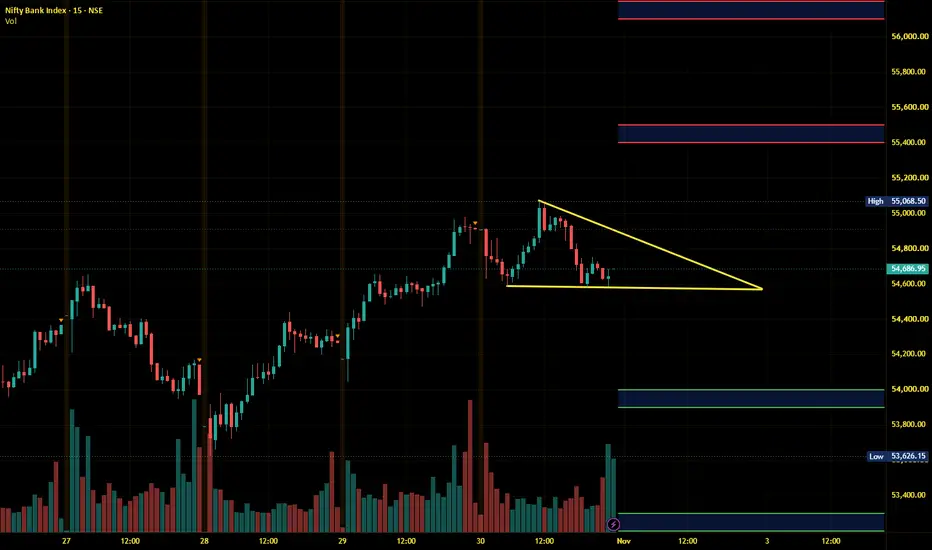
Banknifty Intraday Analysis for 02nd November 2026NSE:BANKNIFTY
Index has resistance near 555000 level and as long as Index is below 55000, Index has downside risk. On the upside, more upside momentum is expected when the Index crosses and sustains above the 55000 level.
The upward moment may lead the Index to 55400 – 55500 resistance range in upward momentum and if the index crosses and sustains above this level then may reach near 56100 – 56200 range.
On the contrary, the downward moment may drag the Index to 54000 – 53900 support range
Finnifty Intraday Analysis for 02nd November 2026NSE:CNXFINANCE
Index is above 24600 support level and this support range is expected to be respected if there is any downward movement. On the upside, Index has resistance in the 25000 level and if Index breaks and sustains this resistance range then further upside moment is expected.
The upward movement may lead the Index to 24975 - 25025 resistance range and if the index crosses and sustains above this level then may reach near 25250 - 25300 range.
On the contrary, The downward moment
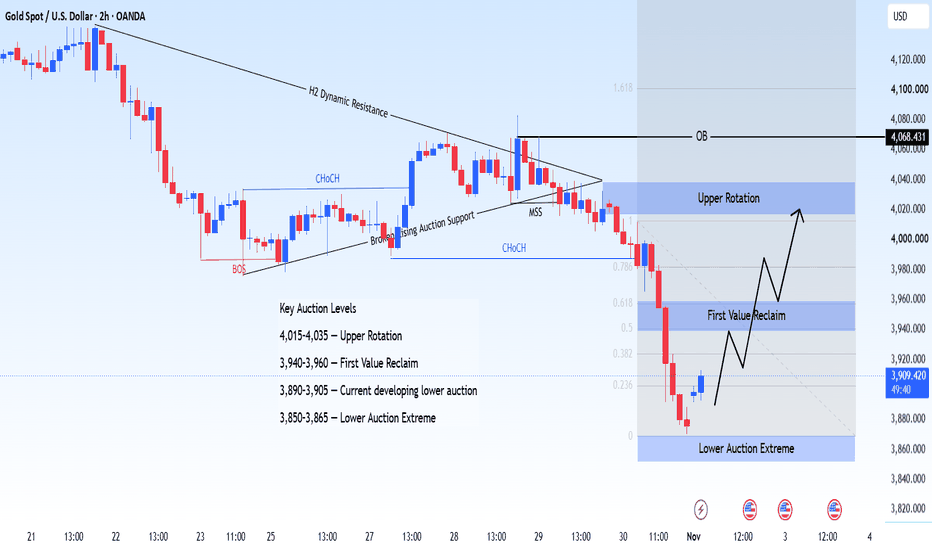
XAUUSD — Value Acceptance Around 3,900
Auction State
XAUUSD on H2 remains in a directional bearish auction, but the latest decline is beginning to slow around 3,880–3,900. Price remains well below the former H2 dynamic resistance and the previous 4,000+ distribution, so the broader auction is still lower.
The macro backdrop remains restrictive, although some short-term pressure has eased. Gold is attempting a modest recovery after the sharp late-October selloff, while softer oil prices have reduced some immediate inflation pressur
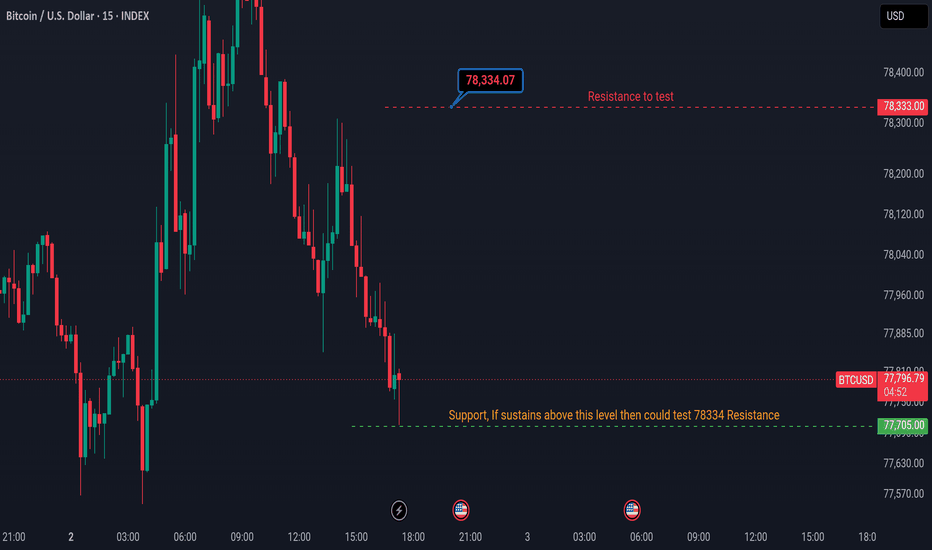
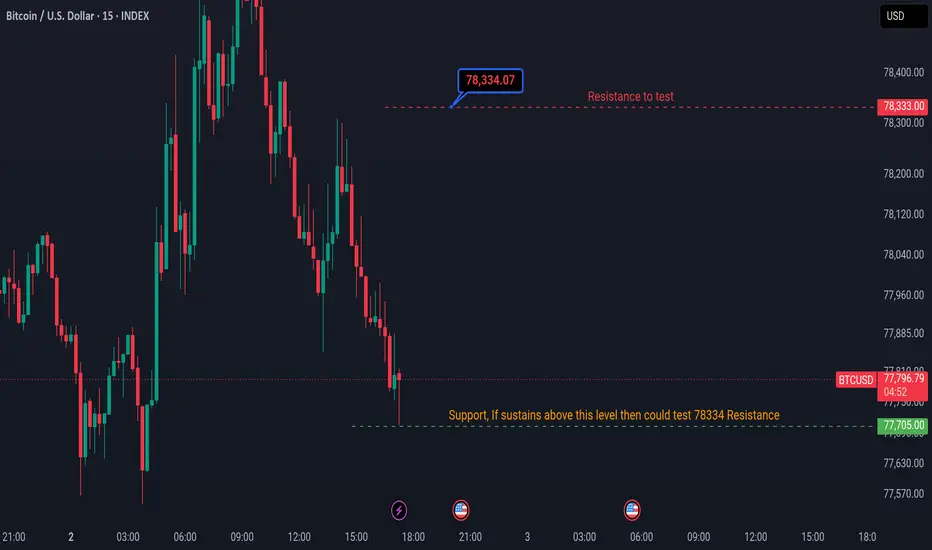
BTCUSDBTCUSD 15m: Technical Resistance and Support
Upside Breakout Plan
• Ticker: BTCUSD (Bitcoin / U.S. Dollar) via INDEX
• Timeframe: 15-Minute (15m)
• Current Price: 77,789.27 USD (-0.02%)
Key Technical Levels
• Overhead Resistance Target: 78,334.07 USD (Critical structural barrier marked as: "Resistance to test").
• Defined Support Base: 77,705.00 USD (The key horizontal floor marked by the label: "Support, If sustains above this level then could test 78334 Resistance").
Market Analysis &
BUY TODAY SELL TOMORROW for 5%DON’T HAVE TIME TO MANAGE YOUR TRADES?
- Take BTST trades at 3:25 pm every day
- Try to exit by taking 4-7% profit of each trade
- SL can also be maintained as closing below the low of the breakout candle
Now, why do I prefer BTST over swing trades? The primary reason is that I have observed that 90% of the stocks give most of the movement in just 1-2 days and the rest of the time they either consolidate or fall
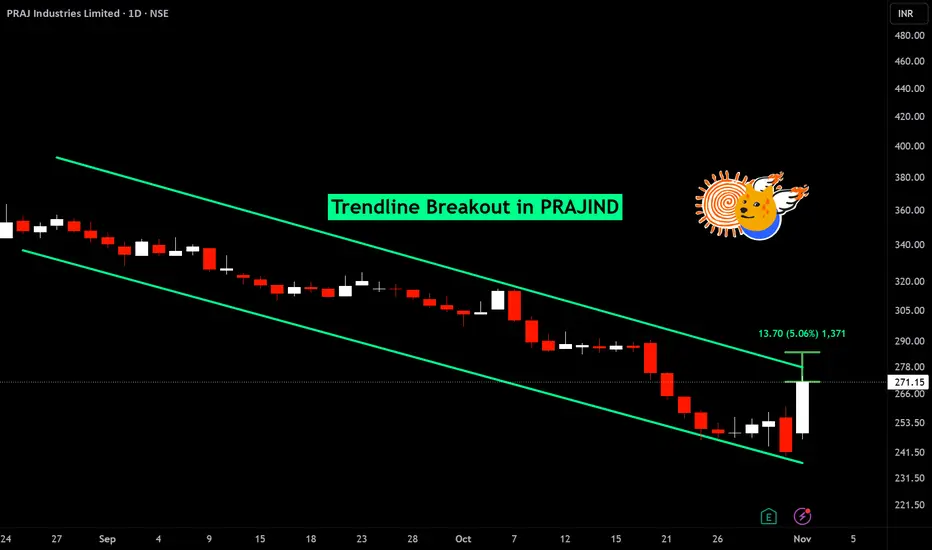
Trendline breakout in PRAJIND
BUY TODAY SELL TOMORROW for 5%
BUY TODAY SELL TOMORROW for 5%DON’T HAVE TIME TO MANAGE YOUR TRADES?
- Take BTST trades at 3:25 pm every day
- Try to exit by taking 4-7% profit of each trade
- SL can also be maintained as closing below the low of the breakout candle
Now, why do I prefer BTST over swing trades? The primary reason is that I have observed that 90% of the stocks give most of the movement in just 1-2 days and the rest of the time they either consolidate or fall
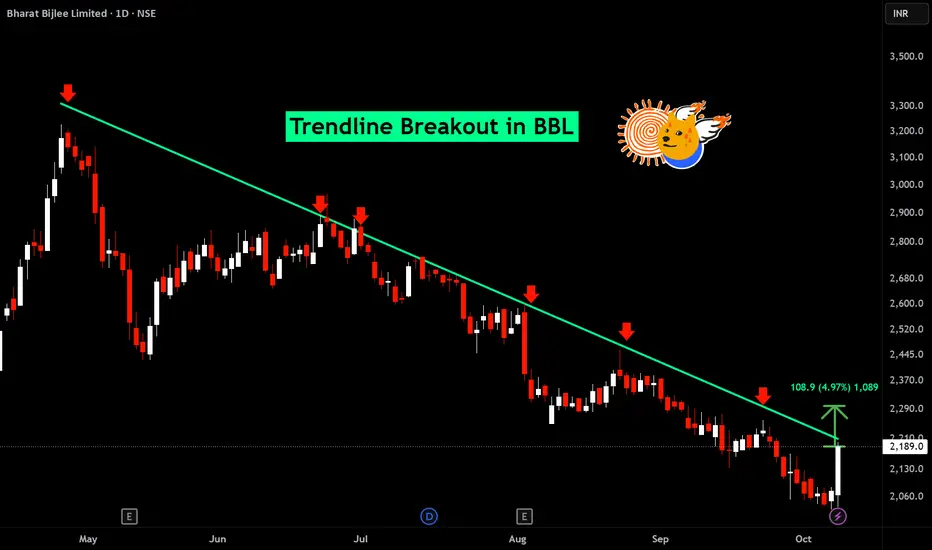
Trendline breakout in BBL
BUY TODAY SELL TOMORROW for 5%
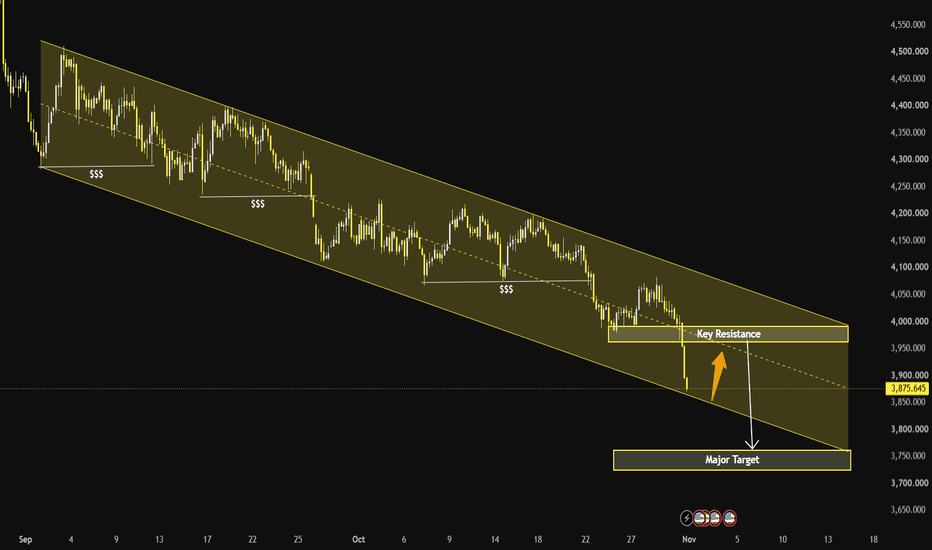
Gold Below $3,900 — A Retest Before Another Drop?
Gold has extended its decline beneath $3,900, reinforcing the broader bearish structure. But with price approaching the lower boundary of a descending channel, could the next rebound simply create another lower high?
Market Structure — Sellers Remain in Control
The chart shows XAUUSD maintaining a well-defined descending channel, characterized by successive lower highs (LH) and lower lows (LL).
Since September, recovery attempts have repeatedly failed to establish a sustainable bullish struc
BUY TODAY SELL TOMORROW for 5% DON’T HAVE TIME TO MANAGE YOUR TRADES?
- Take BTST trades at 3:25 pm every day
- Try to exit by taking 4-7% profit of each trade
- SL can also be maintained as closing below the low of the breakout candle
Now, why do I prefer BTST over swing trades? The primary reason is that I have observed that 90% of the stocks give most of the movement in just 1-2 days and the rest of the time they either consolidate or fall
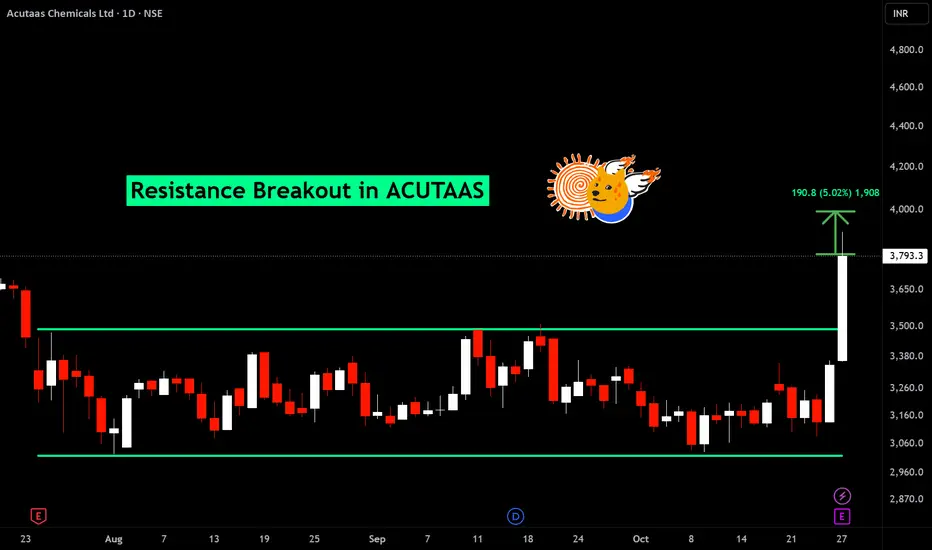
Resistance breakout in ACUTAAS
BUY TODAY SELL TOMORROW for 5%