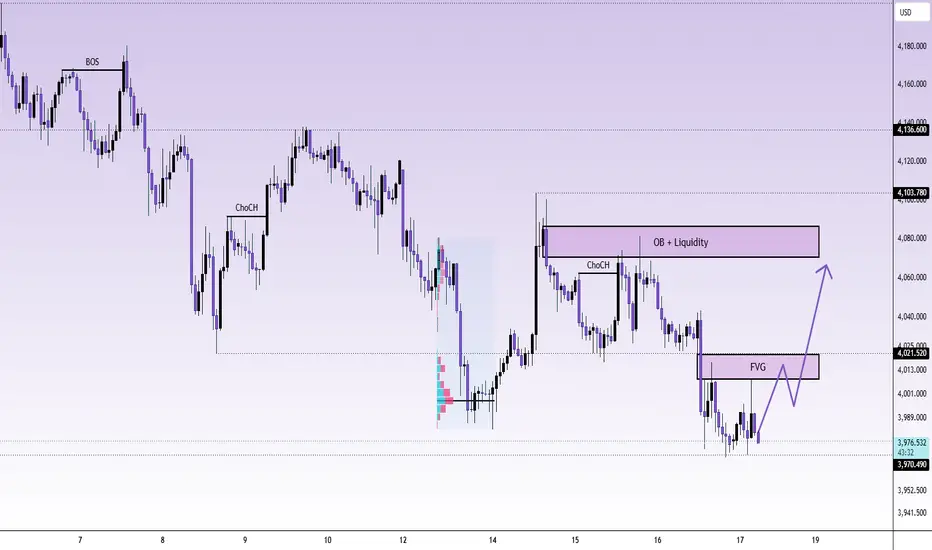
XAUUSD 3970 sweep — 4021 first trap XAUUSD 3970 sweep — 4021 first trap
That 3,970 sweep is the whole setup now.
Gold dropped into the monthly low area, bounced a bit, but don’t let that little recovery fool you too fast. The structure is still heavy. Lower highs. Breakdown. Weak reclaim. Sellers still pressing from above.
Macro is not helping bulls much either. US-Iran tension keeps risk messy, inflation fear is still alive, and Fed rate-hike talk gives USD a reason to stay bid. So yeah, gold can bounce. But the bounce can still be just bait.
Main bias stays bearish while price sits below 4,021 and 4,058.
The first trap zone is the FVG around 4,010 - 4,021. If price pushes into that area and starts rejecting, that’s where late buyers can get stuck. Above that, the bigger pain zone is 4,068 - 4,085, the OB + liquidity area. That is the cleaner premium zone for sellers.
I’m not chasing shorts at 3,970 though. Too late down there.
Trading scenario:
Sell idea only if gold pulls back into 4,010 - 4,021 and rejects, or stretches deeper into 4,068 - 4,085 and fails.
Entry zone: 4,010 - 4,021 after rejection
Deeper sell zone: 4,068 - 4,085
Stop loss: above 4,103
TP1: 3,970
TP2: 3,961
TP3: 3,943
No rejection, no sell. Simple.
If gold closes back above 4,103, this short idea gets messy. Then price can squeeze higher before sellers try again.
For now, this still looks like weak bounce into supply.
You selling the FVG retest, or waiting for 4,085?
 Long
Long
 Long
Long
NIFTY : 8-Day Consolidation within one candle range ??
NIFTY Daily Analysis: 13-Day Consolidation Suggests a High-Probability Breakdown Setup
The market has now spent nearly 13 trading sessions consolidating within the range of a single large bearish candle. This is one of the strongest signs that buyers and sellers are locked in a battle, with neither side able to establish dominance.
When a market repeatedly fails to break above the high or below the low of one impulsive candle for several weeks, it usually indicates that institutions are accumulating or distributing positions before the next directional move.
What the chart is telling us
The entire price action after the sharp sell-off has remained trapped inside the range of one dominant bearish candle.
Every rally has been rejected before reaching higher resistance.
Every dip has found buyers near support, creating a compression pattern.
Volatility has contracted significantly, suggesting that a larger expansion phase could be approaching.
Markets generally do not remain inside such a narrow range forever. The longer the consolidation, the stronger the eventual breakout or breakdown tends to be.
Key Resistance 24,533
This is the immediate resistance zone where sellers have repeatedly defended price.
A sustained move above this level would invalidate the current bearish expectation and could trigger fresh buying momentum.
Key Breakdown Level 23,910 (Daily Closing Basis)
This is the most important level on the chart.
I am not interested in intraday breaks or temporary spikes below support.
The bearish setup activates only if NIFTY gives a daily close below 23,910.
A confirmed daily close below this level would indicate that sellers have finally absorbed demand and the consolidation has resolved to the downside.
Potential Target
If the breakdown confirms, Target: 23,080
This represents approximately a 3% downside move, offering close to a 1:1 risk-reward based on the current structure.
The projected decline also aligns well with the measured move of a possible AB = CD harmonic completion, adding further confluence to the bearish scenario.
Why I Prefer Waiting for Confirmation
One of the biggest mistakes traders make is anticipating a breakout before the market confirms it.
Inside prolonged consolidations, false breakouts are common.
Instead of predicting the move, I prefer reacting only after the market confirms direction with a daily closing breakdown.
Patience often provides cleaner entries and better probability trades.
Trading Plan
Bullish Scenario
Daily close above 24,533 (sellers stop loss level)
Bearish view becomes invalid.
Buyers regain control.
Bearish Scenario (Preferred)
Daily close below 23,910 Look for short opportunities.
Downside target around 23,080.
Until one of these levels breaks, NIFTY remains in a neutral consolidation phase.
Final Thoughts
This is not a prediction but a probability-based trading setup.
The market has spent almost three weeks respecting the range of a single candle, which often precedes a significant directional move.
The key is to stay patient, let price confirm the breakout or breakdown, and trade only after confirmation rather than trying to guess the next move.
Levels to Watch
🔴 Resistance: 24,533
🔵 Breakdown Trigger: 23,910 (Daily Close)
🟢 Downside Target: 23,080
 Short
Short
Thirteen Years Later, The Chart RememberedThe Timeframe
Each candle on this chart represents three months of price action. On this scale, what unfolds is not weeks or even years of behavior but multi decade structure.
2007: The Supply That Held for Thirteen Years
In 2007, this stock reached a high that would go on to define its ceiling for the next thirteen years. Every attempt to move above that level failed.
2020: The Breakout After Thirteen Years
In 2020, the stock finally broke through that same 2007 supply zone. This was not a minor technical event. Breaking a level that held for thirteen straight years carries real structural significance. Following the breakout, price sustained above the zone and went on to create a fresh all time high.
Consolidation Above the Breakout
Above this newly flipped zone, the chart shows a consolidation pattern. This refers to a series of candles moving in a relatively sideways manner following a strong rally, as the market pauses to hold and absorb the gains
The Trendline from 2013
A trendline drawn from 2013 has continued upward and is still relevant on the chart today. A trendline is simply a line connecting a series of highs or lows that reflects the underlying direction and structure of price over time
Disclaimer: This post is purely educational and observational in nature based on historical price action on a three month timeframe. It does not constitute financial advice, a forecast, or a recommendation to buy, sell, or hold any security
 Long
Long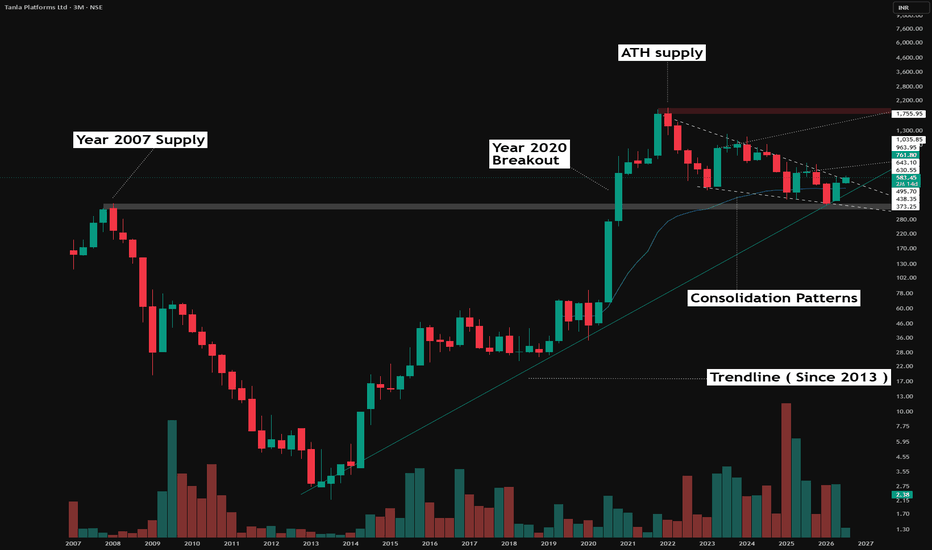
XAUUSD: Demand Reacts, But Sellers Still Wait Above XAUUSD: Demand Reacts, But Sellers Still Wait Above
Market Context
Gold is recovering slightly from the monthly low area, but the upside still looks limited. US-Iran tensions, inflation concerns, and stronger USD demand continue to pressure gold, while expectations of a more restrictive Fed stance keep buyers cautious.
The market is not showing a clean bullish reversal yet. The current bounce is more like a technical reaction from demand, not a confirmed trend shift.
Key point: gold is reacting from demand, but sellers may return if price rebounds into 4,055 - 4,080.
Technical Structure
Gold is trading around 3,983 after reacting inside the Liquidity Sweep / Demand Zone.
The short-term trend remains weak. Price is holding the bottom temporarily, but buyers still need to reclaim 4,007 first before a stronger rebound can develop.
Above that, 4,029 is the next buy-side liquidity target. If price reaches this area and keeps momentum, gold may extend toward the Sell Reaction Zone at 4,055 - 4,080.
However, as long as price remains below the major supply structure, rallies should still be treated carefully. The broader bearish setup still supports fresh selling pressure at higher prices.
Key Levels
Current Price: 3,983
Demand Zone: 3,960 - 3,980
Buy Zone: 4,007
Buy-side Liquidity: 4,029
Sell Reaction Zone: 4,055 - 4,080
Major Supply Zone: 4,105 - 4,120
Bullish Above: 4,029
Bearish Below: 3,960
Trading Plan
Buy Scenario
Entry: Above 4,007 after bullish confirmation
SL: Below 3,960
TP: 4,029 / 4,055 / 4,080
Condition: Price must hold the demand zone, reclaim 4,007 with strength, and form a clear bullish CHOCH. This is only a short-term rebound setup, not a full reversal.
Sell Scenario
Entry: 4,055 - 4,080 after bearish confirmation
SL: Above 4,105
TP: 4,029 / 4,007 / 3,980
Condition: Price rebounds into the Sell Reaction Zone but fails to continue higher. Bearish rejection from this area would confirm that sellers are still defending the structure.
Sell at Major Supply
Entry: 4,105 - 4,120
SL: Above 4,140
TP: 4,080 / 4,029 / 4,007
Condition: Price sweeps higher into major supply and gets rejected. This would be a stronger sell setup if the rebound becomes extended.
Breakdown Sell
Entry: Below 3,960
SL: Above 3,983
TP: 3,940 / 3,920 / 3,900
Condition: Demand fails, retest is rejected, and bearish momentum continues. This would confirm that the bounce has failed.
Overall Bias
Gold is reacting from demand, but the structure is still not bullish. Buyers need to reclaim 4,007 and 4,029 before the recovery can become stronger.
Until then, the main plan is to watch for a short-term rebound first, then look for seller reaction around 4,055 - 4,080.
Best approach: wait for confirmation at demand or resistance. Do not chase the bounce while gold is still below the sell reaction zone.
Will buyers reclaim 4,029, or will sellers use this rebound to push gold back below demand?
Long 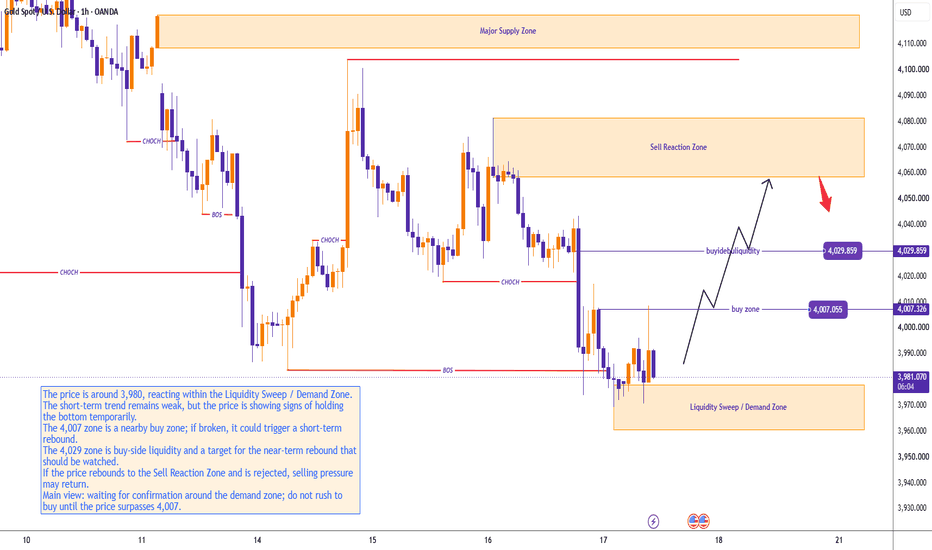
Long 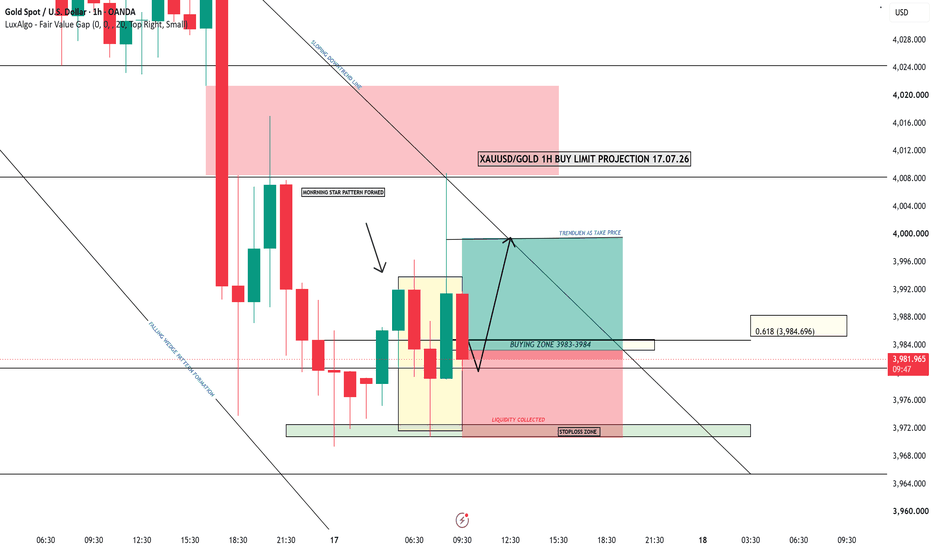
 Long
Long
BSE Ltd — Pulling Back Hard, Watching the 0.618 Fib + Wedge ZoneOverview
BSE has had a strong run since April, but today it's seeing a sharp fall (currently down 2.11%, trading around 3,607). This drop has brought price right into an important zone — where an old Fibonacci level and a wedge pattern are meeting. Let's break down what we're watching.
What's Happening
Price rallied hard from 3,031 all the way to a high of 4,446 in just a couple of months. That's a big move, so some pullback is normal. Since then, price has been falling in a wedge shape (marked in red), and today's fall has pushed it right down to the 0.618 Fib level around 3,572.
Right now, price is trading between its two EMAs — below the 50 EMA (3,800) but still above the 200 EMA (3,209). This tells us the bigger uptrend isn't broken, but the stock is definitely cooling off hard after its big run.
Key Levels to Watch
Zone to Watch: 3,570–3,610 (0.618 Fib + wedge support meeting here)
If this zone breaks: next level is 0.786 Fib at 3,334
If price bounces from here: first hurdle above is 0.5 Fib at 3,739, then 0.382 Fib at 3,906
Bigger picture support: 200 EMA around 3,209
Since the Market Is Still Open Today
This is based on where price is trading right now, not a closed candle. Since we're mid-session, wait for the close today (or even a session or two more) before treating this zone as confirmed support or a broken level.
Two Ways This Can Go
If the zone holds: A bounce from here, especially with a strong green candle, would be a good sign buyers are stepping back in. Watch for price to reclaim 3,739 next.
If the zone breaks: A close well below 3,570 today or tomorrow would mean sellers are still in control, and 3,334 becomes the next zone to watch.
Beginner's Lesson
When a stock falls sharply after a big rally, it's easy to panic or get excited too early. The smart move is to mark the zone where multiple signals line up (like we did here with the Fib level and wedge), and then simply wait. Let price show you what it wants to do, rather than guessing in the middle of a sharp move.
Conclusion
BSE is testing an important zone today after a strong rally. As always, we prefer to wait for confirmation rather than jumping in mid-fall. We'll keep watching and post an update once this plays out.
For educational purposes only. Not financial advice. Always manage your risk. Gold breakdown the daily support Where we are: Gold is at 3,993, down from 4,035. Price has broken the daily support at 3,999 and is trading below it for the first time in this whole fight. The weekly close lands today.
Intermarket
Here is the twist. The macro pressure is actually easing right as price breaks down. The driver split moved from 100% bearish to 79% bearish with 21% now neutral. Tailwind score jumped from 1.0 to 4.5. The dollar has gone flat at 100.77 instead of rising, and VIX is flat. Real yields are still up at 2.32%, but the two biggest weights on gold are no longer pressing harder.
That is a real change after a week of nothing but red on that panel. It does not make the macro bullish, but the wall has cracks in it now.
Daily
Structure is bearish, last high a Lower High, last low a Lower Low. Support at 3,999 now reads negative, meaning price is under it. Resistance is far off at 4,180.
The trendline chart is the entire story today. Price is sitting exactly on the long-term rising support line, the ninth touch. That line has held this whole move up. It is being tested right now, in real time, on the weekly close. This is the make-or-break moment we have been building toward all week.
The multi-timeframe box: 15m has flipped bullish, but 1H, 4H, 1D, and 1W all stay bearish.
Hurst Cycle
This is the bullish counterweight and it is not small. The cycle is at 87% complete and the trough window is flagged OPEN NOW. The next crest is projected about 10 bars out. Last cycle was right-translated, amplitude is expanding, confluence sits at 70%.
In plain terms, the timing model says a cycle low is due right here, right now. That lands on the exact bar where price is testing the nine-touch trendline. When timing and structure line up in the same spot, you pay attention.
H4
Bearish, resistance 4,068, support 4,031, and price is below both. The 4H trendline chart flags S BROKEN at this level. The short-term support gave way.
But notice the 4H last low reads Higher Low, not Lower Low. The structure has not fully collapsed even with the break
Volatility
Still MID VOL, now 55 days against a typical stay of 8.5 days. The coil is at its most extreme reading yet. Daily ATR is 103.1 and gold has used only 38.1 points today, 0.37x, running at 0.84x normal pace. Expected 5-day range from this regime is 3.59%, roughly 143 points.
The market is compressed harder than it has been all year and it is sitting on the line that decides everything.
Bottom Line
Gold broke the daily support and is now standing on the last real floor: the nine-touch rising trendline at 3,993, with the weekly close hours away. That is the whole trade.
Two things are pulling in opposite directions and both are legitimate. On the bear side, the break of 3,999 is real, structure is bearish on four of five timeframes, and the weekly demand zone lost its upper boundary at 4,059. On the bull side, the Hurst trough window is open now, the macro pressure eased from 100% bearish to 79%, the dollar went flat, and the 4H still holds a Higher Low.
The plan: today's weekly close is the signal, not the intraday noise. A close back above 4,059 with that trendline holding turns this into a fake break and a strong buy signal off a nine-touch line with a cycle low. A weekly close below the trendline breaks a structure that has held all year, and the next stop is 3,884, then open air toward 3,453.
Do not front-run it. A coil this tight for 55 days does not resolve quietly, and the expected move from here is roughly 143 points in five days. Whichever way it breaks, it will move fast. Wait for the close, then trade the direction it gives you. XAUUSD: Demand Holds, But Sellers Still Lead XAUUSD: Demand Holds, But Sellers Still Lead
Market Context
Gold is trading around 4,035 after reacting from the demand zone near the weekly bottom. Buyers are defending this area, but overall pressure remains bearish.
Stronger energy prices keep inflation concerns elevated, supporting a restrictive Fed outlook. At the same time, US-Iran tensions are boosting USD demand, limiting gold’s upside.
Key point: demand is holding, but buyers must reclaim 4,050 - 4,063 to strengthen the recovery.
Technical Structure
Gold is reacting from the Demand Zone at 4,015 - 4,025. This is the key support to hold.
Resistance sits at 4,050 - 4,063 (liquidity zone). Above that, the Main Supply Zone is 4,105 - 4,120.
If demand breaks, price may drop toward 3,980 - 3,990.
Key Levels
Current Price: 4,035
Demand Zone: 4,015 - 4,025
Liquidity Zone: 4,050 - 4,063
Supply Zone: 4,105 - 4,120
Weekly Low: 3,980 - 3,990
Bullish Above: 4,063
Bearish Below: 4,015
Trading Plan
Buy Scenario
Entry: 4,015 - 4,025
SL: Below 3,990
TP: 4,050 / 4,063 / 4,100
Condition: Hold demand + bullish confirmation. Only short-term buy.
Sell Scenario (Priority)
Entry: 4,050 - 4,063
SL: Above 4,085
TP: 4,035 / 4,020 / 3,990
Condition: Rejection at liquidity zone.
Sell at Supply
Entry: 4,105 - 4,120
SL: Above 4,140
TP: 4,063 / 4,035 / 4,015
Breakdown Sell
Entry: Below 4,015
SL: Above 4,035
TP: 3,990 / 3,980 / 3,960
Overall Bias
Gold is not bullish yet. Sellers still dominate unless price breaks above 4,063.
Best approach: wait for confirmation, avoid chasing.
Will gold break 4,063 or drop back below demand?
Long 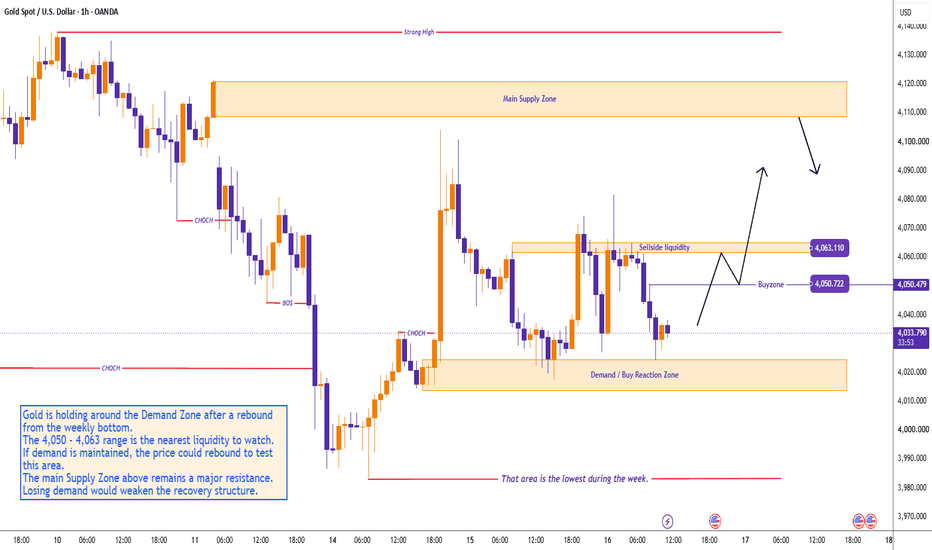
NIFTY50 - Breakout Could Trigger the Next Rally upto 24400+Nifty is currently consolidating inside a rising support and falling resistance structure, indicating that the index is gradually building momentum for a potential breakout. Over the past few sessions, buyers have consistently defended the rising support trendline, while sellers have repeatedly rejected prices near the descending resistance. This tightening price action suggests that a decisive move may be approaching.
The chart also highlights multiple failed attempts by bears to push the index below support. Each pullback has resulted in a higher low, reflecting improving buying interest. As price compresses closer to the resistance trendline, the probability of a breakout increases if bullish momentum continues.
Bullish Outlook
A sustained move above the 24,160–24,200 resistance zone would confirm the breakout and could trigger a sharp upside rally. Based on the height of the current consolidation pattern, the projected move points toward 24,250 as the first target, followed by 24,400+ if buying momentum remains strong.
Technical Highlights
✅ Rising support continues to hold, indicating strong buyer participation.
✅ Multiple higher lows suggest accumulation rather than distribution.
✅ Price is compressing below resistance, often a precursor to an impulsive move.
✅ Pattern projection indicates a strong upside expansion after breakout confirmation.
Key Levels
Immediate Resistance: 24,160–24,200
Target 1: 24,250+
Target 2: 24,400+
Support Zone: 24,020–24,050
Nifty is approaching a crucial breakout zone. If bulls manage to push the index above the descending resistance with strong volume, the current consolidation could transform into a strong bullish impulse, opening the path toward 24,250 and eventually 24,400+ in the coming sessions. Long 
 Long
Long
Stop Counting Rupees, Start Counting PercentagesOverview
Here's a mistake almost every new trader makes: they look at their profit and think only in rupee terms. "I made ₹500 today" or "I only made ₹1,000." But this way of thinking hides the real picture. Today, let's talk about why professional traders think differently — in percentages, not just rupees. We'll also touch on a related trap that catches a lot of beginners: option buying and the "hero zero" mindset.
The Problem With "Just ₹2,000"
Say you sell one hedged lot, and the capital required to hold that position is around ₹50,000. If you make a profit of ₹2,000, it's easy to say "that's just ₹2,000, nothing big." But look again — ₹2,000 on ₹50,000 capital is actually a 4% return. That's not small at all.
This is the core idea: the rupee number means nothing on its own. What matters is how much capital you used to make that money.
Let's Do the Math Together
Say you manage to make that same 4% return over 20 trading sessions in a month. That's:
• ₹2,000 per session × 20 sessions = ₹40,000
• On ₹50,000 capital, that's an 80% monthly return
Now, even if your returns are smaller — say just 2% per session — here's what happens:
• 2% of ₹50,000 = ₹1,000 per session
• ₹1,000 × 20 sessions = ₹20,000
• That's a 40% monthly return
(Note: this is before brokerage, taxes, and other trading costs, which will reduce the final number — but the concept still holds.)
Why This Shift in Thinking Matters
If you only look at the rupee amount, ₹500 or ₹1,000 a day can feel disappointing, especially when you compare it to a friend who made ₹5,000 in one trade. But that comparison is meaningless unless you know how much capital each person used.
Someone making ₹5,000 on ₹5,00,000 capital made 1%. Someone making ₹1,000 on ₹50,000 capital made 2%. The second trader actually performed better — even though the rupee number looks smaller.
The Other Trap: Option Buying and "Hero Zero"
It's worth remembering why options exist in the first place. They were introduced mainly as a hedging tool — a way for investors and institutions to protect their existing positions from unexpected price moves. That's the real purpose.
But somewhere along the way, many retail traders started treating options like a fast-track money-building machine instead — a way to turn small amounts into large profits quickly, rather than a tool to manage risk. This shift in purpose is a big part of why so many beginners end up in trouble.
Here's a pattern we see a lot with new traders. Someone enters the market, puts in ₹10,000, and buys one lot of options. If luck is on their side, they might see that ₹10,000 turn into ₹11,000 or ₹12,000 within minutes. Sometimes, on a lucky "hero zero" day, that money even doubles in a single session.
This feels incredible the first time it happens. But here's the problem — that one big win creates a dangerous belief: "this is easy, I can do this again." That belief leads to bigger and bigger bets, often without any real strategy behind them. Eventually, the same speed at which the money came in is the same speed at which it goes out — and often, all of it, in a single bad trade.
This isn't just a theory. SEBI's own study (Press Release No. 22/2024) found that 93% of individual F&O traders lost money between FY22 and FY24, with total losses crossing ₹1.81 lakh crore over that period. Only about 7% of individual traders were profitable. This is one of the clearest, most official confirmations that using options as a speculative shortcut, rather than the hedging tool they were designed to be, overwhelmingly does not work out for most people.
How to Start Thinking in Percentages
Here's a simple habit to build:
1. Know your capital. Always be clear on how much capital a trade actually requires — margin, hedge cost, whatever it is.
2. Calculate your return as a percentage, not just in rupees. Profit ÷ Capital used × 100.
3. Track this daily or per trade, and look at your average return over time — not just one big win or one bad day.
4. Multiply it out over a month to see the real picture of what consistent small returns can add up to.
A Common Beginner Mistake
New traders often chase the "big win" — a single trade that makes a large rupee amount — while ignoring small, consistent returns that compound over time. Worse, some let one lucky win convince them that gambling-style bets are a strategy. In reality, a trader making a steady 2-4% return per session, session after session, will almost always build wealth more safely than someone chasing one large, risky trade.
Beginner's Lesson
Professional traders don't get excited or upset over a single day's rupee number, and they don't chase the thrill of a lucky double either. They think in three things: percentage return, consistency, and risk management. These three, together, are what actually compound wealth over the long run — not any single big trade, and definitely not a gamble.
Conclusion
Next time you look at your profit for the day, don't just ask "how much did I make?" Ask "what percentage return was that on my capital?" And if you ever feel the pull of a "one big trade" mindset, remember what SEBI's own data shows: the vast majority of option buyers lose money over time. Consistency beats gambling, every single time.
For educational purposes only. Not financial advice. Trading involves risk — always manage your capital and risk carefully. Data referenced from SEBI Press Release No. 22/2024.
 Education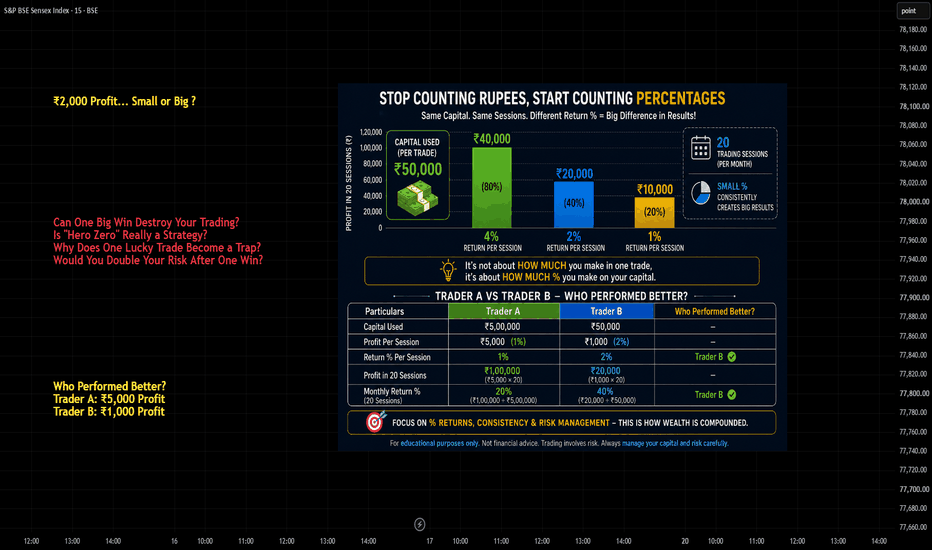
XAUUSD – Gold Stays Heavy, 4,000 Is The Level To Watch XAUUSD – Gold Stays Heavy, 4,000 Is The Level To Watch
Gold is still moving under pressure inside a wide descending channel.
Price is currently trading around 4,026 after failing to build a strong recovery from the lower area. The chart shows that every bounce is still limited below the FVG and channel resistance, which means sellers remain in control for now.
The key level is very clear: 4,000.
If gold breaks and accepts below this psychological level, bearish momentum may accelerate toward deeper support.
FUNDAMENTAL ANALYSIS
Gold remains pressured by a stronger U.S. dollar and rising inflation concerns linked to higher oil prices.
Market expectations around the Fed also remain important. If inflation risk stays elevated, traders may continue to price in a tighter policy outlook, which can limit gold’s upside.
Geopolitical tension may create volatility, but the chart still shows that gold has not confirmed a sustainable recovery yet.
TECHNICAL ANALYSIS – SMC + MARKET STRUCTURE
Gold is trading below the broader channel resistance and remains inside a descending structure.
From an SMC perspective, price has created several failed recovery attempts below the FVG zones. This shows that buyers are not strong enough to reclaim the upper structure.
The nearest FVG resistance is around 4,040 – 4,060. If gold retests this area and rejects, sellers may continue pushing price lower.
The more important bearish trigger is 4,000. A clean break below this level could expose the previous low area around 3,943 – 3,942. Below that, the wider channel suggests that the next structural downside area may be much lower if selling pressure expands.
KEY PRICE ZONES
Current price: 4,026
Near resistance: 4,040 – 4,060
Sell reaction zone: 4,060 – 4,080
Psychological support: 4,000
Previous low area: 3,943 – 3,942
Lower channel support: 3,675
Bearish below: 4,000
Invalidation for sell view: Above 4,080
TRADING SCENARIOS
Sell Scenario
Sell Zone: 4,040 – 4,080
Entry: Bearish rejection, failed reclaim, or lower-timeframe CHoCH
SL: Above 4,080
TP1: 4,000
TP2: 3,943 – 3,942
TP3: Lower channel support if momentum expands
Breakdown Sell
Below 4,000 after confirmation → Target 3,943 – 3,942
Buy Scenario
Buy is not the priority view while gold stays below the FVG resistance.
Buy Zone: Around 4,000 only if strong reaction appears
Entry: Liquidity sweep, bullish rejection, or CHoCH
TP1: 4,040
TP2: 4,060
Invalidation: If price breaks and holds below 4,000, the buy reaction becomes weak.
MY VIEW
Gold is still heavy.
The market is stabilizing slightly, but the recovery is not strong enough yet. As long as price stays below 4,060 – 4,080, sellers still have the better structure.
The most important level is 4,000.
If gold breaks below it clearly, the next downside target may open toward 3,943 – 3,942.
For now, I prefer waiting for either a rejection from FVG resistance or a confirmed break below 4,000.
Do you think gold will defend 4,000, or will sellers break it and push price toward the previous low?
Long 
NIFTY – INTRADAY TRADING PLAN | 17-Jul-2026Reference Close: 24,081.10 | O: 24,071.15 | H: 24,090.15 | L: 24,050.00
Namaste Traders! 🙏 Below is a structured, educational trading plan built around key support/resistance zones for tomorrow's session. This plan covers all three opening scenarios — Gap Up, Flat, and Gap Down — considering a gap threshold of 100+ points. Please read the chart legend carefully before proceeding. ⬇️
🗺️ Chart Legend (Important!)
• 🟠 Orange Line/Zone (No Trade Zone) — Sideways/consolidation area. Avoid fresh positions here; market is undecided.
• 🟢 Green Line — Bullish structure / Long bias confirmed once broken with strength.
• 🔴 Red Line — Bearish structure / Short bias confirmed once broken with weakness.
• ➖ Dashed Lines (Green/Red) — "Maybe" zones — trend may or may not continue here. Treat as extended targets, not guaranteed moves. Trail SL and book partial profits.
🔑 Key Levels for 15-Jul-2026
• 🟠 No Trade Zone: 24,032 – 24,098
• 🟢 Last Intraday Resistance: 24,288 – 24,327
• 🔴 Last Intraday Support: 23,901 – 23,937
• 🟢 Major Extended Resistance: 24,509
• 🟢 Buyer's Support (Consolidation Zone): 23,681 – 23,747
🟢 SCENARIO 1: GAP UP OPENING (100+ points, i.e., open above ~24,181)
📘 Explanation: A gap up of 100+ points means the market opens well above the No Trade Zone (24,032–24,098), directly approaching or crossing the Last Intraday Resistance zone (24,288–24,327). This shows strong overnight bullish sentiment (positive global cues/news).
📌 Plan of Action:
• If Nifty opens above 24,181 and sustains above 24,288–24,327 on 15-min candle close basis → Bullish continuation confirmed (green zone breakout).
• 🎯 Enter long only on a retest & hold of 24,288–24,327 as support, not on first impulsive candle — avoid chasing.
• Target 1: 24,400 | Target 2: 24,509 (Major Resistance — dashed green zone, trend "may" extend further, trail SL here).
• Stop Loss: Below 24,288 (zone breakdown invalidates bullish setup).
• ⚠️ If price gaps up but immediately slips back into the No Trade Zone (24,032–24,098), treat it as a gap-fill trap — stay out until a clear direction emerges.
• For Options: Prefer Bull Call Spread or slightly OTM Calls with a defined SL; avoid deep ITM naked buying right at open due to high IV crush risk.
📌 📌 📌
🟠 SCENARIO 2: FLAT OPENING (Within ±100 points, inside/near No Trade Zone 24,032–24,098)
📘 Explanation: A flat opening means the gap is less than 100 points and price opens within or very close to the No Trade Zone. This is a battle zone between bulls and bears — low conviction, higher chances of whipsaws (as shown by the orange dashed zig-zag on chart).
📌 Plan of Action:
• 🚫 Avoid trading immediately at open — this is a "No Trade Zone." Let the first 15–30 minutes establish direction.
• If price breaks above 24,098 and sustains → shift bias to bullish, follow Gap Up scenario targets (24,288 → 24,327 → 24,509).
• If price breaks below 24,032 and sustains → shift bias to bearish, follow Gap Down scenario targets (23,937 → 23,901 → 23,747).
• 🎯 Best approach: Wait for a breakout + retest on either side of the No Trade Zone before committing capital.
• For Options: This is the ideal zone for Option Sellers (Iron Condor / Short Straddle with hedge) since range-bound moves favor time decay. Directional traders should sit on hands until breakout confirmation.
📌 📌 📌
🔴 SCENARIO 3: GAP DOWN OPENING (100+ points, i.e., open below ~23,981)
📘 Explanation: A gap down of 100+ points pushes the market below the No Trade Zone straight toward the Last Intraday Support zone (23,901–23,937). This indicates weak sentiment (negative global cues/news) and sellers are in control from the open.
📌 Plan of Action:
• If Nifty opens below 23,981 and sustains below 23,901–23,937 on 15-min candle close basis → Bearish continuation confirmed (red zone breakdown).
• 🎯 Enter short only on a pullback/retest of 23,901–23,937 turning into resistance — don't short blindly at open.
• Target 1: 23,800 | Target 2: 23,681–23,747 (Buyer's Support/Consolidation Zone — dashed red zone, trend "may" extend further, book partial profits and trail SL).
• Stop Loss: Above 23,937 (zone reclaim invalidates bearish setup).
• ⚠️ Watch for a sharp reversal (V-shape recovery) back into the No Trade Zone — if 24,032 is reclaimed intraday, exit shorts immediately.
• For Options: Prefer Bear Put Spread or slightly OTM Puts with strict SL; avoid over-leveraging on gap-down panic as sharp pullback rallies are common.
📌 📌 📌
⚙️ RISK MANAGEMENT TIPS FOR OPTIONS TRADING 🛡️
• 💰 Never risk more than 1–2% of total capital on a single options trade.
• 📉 Always use a hard Stop Loss — options can decay fast; don't rely on mental SL.
• ⏱️ Avoid buying options right at market open during high volatility — let IV settle for 10-15 minutes.
• 🎯 Book partial profits at Target 1, trail SL to cost for the remaining position at Target 2.
• 🚫 Avoid overtrading in the No Trade Zone — capital preservation is a win too.
• 📊 Always align option strikes with liquidity (tight bid-ask spread) to avoid slippage.
• 🧘 Avoid revenge trading after a SL hit — stick to the plan, not emotions.
• 📅 Be mindful of time decay (Theta) — avoid holding weekly options overnight without strong conviction.
📝 SUMMARY & CONCLUSION
Tomorrow's session hinges on how price reacts around the No Trade Zone (24,032–24,098). A Gap Up (100+) opens the door toward 24,288–24,327 and further to 24,509 (bullish path 🟢). A Gap Down (100+) opens the door toward 23,901–23,937 and further to 23,681–23,747 (bearish path 🔴). A Flat opening keeps the market range-bound until a decisive breakout occurs — patience is key here 🟠. Always wait for confirmation candles and respect stop losses. Trade the plan, not your emotions! 🎯
⚠️ Disclaimer: I am not a SEBI registered analyst. This post is for educational purposes only and should not be considered as investment/trading advice. Please consult your financial advisor and do your own research before making any trading/investment decisions. Trading in equities/options/derivatives is subject to market risk. 🙏 Short 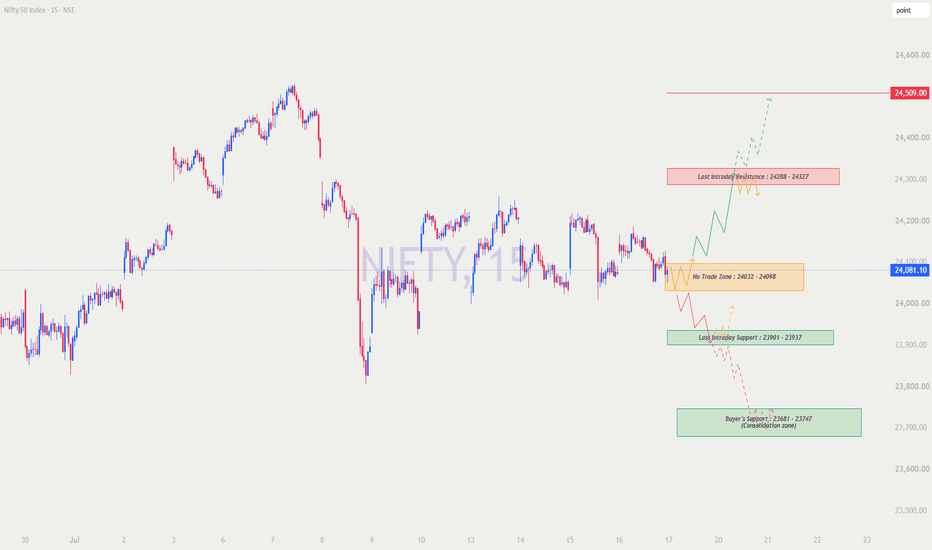
 Long
Long
 Long
Long