WHY I DON’T TRUST THIS GOLD CRASH YETJust like last Friday’s CPI, we saw another strong sell-off in Gold during FOMC. But even after that move, I’m still thinking about the same question I’ve been discussing for the last few days.
**If sellers are really that strong, why is the market still struggling to accept lower prices?**
The $4280–$4320 area had been acting as strong support for several weeks. On Monday, we finally saw a breakdown below it. Normally, when an important support breaks after being tested multiple times, especially with strong momentum, I expect price to accept the lower range and continue falling.
But that hasn’t happened here.
On Monday and Tuesday, every attempt to stay lower eventually turned into a reversal. On Wednesday, price managed to move back higher, and then FOMC brought another aggressive sell-off that pushed Gold below $4280 again.
And what happened after that?
Once again, price started recovering.
This is what makes the current price action so interesting for me. Sellers are clearly putting serious pressure on the market. We’ve seen sharp downside moves, strong bearish candles and repeated attempts to push Gold lower. But despite all that effort, they’re still struggling to keep price at those lower levels.
For me, that matters more than the fall itself.
If yesterday’s FOMC move had given sellers complete control, I would expect a very limited retracement. Price should fall, recover slightly, and then continue lower. Instead, Gold has already recovered more than 50% of that bearish move.
That tells me buyers are still fighting. They haven’t completely given up control yet.
This is also why I’m keeping myself neutral instead of blindly becoming bearish just because we had a major support breakdown and an FOMC sell-off. Until the market clearly proves that it can accept and hold lower prices, I’m more interested in understanding where traders are getting trapped and where the next pool of stop losses is sitting.
Now coming to my plan.
After the FOMC fall, Gold is once again recovering, and today we saw resistance around $4318. No doubt, after yesterday’s sell-off, a lot of traders are already bearish. And traders who missed the sell from higher prices may now be looking at this recovery into $4318 as another opportunity to short.
That’s exactly what makes this area interesting.
I wouldn’t be surprised if price stays weak below $4318 for some time and gives sellers even more confidence that another fall is coming. But personally, I’m watching for those sellers to get trapped and for price to eventually break higher.
If that happens, **$4330 is the next area I’m targeting.**
For now, my bullish plan remains valid as long as Gold stays above **$4272**, because I’m treating that area as an important support for today.
So I’ll personally be looking to work with the buying side while that level continues to hold.
At the end of the day, sellers have already proved that they can push Gold down. That’s not the question anymore.
**The real question is: if sellers are really in control, why can’t they keep Gold down?**
That’s the part I’m watching very closely now.
What’s your view? Do you think Gold finally accepts lower prices, or are sellers being trapped before another move higher? Let me know in the comments.
 Long
Long
#NIFTY Intraday Support and Resistance Levels - 17/09/2026Nifty 50 is expected to open flat around the 23,200–23,250 zone. The index is currently near 23,224, sitting between an important support at 23,200 and immediate resistance around 23,250. Recent price action shows consolidation after the sharp decline, making this narrow range crucial for today's directional move.
On the bullish side, Nifty needs to reclaim and sustain above 23,250. A confirmed move above this level can trigger a recovery toward 23,350, 23,400 and 23,450+. The 23,450 area remains an important higher resistance, so stronger upside momentum would require the index to eventually clear this zone.
On the bearish side, 23,200 is the key level to monitor. If Nifty breaks and sustains below 23,200, selling pressure can resume toward 23,100, 23,050 and 23,000. The 23,000–23,000 region is an important support zone where some buying response may emerge.
For today's session, 23,200–23,250 is the main decision zone. Since the market is expected to open inside this narrow range, initial price action could remain choppy. Traders can wait for a sustained move outside this zone rather than chasing moves within it. #BANKNIFTY Intraday PE & CE Levels(17/09/2026)Bank Nifty is expected to open flat around the 56,250–56,300 zone. The index has recovered strongly from the recent lows near 55,800 and is now trading around 56,292, but it remains between important support and resistance levels. This makes the opening zone crucial for determining the intraday direction.
On the bullish side, the 56,050–56,100 zone is an important support area. As long as Bank Nifty sustains above this region, the recovery can continue toward 56,250, 56,350 and 56,450. A clean and sustained breakout above 56,550 would strengthen the bullish structure and can open the way toward 56,750, 56,850 and 56,950+.
On the bearish side, 56,450–56,550 is an important resistance zone. If the index moves into this area but fails to sustain and shows rejection, selling pressure could return toward 56,250, 56,150 and 56,050. A decisive breakdown below 55,950 would weaken the structure further, with downside levels around 55,750, 55,650 and 55,550.
For today's session, 56,050 on the downside and 56,450–56,550 on the upside form the broader decision-making range. Since the opening is expected to be flat and inside this range, traders should avoid chasing the initial move and wait for price confirmation around these key levels. Gold Pre-FOMC: 4,260 Sweep Before 4,370?
Market Overview
• Macro Driver: Spot Gold hovers near $4,313 on Wednesday, September 16, 2026, as global markets brace for today's pivotal FOMC Interest Rate Decision and the release of the updated Summary of Economic Projections (SEP / Dot Plot). While policy rates are widely projected to remain steady at 3.50%–3.75%, institutional desks are hyper-focused on Fed Chair Kevin Warsh's forward guidance regarding persistent underlying inflation and balance sheet velocity.
• Market Condition: Institutional order flow reflects a classic pre-FOMC volatility compression. After absorbing sell-side liquidity at the 4,260 Demand Zone, smart money is coiling price within a tight range between the 4,260 base and 4,320 Resistance Zone, preparing for an aggressive post-announcement directional expansion toward overhead channel resistance.
Technical Context
• Structure: Re-Accumulation within Bearish Descending Channel. On the 1H timeframe, Gold remains bound beneath the multi-week descending trendline from the 4,511.089 Strong High. Following multiple CHoCH and BOS downside sweeps, price printed a double-bottom absorption at the Demand Zone (4,260 – 4,275).
• Liquidity & Imbalance: Price delivery shows immediate rejection at the 4,310–4,320 Resistance Zone (current market price: 4,313.03). The technical roadmap anticipates a shallow corrective retest into the 4,260–4,275 Demand Zone to engineer final buy-side liquidity, followed by an impulsive breakout push piercing through 4,320 to target the Intermediate Supply Block (4,350 – 4,370) and test the descending channel ceiling.
Key Zones
• Macro Structural Ceiling (Strong High): 4,511.08
• Upper Supply Block: 4,420.000 – 4,435.000
• Intermediate Supply Target (Blue Box): 4,350.00 – 4,370.00
• Immediate Overhead Resistance Zone (Grey Box): 4,310.00 – 4,322.00
• Current Market Price: 4,313.03
• Structural Demand Zone Base (Grey Box): 4,260.00 – 4,275.00
Trading Plan (IF–THEN)
• IF price delivers a corrective liquidity tap into the 4,260 – 4,275 Demand Zone AND validates lower-timeframe (M5/M15) bullish displacement/CHoCH -> THEN look to execute Long positions targeting 4,315, expanding through 4,322 directly toward the 4,350.00 – 4,370.00 Intermediate Supply / trendline ceiling.
• IF price confirms a decisive 1H close below 4,250 during the FOMC rate release -> THEN the demand accumulation thesis is invalidated, unlocking a deeper sell-side flush toward 4,220.
MMFLOW View
• Bias: Pre-News Accumulation / Post-FOMC Bullish Expansion. Fading the range midpoint at 4,313 ahead of the Fed rate decision presents poor risk-to-reward; our mathematical edge favors buying verified liquidity defenses at the 4,260–4,275 demand floor to ride the expansion wave into descending channel resistance.  Long
Long
Gold (XAUUSD) – 15M Technical AnalysisGold is currently showing a potential Head & Shoulders formation on the 15-minute chart.
🔹 Key Resistance: 4,318.76
🔹 Neckline / Key Level: 4,278.78
🔹 Current Price: around 4,278
🔹 Immediate Support: 4,252.12
🔹 Next Supports: 4,236.40 → 4,214.00
🔹 Major Downside Zone: 4,103.12
🔻 Bearish Scenario
Price is testing the 4,278.78 neckline area. A decisive 15M candle close below this level could strengthen the bearish setup, with potential moves toward 4,252 → 4,236 → 4,214.
🔼 Bullish Scenario
If price successfully holds the neckline and breaks back above the right-shoulder zone, the bearish pattern could weaken. A sustained move above 4,318.76 would invalidate the current Head & Shoulders structure.
🎯 Key Observation
4,278.78 is the level to watch.
Below it → bearish pressure can increase.
Above it → price may continue consolidating or attempt a recovery.
Trade with confirmation rather than anticipating the breakout.
#XAUUSD #Gold #GoldTrading #TechnicalAnalysis #Forex #TradingView #PriceAction #HeadAndShoulders #GoldAnalysis #ForexTrading #TradingSetup Short 
Nifty50 analysis(17/9/2026).HOPE YOU HAVE A GREAT DAY.
CPR: inside cpr : sideway / breakout
FII: -2,032.61 sold
DII: 3,908.23 bought.
Highest OI:
CALL OI: 23400
PUT OI: 23200,23000
Resistance: - 23300
Support : - 23000
conclusion:.
My pov
1.Almost neutral around 23200 , today expected to be sideways / breakout due to cpr , so market expected to trade between 23300 to 23000.
2. MA line seems slope down, we are in bearish market ,price breakout 23200 we can anticipate 23000.
3. if price is bullish, 23400 can act as resistance and fall towards 23000
Psychology:
“Choice, not chance, determines your destiny.”
― Aristotle
note:
My point of view is fully towards technical not news driven , if global news affects the market my pov can be totally wrong.
8moving average ling is blue colour.
20moving average line is green colour
50moving average line is red colour.
200moving average line is black colour.
cpr is for trend analysis.
MA line is for support and resistance.
Disclaimer:
Iam not Sebi registered so i started this as a hobby, please do your own analysis, any profit/loss you gained is not my concern. I can be wrong please do not take it seriously thank you.+
SSL Sweep Before Recovery WaveFundamental Analysis
Gold remains under pressure ahead of the September 16 Fed decision. Markets are pricing roughly a 94% chance of a 25 bp rate hike, while the U.S. 10-year yield has climbed above 5% and oil near $108 is reinforcing inflation concerns. These conditions continue to support the dollar and limit Gold’s recovery for now.
Technical Analysis
On H1, Gold remains in a bearish structure after the latest CHoCH and BOS, with price now near 4,284.
The key area is the 4,252–4,262 SSL. A final liquidity sweep into this zone could complete the bearish wave and create a cleaner base for recovery.
If buyers confirm from SSL, the first upside reaction area is the 4,332–4,346 Fibo Zone + VAL, followed by the 4,366–4,382 POC.
Important Key Levels
4,425–4,438 — OB + Support / Major Resistance
4,366–4,382 — POC
4,332–4,346 — Fibo Zone + VAL
4,252–4,262 — SSL / Main Liquidity
Trading Scenario
Buy priority comes only after a sweep into 4,252–4,262 followed by bullish H1 confirmation.
Target: 4,332–4,346 first, then 4,366–4,382.
Invalidation: H1 acceptance below the SSL zone.
Overall View
The H1 trend is still bearish, so buying early is less attractive. The cleaner setup is to let Gold take lower liquidity first, then watch for a confirmed recovery toward the Fibo Zone and POC.
Will Gold sweep the SSL before starting the next recovery wave? Long 
XAUUSD — Bullish Recovery After the PullbackMarket Pulse
Gold is recovering ahead of the Fed decision as the U.S. dollar, Treasury yields and oil prices ease.
A 25 bp rate hike is largely expected, so the bigger reaction may come from the Fed’s guidance. This could keep Gold volatile around the announcement.
What the Chart Says
XAUUSD is showing a stronger short-term recovery on H1.
Price has climbed from the 4,270 area and is now holding around 4,340, after breaking back above previous short-term structure.
The nearest support sits around 4,330–4,340. If this area holds, buyers may try to continue the recovery.
The next resistance is around 4,345–4,355. A clean move above this zone could open the way toward the stronger 4,395–4,405 resistance area.
A deeper pullback could still reach 4,300–4,320, which remains the stronger demand zone below.
Levels That Matter
4,395–4,405 — Main upside resistance
4,345–4,355 — First resistance
4,330–4,340 — Near-term support
4,300–4,320 — Main demand zone
4,270–4,280 — Recent swing support
My Main Plan
The main plan is bullish.
I prefer waiting for price to hold above 4,330–4,340 or make a controlled pullback toward 4,300–4,320.
If buyers return with clear confirmation, Gold could first challenge 4,345–4,355.
A clean breakout above that area may extend the recovery toward 4,395–4,405.
What I Need to See
I want to see the current recovery keep forming higher lows and price hold above the marked support structure.
A sustained H1 move below 4,300 would weaken the immediate bullish setup.
Final Read
The short-term H1 picture is improving, but Gold is approaching resistance just before the Fed decision.
For now, I prefer waiting for a pullback and bullish confirmation rather than chasing the move higher, with 4,395–4,405 remaining the main recovery target. Long 
XAUUSD — Bullish Retest Ahead of the FedFundamental Analysis
Gold is recovering ahead of today’s Fed decision as the U.S. dollar softens, Treasury yields retreat and oil prices ease. Markets currently price roughly a 92%–93% probability of a 25 bp hike, which would lift the target range to 3.75%–4.00%. With the hike largely priced in, the bigger reaction may come from the Fed’s guidance and outlook for further tightening.
Brent has eased toward $108 as Saudi Arabia offers additional crude via Oman and U.S. inventories rise, temporarily reducing some inflation pressure.
Technical Analysis
On H1, XAUUSD is trading near 4,348 after a strong rebound from the 4,268–4,280 demand area.
Price is now testing the descending resistance trendline and the 4,341–4,353 Fibonacci 0.786–0.618 zone. This area is the key short-term decision point.
If buyers defend the zone and price confirms a breakout/reclaim above the trendline, the next objectives sit near 4,368, followed by 4,378–4,394.
The 4,327 structure low remains the critical bullish invalidation level.
Important Key Levels
4,378–4,394 — Main target zone
4,368 — Intermediate resistance
4,341–4,353 — Main buy zone
4,327 — Key support / invalidation
4,295–4,315 — Deeper demand
Trading Scenario
Main Buy Setup
Entry: 4,341–4,353
Stop Loss: 4,324
Take Profit 1: 4,368
Take Profit 2: 4,378
Take Profit 3: 4,390–4,394
Buy Condition
Wait for the 4,341–4,353 zone to hold with bullish confirmation. A liquidity sweep, bullish engulfing candle, strong H1 reclaim, or confirmed break above the descending trendline would strengthen the setup.
A sustained H1 break below 4,327 invalidates the immediate bullish scenario.
Overall View
The short-term H1 structure is shifting toward recovery, but price is still confronting the major descending trendline. The preferred plan is to buy only after confirmation around 4,341–4,353, targeting 4,368 and 4,378–4,394.
With the Fed hike largely priced in, forward guidance may matter more than the rate decision itself for the next major Gold move.
Will Gold hold 4,341–4,353 and break the trendline before the Fed decision? Long 
SSL Sweep Before RecoveryFundamental Analysis
Gold remains under pressure ahead of the Fed meeting on September 15–16. Markets are pricing roughly an 89% probability of a 25 bp rate hike, while the U.S. dollar has reached a one-week high and the 10-year Treasury yield is near 5%. Brent above $107 is also keeping inflation concerns elevated. Middle East tensions still provide some safe-haven support, but the macro environment remains difficult for Gold in the short term.
Technical Analysis
On H1, Gold remains in a bearish structure after repeated CHoCH signals and lower lows.
Price is now trading near 4,296, close to the previous low around 4,277. The next important area is the 4,245–4,260 SSL, where a final liquidity sweep could complete the current bearish wave.
If buyers react strongly there, Gold may recover toward the 4,340–4,360 Fibo Zone, followed by the 4,400–4,420 POC.
Important Key Levels
4,490–4,510 — OB + Support / Major Resistance
4,400–4,420 — POC
4,340–4,360 — Fibo Zone
4,245–4,260 — SSL / Main Liquidity
Trading Scenario
Buy priority comes only after a sweep into 4,245–4,260 followed by bullish H1 confirmation.
Target: 4,340–4,360 first, then 4,400–4,420.
Invalidation: H1 acceptance below the SSL zone.
Overall View
The H1 structure remains bearish, so buying early is less attractive. The cleaner setup is to wait for lower liquidity to be taken before looking for a recovery wave.
Will Gold sweep the SSL first before recovering toward 4,400? Long 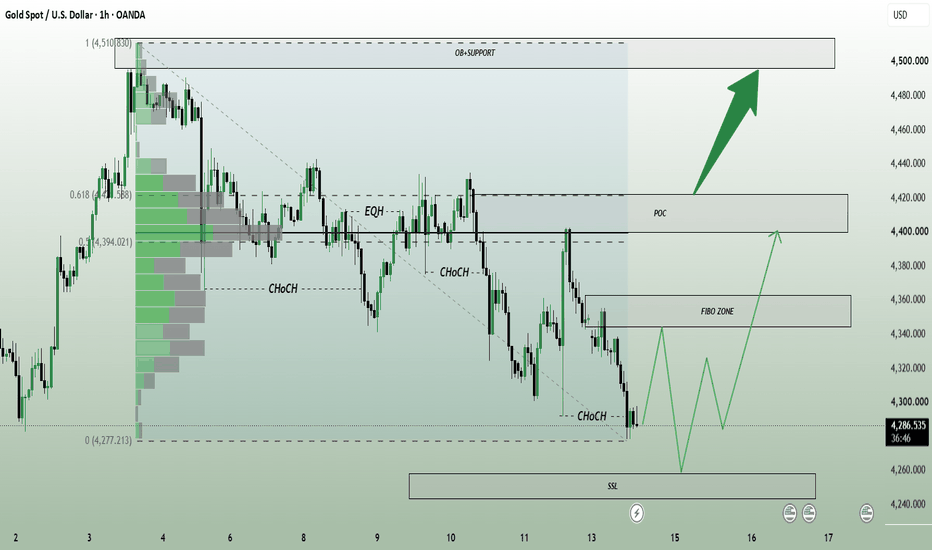
XAU/USD - Control Wave, Bulls Waiting BreakoutOANDA:XAUUSD is holding inside the 4,261–4,331 buy zone, while the long descending trendline continues to cap every recovery attempt. This is now a clear decision area: support is still alive, but buyers need to break the trendline before the structure turns convincingly bullish.
If 4,261–4,331 holds and Gold breaks above the descending trendline, I’m watching:
🎯 Target 1: 4,440
🎯 Target 2: 4,500
A sustained break below 4,261 would invalidate the bullish recovery setup.
AURICVERSE View: Gold has the support, but not yet the confirmation. Hold the floor + break the trendline, and 4,440–4,500 becomes the next recovery zone on my radar. Long 
 Long
Long
BTCUSDT: Strong bearish momentum, Bears pressureBTCUSDT is trading around 75,830 USDT after breaking below the 76,300–77,200 support zone. This breakdown was accompanied by strong selling pressure; with the price currently sitting below both the EMA34 (approx. 76,965) and EMA89 (approx. 77,210), sellers remain in control of the H1 market structure.
The 76,300–77,200 zone has now shifted into a retest resistance area. If BTC rallies to this region but fails to reclaim the EMA cluster, I lean towards a scenario where the price continues to decline to 75,000, subsequently extending toward the primary target near 74,200 USDT.
Macro factors today also reinforce the bearish outlook. Reuters reported that Bitcoin fell to around 75,816 USD after the US Senate failed to pass a procedural step for the Clarity Act; meanwhile, the 10-year Treasury yield has surpassed 5%, and the market is pricing in a greater than 90% probability of a 25bp rate hike by the Fed in today's decision.
The bearish scenario would weaken if BTC decisively reclaims the 77,200–77,500 range.
Will BTC retest the breakdown zone before continuing toward 74.2K? Short 
Is Gold Just Rebounding Before the Next Move Lower?Hello traders, if we put short-term noise aside and look at XAUUSD in a disciplined and objective way, the current picture is sending a fairly clear message: the bearish trend has not been broken yet.
Looking at the broader backdrop, pressure on gold remains as hotter-than-expected U.S. inflation has increased expectations of a Fed rate hike, while U.S. Treasury yields continue to stay elevated. This keeps the interest-rate environment unfavorable for a non-yielding asset like gold. In other words, the current rebound still lacks the fundamental catalyst needed to signal the beginning of a new uptrend.
Moving to the H4 chart, the bearish structure remains quite clear:
Price continues to trade below the descending trendline, with a consistent sequence of lower highs.
The area around 4,365 is not random: the descending trendline and the Ichimoku zone converge here, creating an important defensive area for sellers.
Recent recovery attempts have lacked follow-through, suggesting that buyers have yet to regain meaningful control.
What stands out is this: every time gold approaches the resistance area above, selling pressure returns relatively quickly. When a market repeatedly fails to break resistance despite several recovery attempts, it often signals that sellers are still controlling the structure.
📌 Highest-probability scenario:
As long as XAUUSD remains below 4,365 and the descending trendline stays intact, I expect the current rebound to face renewed selling pressure, with my main target around 4,225. Only a decisive and sustained breakout above the bearish structure would make me reassess this scenario. Short 
H1 Bearish Retest Toward Previous SupportXAUUSD is trading around 4,291 after another bearish leg pushed price back into the 4,275–4,295 Current Demand Zone. H1 structure remains bearish beneath the descending trendline, but price is now sitting near support, so chasing fresh shorts at current levels is less attractive.
The macro backdrop remains heavy for gold ahead of today’s Fed decision. Markets are pricing roughly a 90% probability of a 25 bp rate hike, while the U.S. dollar remains firm and Treasury yields recently reached their highest levels since 2007. Oil has eased slightly today but remains above $100, keeping inflation concerns elevated. The FOMC statement is due at 2:00 p.m. ET, followed by Chair Kevin Warsh’s press conference at 2:30 p.m. ET.
Technical View
The H1 structure continues to print lower highs and bearish structural breaks.
Price is currently reacting from the 4,275–4,295 demand zone, so a corrective rebound may develop before the next bearish leg.
The first important recovery area is around 4,335–4,360, but the cleaner sell location sits higher at the 4,375–4,390 Order Block, where the descending resistance structure also aligns.
If sellers defend this zone, the next downside objective is the 4,254 previous support.
Above that, 4,425–4,450 Supply remains the stronger resistance area, while 4,500–4,515 Major Supply is the higher-timeframe ceiling.
Key Zones
Current Price: 4,291.440
Current Demand: 4,275–4,295
Sell Priority / Order Block: 4,375–4,390
Supply Zone: 4,425–4,450
Major Supply: 4,500–4,515
Downside Target / Previous Support: 4,254.130
Trading Plan
Sell Priority: 4,375–4,390
Condition: wait for an H1 recovery into the Order Block followed by bearish rejection, failed acceptance or lower-high confirmation.
TP1: 4,300–4,285
TP2: 4,254
Invalidation: sustained H1 acceptance above the Order Block and descending resistance structure would weaken the immediate bearish setup.
Sell View
The preferred approach is not to chase shorts around 4,290 because price is already sitting inside demand.
A corrective recovery toward 4,375–4,390 would provide a cleaner location to evaluate seller response. With the Fed decision approaching, a liquidity sweep above nearby resistance remains possible before direction becomes clearer.
Final View
Gold remains bearish on H1, while the macro environment continues to favor higher rates, a firm dollar and elevated yields.
The main scenario is a rebound from current demand into 4,375–4,390, followed by renewed bearish continuation toward 4,254.
Will the Fed trigger the H1 retest into the bearish Order Block before gold attacks previous support? Short 
Why a Failed Senate Vote Wiped Out $500M in CryptoA single failed Senate vote this week wiped nearly 4% of the entire crypto market's value , and over 500 million dollars in forced liquidations across the market in the hours that followed. Bitcoin fell. Ethereum fell. Chainlink, Aave, Bitcoin Cash, Aptos, Ethena- every major name fell, most of them with no company-specific news of their own at all. This wasn't a hack, scandal, or technical failure - this was a legislative procedure vote that didn't pass.
This article goes over exactly what happened, why leverage turns a political disappointment into a violent marketwide selloff , and why some coins fell far harder than others during the event.
What actually happened
The Senate failed to advance the CLARITY Act , a bill meant to set clearer regulatory rules for the crypto industry here in the US. Crypto markets had priced in progress toward this legislation, since regulatory clarity has been one of the biggest overhangs preventing broader institutional adoption for years. When the vote failed to advance the bill forward, that progress did not materialize, and the market reacted quickly. At the same time, rising odds of a Federal Reserve rate hike were already weighing on risk assets across the board. These two things - a disappointing regulatory outcome and rising expectations of tighter monetary policy - came together to form a single, sharp, risk-off move for the entire crypto market simultaneously.
Why a bill not passing crashes coins that have nothing to do with the bill
It's easy to confuse new traders as to why this happened. Chainlink, Aave, and Bitcoin Cash have entirely different use cases, teams, and fundamentals. None of them are directly regulated or affected by this specific legislation any more than any other token, but they all fell together, and several fell by more than Bitcoin did.
This happens because crypto assets become highly correlated during a risk-off event . During such a move, traders and funds don't sell their disappointing bet and keep holding everything else in their portfolios steady. They reduce risk broadly across their entire portfolio , because the source of the fear - a regulatory uncertainty or a macro tightening expectation - applies to the asset class itself, and not to any coin's specific fundamentals.
Why leverage turns a dip into a $500 million cascade
This is where the real damage multiplies. A large amount of crypto trading happens through leverage - that is, traders borrowing money to control a position bigger than their capital in order to magnify their gains. This works well while their prices march higher, but as soon as their prices start to fall by even a modest amount, the exchanges forcibly close, or liquidate, these leveraged positions to prevent the trader's losses from going beyond what they actually put up.
As prices began to fall from the failed vote, leveraged long positions across many coins hit their liquidation thresholds. Exchanges automatically sold those positions into a falling market, which further pushed prices down, and then triggered the next layer of liquidations at a slightly lower price, and so on. This is how a single piece of news, one that might have caused a modest orderly pullback on its own, ended up resulting in over 500 million dollars of forced selling within a matter of hours , none of it a voluntary action by the traders involved.
Why some coins fell so much harder than others
Looking at the actual figures during the event, Aave fell over 6% , Aptos fell nearly 8% , Bittensor fell nearly 8% , and Bitcoin - the largest, most stable crypto asset - fell by a noticeably smaller percentage.
This is because of something called beta , a measure of how much an asset tends to move compared to the broader market during a given event. Smaller, more speculative altcoins tend to carry higher beta than Bitcoin - that is, they tend to magnify any move the broader crypto market makes, in both directions. During a risk-off event like this, this higher beta works against the holders of these tokens, turning a moderate market-wide decline into a much sharper drop for these specific tokens. One analysis of Ethena's drop during this particular event specifically noted that the higher beta that Ethena typically has amplified what was a broad, macro-driven move, not something specific to the project.
The bigger pattern worth understanding
This is a signature you'll see repeatedly in crypto. A macro/regulatory headline hits . Broad, correlated selling begins across the entire asset class. Leveraged positions get forcibly closed , accelerating the initial move far beyond what the news itself would justify. Higher beta, more speculative tokens fall hardest , and larger, more established assets fall by comparison less, even though everything falls together.
Recognizing this signature is important because it tells you that a sharp, broad selloff like this one isn't necessarily a judgment on any given individual project's fundamentals. It's often a mechanically-driven reaction to a single piece of news that happens to have occurred at a time when a large amount of leverage was sitting in the market.
How to actually think about this as a trader
Check if a crypto selloff is broad-based across unrelated tokens or concentrated in one coin, because a broad, correlated move implies a macro/regulatory trigger amplified by leverage, and not project-specific bad news.
Pay attention to overall market leverage levels - sometimes visible around open interest and funding rates - because elevated leverage leading up to a known event can increase the odds that a disappointing outcome gets amplified into a much larger cascade than the news alone would justify.
Remember that higher-beta altcoins will almost always move more than Bitcoin during both broad rallies and selloffs, so if you're holding small altcoins through a known event risk, you are essentially accepting amplified moves in both directions.
Watch for the immediate aftermath of a liquidation cascade rather than only the initial drop, because these events can cause sharp, temporary overshoots to the downside as forced selling clears out, followed by a partial recovery once the leveraged positions causing the extra selling pressure have already been liquidated.
My Conclusion
A failed vote in Washington wiped out half a billion dollars in crypto positions within hours , and most of the coins' falls in the selloff had absolutely nothing to do with the bill itself. This is the nature of a leveraged, highly correlated market - a single piece of disappointing news doesn't just move the asset it's actually about, but it can cause a mechanical cascade across an entire asset class , hitting hardest wherever the most leverage and highest beta happen to be.
Thank you
@VertexQore Education 
Intraday trading plan for Nifty/Sensex.Nifty 50: Get Ready for Another Drop
The Nifty 50 chart is showing clear warning signs right now. Even though the price has paused a bit, the sellers are still in control of the market, and we could see another big drop very soon.
Important Levels to Watch
The Critical Level: 23,200 is very critical at the moment for today.
The Major Floor (Support): 22,400 – 22,500 (This is the big blue line on the chart).
Trade Plan: Expect a Big Drop (~75% Probability)
Since the market is heavily moving down, it is safer to prepare for the next drop instead of fighting the current trend.
When to Enter: Watch the 23,200 level closely. If the price breaks below this mark and stays there, it is a strong signal to enter a sell (short) trade.
Target (Where to take profit): 22,400 – 22,500 (Riding the drop all the way down to the big blue line).
Stop-Loss (When to cut your losses): If the daily price recovers and closes strongly above 23,200, exit your trade to protect your money.
When This Plan Fails: If strong buyers suddenly jump in and push the price to hold firmly above 23,200, the sellers are trapped. This completely cancels the crash plan, and the market will likely start going up instead.
Disclaimer: Technical analysis deals in probabilities. Always use a stop-loss to protect your capital.  Short
Short
Liquidity Sweep Before The Next Drop?Overall trend: Bearish on the 1H timeframe.
Price is forming lower highs and lower lows after the rejection from the 4,400 area.
A bearish BOS occurred as price broke below the previous swing lows.
The marked CHoCH shows a temporary shift in short-term order flow, but price failed to establish a sustained bullish structure.
Current price action around 4,297 looks like consolidation above the demand zone, potentially preparing for a liquidity grab and retracement.
🔑 KEY LEVELS:
Resistance / Entry area: 4,340–4,357
Invalidation / Supply: 4,370–4,375
Order Block: ~4,350–4,380
Demand Zone: ~4,250–4,265
Near-term liquidity: Below ~4,275 and above ~4,325
Major resistance: ~4,400–4,415
Major previous high: ~4,490–4,500
🎯 TRADE SETUP — SHORT:
Entry: 4,340–4,357 on bearish rejection/confirmation
Stop Loss: 4,375
TP1: 4,315
TP2: 4,290
TP3: 4,265
Risk/Reward: Approximately 1:2+ depending on entry
🚀 POSSIBLE NEXT MOVE:
Bearish scenario: Price retraces into 4,340–4,357, sweeps nearby buy-side liquidity, then rejects and continues toward 4,315 → 4,290 → 4,265.
Bullish scenario: If price breaks and holds above 4,357–4,375 with strong 1H momentum, the short thesis weakens. A reclaim could open the way toward 4,400+.
⚠️ INVALIDATION:
A decisive 1H close above 4,375, followed by sustained bullish momentum, invalidates the short setup. Short 
 Long
Long


