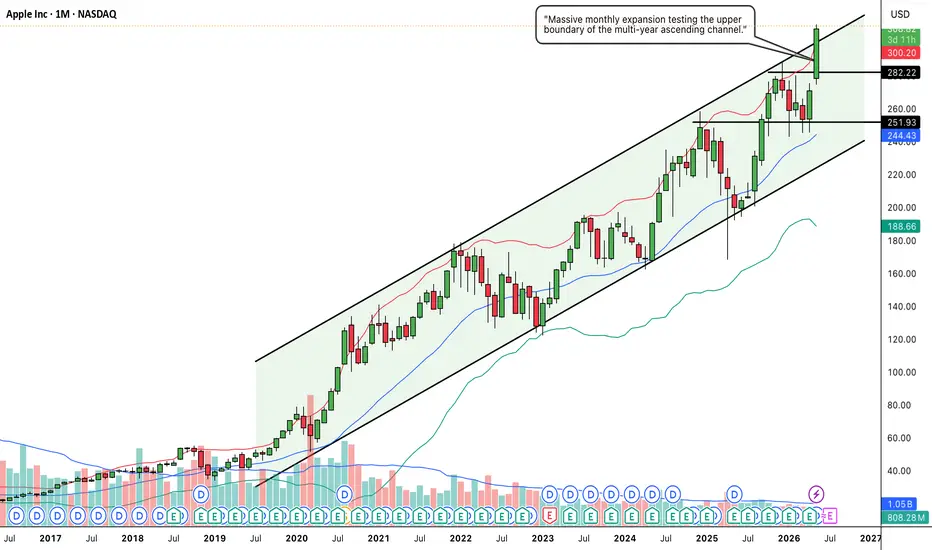
GOLD (XAUUSD) – DAILY CHART🔥 CHANNEL BREAKOUT + RETEST COMPLETE
Gold has broken out of the descending channel and the breakout/retest appears complete. Price is holding above the channel resistance, creating a chart-based setup for a potential upside move.
🎯 TRADE LEVELS:
🟢 Entry: Above $4,400
🛑 Stop Loss: $4,280
🎯 Target 1: $4,480
🎯 Target 2: $4,560
🎯 Target 3: $4,665
📌 Wait for daily candle confirmation above the breakout zone. Trail SL as price moves in your favor.
💬 Like • Comment • Follow for more setups!
DISCLAIMER :
This content is created by Logic Trade Room for educational and informational purposes only.
It is not financial advice, investment advice, trading advice, or a recommendation to buy or sell any security, index, futures contract, or options contract.
Trading and investing in the stock market involve substantial risk, including the risk of losing your entire invested capital. Past performance does not guarantee future results.
The entry, stop-loss, and target levels mentioned are illustrative chart-based levels and may change with market conditions. No trade setup or market prediction is guaranteed to be accurate.
Always conduct your own research, verify live market prices, and consult a qualified financial advisor before making investment decisions.
Trade with logic. Risk with discipline.
Logic Trade Room  Long
Long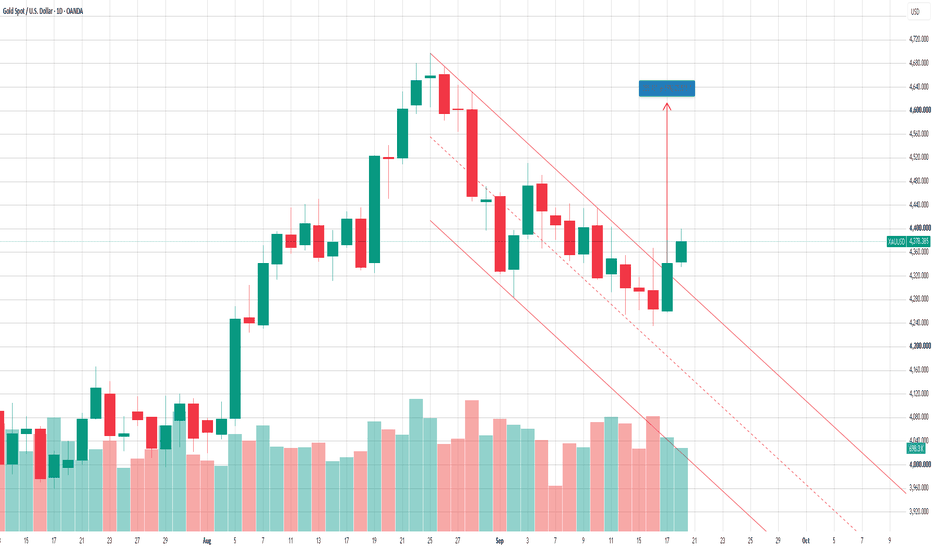
Dixon Technologies — Chart Analysis - Rising channel breakdownRising channel breakdown :
Price has broken below the lower boundary of the ascending channel, indicating a change from the previous bullish structure to short-term bearish momentum. The breakdown is accompanied by continued selling pressure.
Current price: ~₹13,005
🔴 Bearish Setup
Sell-on-rise zone: ₹13,400–₹13,700
Stop-loss: ₹14,100
Target 1: ₹12,500
Target 2: ₹11,800
Target 3: ₹11,500
The ₹13,400–₹13,700 area can act as a breakdown/retest zone. A rejection there would strengthen the bearish setup.
🟢 Bullish Scenario
Avoid assuming a reversal just because RSI is near 31. A stronger bullish case would require:
Price to reclaim ₹13,700–₹14,000 and sustain above the broken channel.
Then upside levels can be reassessed.
⚠️ Important
RSI is approaching oversold territory, so a short-term bounce is possible, but oversold alone is not a reversal signal.
Rising channel breakdown :
🔻 Channel Breakdown: Dixon has broken below its rising channel, indicating bearish momentum. Watch ₹13,400–₹13,700 for a possible retest/rejection. Below this zone, ₹12,500 → ₹11,800 → ₹11,500 are key downside levels. A sustained reclaim above ₹14,000 would weaken the bearish setup.
Disclaimer: This is my personal technical analysis for educational purposes, not financial advice. Do your own research, manage risk, and trade according to your plan.  Short
Short
BHARAT PETROLEUM (BPCL) – WEEKLY CHARTBullish Setup | Ascending Channel
BPCL is trading within an ascending channel, showing a potential bullish continuation setup. Price is near the channel support zone, with a possible move toward higher resistance levels.
🎯 TRADE LEVELS:
🟢 Entry: Above ₹315
🛑 Stop Loss: ₹298
🎯 Target 1: ₹330
🎯 Target 2: ₹350
🎯 Target 3: ₹370
📌 Wait for bullish candle confirmation. Trail SL as price moves in your favor.
DISCLAIMER :
This content is created by Logic Trade Room for educational and informational purposes only.
It is not financial advice, investment advice, trading advice, or a recommendation to buy or sell any security, index, futures contract, or options contract.
Trading and investing in the stock market involve substantial risk, including the risk of losing your entire invested capital. Past performance does not guarantee future results.
The entry, stop-loss, and target levels mentioned are illustrative chart-based levels and may change with market conditions. No trade setup or market prediction is guaranteed to be accurate.
Always conduct your own research, verify live market prices, and consult a qualified financial advisor before making investment decisions.
Trade with logic. Risk with discipline.
Logic Trade Room  Long
Long
S&P 500: Fed Speaks, Chart Hits 0.618The Fed just blinked hawkish — and the market moved almost exactly where the chart said it might.
On September 16, the US Fed raised rates by 25 bps — the first hike in three years. The move itself was already priced in (92% odds going in). What actually shook the market was two words from Fed Chair Kevin Warsh: he said policy needs to support a "timelier return" to the 2% inflation goal. Markets read that as "more hikes are coming, and soon" — and that's what sent the Dow down 630+ points and dragged the S&P 500 lower with it.
Here's where it gets interesting for chart readers: the S&P didn't just fall — it fell and stopped almost exactly at the 0.618 Fibonacci retracement (7,505.98) of the entire rally from the May low. 0.618 is called the "Golden Ratio" for a reason — it shows up everywhere in nature, and in markets it's the most-watched retracement level of all. So many traders have orders sitting near it that it often becomes a self-fulfilling floor or ceiling. That's exactly what played out here.
The wave count on the chart
Zooming out, here's the structure I'm tracking:
Wave (I) → (II) : The May–August move up (I) got corrected by an a-b-c "Running Flat." . Two tells confirm this: wave (b) made a slightly higher high than wave (I), and wave (c) barely dipped below wave (a)'s low before buyers stepped back in. A shallow, reluctant wave (c) is a classic sign the bigger trend is still up — running flats usually show up right before a strong wave 3.
Wave (1) → (2) : After (II) bottomed near 7,313.92, price rallied to 7,816.70 (wave 1), then pulled back — and that pullback is exactly the move the Fed news triggered, landing right on the 0.618 line at 7,505.98.
Why this level matters
7,313.92 (the wave II low) is the line in the sand. As long as price holds above it, this bullish count stays valid. A daily close below it would mean this labeling needs a rethink.
If the count holds
Using the wave (II)-low-to-wave (2)-low as the base of a trend channel, and projecting a simple 1x extension of wave (1) from the wave (2) low, the first target zone lines up around 8,010. Third waves often run further than 1x — so if this move has real strength, a stretch target near 8,300 (1.618x) isn't out of the question either. These are reference zones to watch, not predictions of exact outcomes — wave 3 needs to actually break above 7,816.70 with strong, clean structure before this becomes more than a scenario.
Bottom line
Macro (hawkish Fed) and technicals (Golden Ratio holding, running flat completing) lined up perfectly this week. The structure stays bullish above 7,313.92. Above 7,816.70 with strength would be the next confirmation to watch for.
Disclaimer:
I am not a SEBI registered research analyst. This post is shared only for education and learning purposes, based on my personal reading of the chart. It is not a buy or sell recommendation. Please do your own research or speak to a registered advisor before taking any trading decision.  Long
Long
Long 
KPRMILL: Weekly Descending Channel Breakout & Earnings Catalyst1. The Macro Perspective: The Descending Channel Formation
I am taking a LONG bias on K.P.R. Mill Limited (KPRMILL) on the macro weekly (1W) timeframe.
When analyzing pure market structure on a textile sector leader, extended markdown phases often form classical corrective patterns before the primary trend resumes. Following a peak, the stock entered a prolonged structural correction, carving out a well-defined Descending Channel visible on the chart. This multi-month digestion phase allowed institutional capital to systematically accumulate shares at lower valuations. Fundamentally, this technical momentum is supported by their recent Q4 FY26 earnings report, where consolidated net profit jumped 11 percent year-on-year to ₹227.17 crore. Furthermore, their sugar business division demonstrated strong performance with a 10% YoY revenue growth. Documenting these classical accumulation bases makes the charting workflow highly repeatable and easy to understand for anyone analyzing momentum shifts.
2. The Educational Setup: The Channel Boundaries
To understand the technical validity behind this macro launch, look closely at how the price structure interacted with its core boundaries:
The Upper Resistance Trendline: The definitive line in the sand for a bullish structural shift was the solid black descending resistance line connecting the lower highs. This level established a dynamic supply zone that systematically capped upward momentum over the past year.
The Lower Support Trendline: During the consolidation, buyers consistently stepped in at the lower bounds, forming a parallel descending support line. The price action oscillated cleanly between these two boundaries, gradually flushing out weak hands and building immense kinetic energy.
3. Current Price Action: Breakout and Volatility Expansion
Look at the most recent weekly candle on the far right of the chart. The structural pressure cooker has officially exploded. Institutional buyers have stepped in with undeniable conviction. The stock printed a strong green expansion candle that has decisively obliterated the upper channel resistance, currently trading strong near 1,103.20. The stock has officially transitioned out of its macro corrective phase and into a highly explosive markup trend.
Note: Always ensure your exchange's End of Day (EOD) data files have fully synchronized before confirming the final weekly close shape, as evening data shifts can occasionally alter the visual confirmation of these critical breakouts.
4. The Trade Plan: Entries, Targets, and Risk Management
Entry Strategy: Macro momentum is exceptionally strong with the stock trading out in the open above the pivotal breakout line. Chasing an extended weekly breakout candle carries a minor risk of a lower-timeframe mean-reversion pullback. The highest-probability entry strategy involves waiting for the initial vertical excitement to cool off. Look to scale into long positions on a potential structural pullback to perfectly retest the broken descending trendline prior resistance zone. Letting old historical resistance prove itself as a concrete new support floor provides an unmatched risk-to-reward ratio.
Take Profit (Targets): By utilizing a classical measured move strategy based on the width of the descending channel, we can project upside targets. Taking the approximate width of the channel (roughly 200-250 points) and projecting it upward from the breakout point, our primary structural macro target sits comfortably in the 1,300.00 to 1,350.00 zone over the coming months.
Invalidation (Stop Loss): An explosive macro breakout thesis is completely invalidated if the price fails to hold its newly claimed structural support and collapses back inside the core of the channel boundaries. A hard stop loss should be placed safely below the recent lower-timeframe swing lows, specifically around the 940.00 to 960.00 level. A definitive weekly close completely back below 940.00 would act as a severe warning sign of a failed macro breakout and a major bull trap.
5. Time Horizon:
Because this technical setup captures a clear structural phase transition and a major diagonal breakout on the 1-Week chart, this is a longer-term position trade designed to capture a rapid momentum markup phase over the coming weeks and months. Let the macro trend run!  Long
Long
TCS: The Flag That Volume Almost RuinedTCS has been moving sideways for weeks now. Slow charts like this often get ignored. But a slow chart can still be telling a story — you just have to read it patiently. Here is what I am seeing.
The Big Move First
Back in July, TCS made a sharp low near 1,977 and then rallied fast, almost in a straight line, up to about 2,495. That rally was clean and steady — no big overlaps, just strong steps up. I am marking this move as wave A (or wave 1, if you prefer the impulsive count).
The Pause After That
Since early August, the stock has been drifting down in a slow, tilted channel. Notice how the candles overlap each other here — that is very different from the sharp, clean climb before it. Overlapping price action like this usually means the market is resting, not reversing the bigger trend. This looks like a flag — a pause after a strong pole, not a breakdown.
What Volume Is Saying
Volume has been shrinking through this pause. That is a good sign — it tells us sellers are not pushing hard, they are just taking profit. But the latest session broke that pattern. It printed the biggest volume of the whole pause, and yet the candle opened high and closed near its low. That is not the kind of volume you want to see just yet. It looks more like a test that got rejected than a breakout. So for now, this is a caution flag, not a green light.
Invalidation Level:
Every idea needs a level where it breaks. For this setup, that level is around 2,088. This is the 0.786 retracement of the July-August rally. As long as TCS holds above this zone, the flag idea stays alive. A close below 2,088 would mean this is no longer a simple pause — it would call for a fresh look at the chart, not a hope-and-hold approach.
What I Am Watching Next
I want to see two things before trusting this setup: price holding above the 2,088 zone, and a strong up move that comes with rising volume, not shrinking volume. Only then does the flag idea get real support. Until that shows up, this remains a wait-and-watch chart, not a chase-it chart.
Disclaimer:
I am not a SEBI registered research analyst. This post is shared only for education and learning purposes, based on my personal reading of the chart. It is not a buy or sell recommendation. Please do your own research or speak to a registered advisor before taking any trading decision.  Long
Long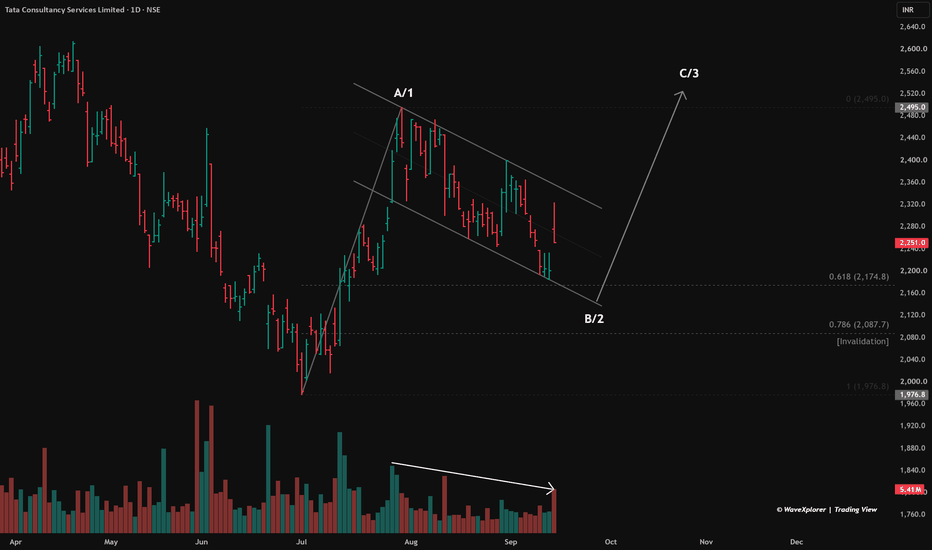
AAPL: Monthly Ascending Channel & Resistance Breakout1. The Macro Perspective: The Secular Ascending Channel
I am taking a LONG bias on Apple Inc. (AAPL) on the monthly (1M) timeframe.
When analyzing pure market structure on a mega-cap tech leader, long-term trend channels dictate the primary narrative. Look at the structural development on this chart. Since the pandemic crash in early 2020, AAPL has been flawlessly respecting a massive ascending parallel channel. This channel acts as a mechanical roadmap: the lower boundary consistently serves as a deep-value accumulation floor, while the upper boundary acts as a profit-taking zone. Following the most recent test of the channel's lower support line in early 2026, institutional buyers aggressively stepped in, launching the stock back toward the top half of the structure. Fundamentally, this fierce momentum aligns perfectly with Apple's recent blockbuster Q2 2026 earnings report, where the company delivered $111.2 billion in revenue and announced a massive new $100 billion share repurchase authorization.
www.investing.com
2. The Educational Setup: Clearing Horizontal Resistance
To understand the technical validity behind this recent thrust, look at how the price interacted with key horizontal levels within the channel:
The 251.93 Support Base: During the mid-channel chop, sellers tried to push the price lower but repeatedly failed at the 251.93 structural support. This established a critical, unbreakable higher low.
The 282.22 Resistance Ceiling: The main obstacle preventing AAPL from reaching the channel top was the solid black horizontal resistance line drawn at 282.22. This marked a major historical pivot where supply previously capped rallies. By chopping tightly beneath this line while the moving averages caught up, the stock built the necessary kinetic energy for a major breakout.
3. Current Price Action: Volatility Expansion and Channel Top
Look at the most recent monthly candle on the far right of the chart. The structural pressure cooker has exploded. Buyers have seized absolute control, printing a massive, full-bodied green expansion candle that has decisively shattered the 282.22 resistance ceiling. The stock has surged to fresh highs near the 311.40 mark, driven by major positive catalysts such as the upcoming CEO transition to John Ternus and Apple's continued dominance in the premium consumption market. Furthermore, this aggressive move has pushed the price directly into the upper boundary of the macro ascending channel.
www.perplexity.ai
4. The Trade Plan: Entries, Targets, and Risk Management
Entry Strategy: Momentum is incredibly strong, but the stock is currently running directly into the upper resistance line of the multi-year channel. Buying blindly at the absolute top of a channel carries a severe risk of a mean-reversion pullback. The highest-probability, lowest-risk entry strategy involves stepping down to the weekly timeframe and waiting for a structural cooling-off period. Look to scale into long positions on a healthy pullback that perfectly retests the broken 275.00 to 285.00 zone. Letting the 282.22 historical resistance prove itself as a concrete new support floor offers a phenomenal risk-to-reward ratio.
Take Profit (Targets): If AAPL can establish the 282.22 level as support, the primary objective is a continued grind along the upper channel boundary, projecting a structural macro target zone of 340.00 to 350.00 over the coming quarters.
Invalidation (Stop Loss): The bullish continuation thesis is severely damaged if the price fails to hold the mid-channel support and collapses back below the breakout zone. A hard stop loss should be placed safely below the 251.93 swing low, around the 240.00 to 245.00 level. A definitive monthly close completely below 240.00 would act as a major warning sign of structural failure and a break of the macro channel.
5. Time Horizon:
Because this technical setup is engineered on a 1-Month chart capturing a secular channel and a major horizontal breakout, this is a longer-term position trade designed to capture sustained macro markup over the coming months and quarters. Let the mega-cap trend run!  Long
Long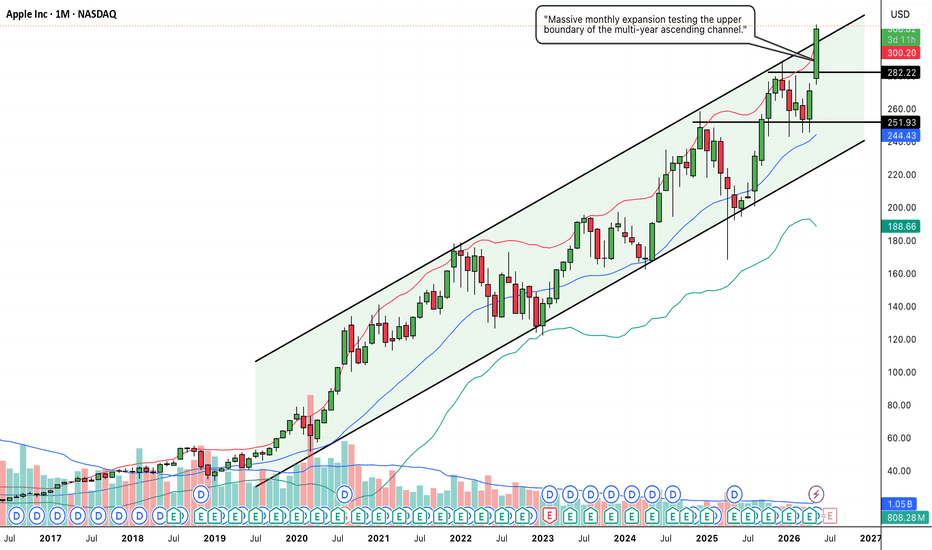
Long 
BTCUSDT: Sell Zone Holds, 75.5 Next TargetBTCUSDT is trading around 77,300 USDT, remaining firmly within a descending channel. Despite multiple attempts to rally, the price has failed to break the pattern of lower highs and continues to fluctuate below the EMA89 (near 77,830), indicating that buying pressure is insufficient to reverse the short-term trend.
The 77,500–78,000 range is the area I am watching most closely. It serves as a "Sell Zone" that aligns with both the EMA and the upper boundary of the descending channel. If BTC rallies to this zone but faces rejection, there is a high probability of a pullback to 76,500, followed by an extension toward the primary target near 75,500 USDT.
Early-week macroeconomic factors also lean toward a "risk-off" sentiment. Brent crude has risen nearly 3% due to supply concerns in the Middle East, while the market is pricing in an approximately 86% probability of a 25bp Fed rate hike this week. US Treasury yields remain elevated, exerting further pressure on crypto and other risk assets.
The bearish scenario would be invalidated if BTC breaks out of the channel and establishes firm support above the 78,300–78,500 level.
Will BTC retest the Sell Zone before sliding further toward 75.5K?  Short
Short
Long 
BTCUSDT: Hits Sell Zone, 76.5K Back to AimBTCUSDT is trading around 79,250 USDT, having just retraced into the 79,200–79,700 sell zone. This area is significant as it aligns with the upper boundary of a descending channel and a cluster of EMAs; meanwhile, the price structure from the 82,315 peak down to 80,604 continues to show a series of lower highs.
If BTC faces continued rejection below the 79,500–79,700 range, I lean towards a scenario where the price drops to 78,000 and subsequently extends down to 76,500–76,800 USDT. The fact that the price is testing resistance while within a descending channel suggests the current rebound is more of a retest than a trend reversal.
Macro factors also lend slight support to a correction scenario. Brent crude is approaching $100 per barrel, fueling inflation concerns and keeping the probability of a Fed rate hike high; additionally, Reuters notes that Bitcoin remains below 80K amidst cautious "risk-on" sentiment.
The bearish scenario would lose momentum if BTC breaks out of the channel and holds firmly above the 79,700–80,000 level.
Will the sell zone continue to cap BTC, or do the bulls have enough strength to reclaim the 80K mark? Short 
Apollo Hospitals: Consolidation and Strategic Entry LevelsOverview
Apollo Hospitals is moving inside a clean upward channel on the daily chart. The larger structural trend remains positive, well supported by the overall strength in the Nifty Pharma sector.
The Wave Structure
Wave (i) & (ii): Wave (i) topped at ₹7,870.5, and Wave (ii) found solid support at ₹7,080.0.
Wave (iii): Price hit a high of ₹9,050.0, perfectly matching the 1.618 Fibonacci extension zone.
Wave (iv): Currently consolidating to build energy for the next leg up.
How Wave (iv) Might Unfold
Scenario A (Triangle Pattern): Price holds above the local trendline and the ₹8,507.5 support level, coiling sideways before breaking out.
Scenario B (Channel Retest): Price tests lower toward the bottom blue line of the main upward channel before finding fresh buyers.
Entry Strategy & Confirmation
Entry Trigger: Buy only above ₹8,984.0 .
Volume Filter: Wait for good buying volume on the breakout candle to avoid false moves.
Upside Target: Wave (v) can push price toward the upper channel boundary around ₹9,400 – ₹9,600.
Clear Invalidation Levels
Pattern Weakness: A breach below ₹8,507.5 invalidates the immediate triangle setup and signals a deeper Wave (iv) retest.
Hard Setup Invalidation: Any drop below ₹7,870.5 (the Wave i high) completely invalidates this Elliott Wave count.
Disclaimer: This post is for educational purposes only and is not financial advice. I am not a SEBI-registered analyst. Please do your own research and manage your risk carefully.  Long
Long
BNB: TEXTBOOK DOWNWARD CHANNEL —BEARISH REJECTION AT CHANNEL TOPBNB is currently presenting an interesting risk-defined short setup.
The daily chart shows a well-defined descending parallel channel, with price repeatedly respecting the channel's upper and lower boundaries.
After a strong rally from the lower portion of the structure, BNB has now reached the upper boundary of the descending channel and the previous swing-high resistance zone around 720–725.
What makes the current setup particularly interesting is what happened on 28 August.
🔴 Bearish Rejection at Channel Resistance
On 28 August, BNB formed a large bearish engulfing candle directly at the upper boundary of the descending channel.
Price rallied into the resistance zone, attempted to move higher, and was subsequently overwhelmed by sellers, producing a strong bearish candle.
The candle therefore provides an initial confirmation that the channel-top resistance is being defended by sellers.
The key level now becomes the recent swing high around 725.
📉 The Short Thesis
The setup is based on three technical observations:
1. Descending parallel channel
The broader structure continues to show lower highs and lower lows.
2. Price reached the channel top
The recent rally brought BNB directly into the upper resistance boundary.
3. Bearish engulfing rejection
The 28 August candle produced a strong bearish reversal at this resistance.
Together, these factors create a potentially attractive short-side setup.
🎯 Trade Structure
The idea is to look for a short position following the bearish rejection.
Key resistance / invalidation zone:
720–725
The stop-loss should remain above the recent swing high around 725, with an appropriate execution buffer.
The trade is targeting approximately:
1 : 4 Risk-to-Reward
The 🛡️ Risk Management Is the Trade
The setup may look compelling, but the most important component remains risk management.
For example, if you decide that the maximum acceptable loss on the trade is $500, the position size should be calculated so that a stop-loss above the 725 swing high results in no more than that predefined loss.
Do not choose the position size first and then adjust the stop to accommodate it.
Instead:
Maximum risk → Stop distance → Position size → Target exact entry and position size should be calculated according to the actual entry price and the distance to the stop.
📌 Why This Setup Is Interesting
The attraction here isn't simply that BNB is "at resistance."
It is the confluence of:
Descending channel
↓
Rally into channel top
↓
Previous swing-high resistance around 720–725
↓
Large bearish engulfing candle on 28 August
↓
Clearly defined invalidation
↓
Potential 1:4 R:R
This provides a much more structured setup than simply shorting because price has reached a resistance line.
🧠 Final Thought
The rejection has already happened.
Now the question isn't:
"Will BNB reject the channel top?"
The question is:
"Will the bearish rejection follow through?"
That distinction is important.
A bearish engulfing candle provides a signal, but follow-through is what ultimately validates the trade.
If sellers maintain control and price continues lower, the setup can potentially deliver the planned 1:4 risk-to-reward.
If BNB reclaims the 720–725 zone and breaks the swing high, the bearish thesis is invalidated.
Trade the invalidation, not the emotion.
Risk first. Position size second. Reward third.
Educational purpose only. This is a technical study, not a recommendation to buy or sell BNB. Cryptocurrency markets are highly volatile, and technical patterns can fail.
 Short
Short
IDBI Bank Limited (1D NSE): Swing Trade AnalysisIDBI Bank is coming out of a prolonged multi-week consolidation box on the daily chart, supported by a long-term ascending trendline. A strong bullish candle is testing the overhead horizontal resistance zone near 91.00 – 92.00, indicating potential for a fresh swing expansion.
Key Technical Levels
Breakout Trigger: Above 91.00 (Needs a daily candle close above resistance to confirm breakout)
Immediate Support Base: 84.00 – 82.00 (Top of the lower trendline support channel)
Invalidation / Stop Loss: 78.80 (Strict daily closing basis)
Target Level,Price Target,Technical Significance,Expected Horizon
Target 1,103.20 ,Major swing high from previous impulse leg,Short-term (1–2 Weeks)
Target 2,112.90 ,Mid-range structural resistance zone,Medium-term (2–4 Weeks)
Target 3 (Major), 118.80,Previous major Double Top high & supply zone,Extended Swing
Trade Plan & Execution
Entry Strategy:
Option A (Breakout Entry): Enter on a daily candle close above 91.00 with strong volume.
Option B (Pullback Entry): Enter near 86.00 – 88.00 on any mild intraday dip toward the trendline.
Risk-to-Reward Ratio : ~1:2.5 (Risking ~10 points from 88.90 down to SL at 78.80 to capture ~25–30 points upside towards Target 1 & 2).
Trailing Stop Loss: Once Target 1 (103.20) is achieved, trail the stop loss to breakeven (91.00) to lock in risk-free exposure for Target 2 & 3.  Long
Long
GOLD: WAITING FOR A BREAKOUTGold remains trapped within the 4,450–4,310 trading range following a strong rally from the 3,940 area. Price is currently approaching a key resistance zone where the range high, overhead liquidity, and a major descending trendline converge, making the 4,430–4,450 area a critical decision zone for the current market structure.
From a technical perspective, the market has not yet confirmed a breakout. Recent upward moves appear to be absorbed around the 4,430–4,450 area, while the support below at 4,310 remains intact. This suggests that gold is currently in a state of balance between buyers and sellers and may require a new catalyst to trigger the next major move.
Bullish Scenario
If price breaks above and successfully holds above 4,450, especially after a successful retest of the breakout level, the current structure could transition into a continuation move, opening the door toward 4,500–4,600, with a more extended target around 4,800.
Bearish Scenario
If price continues to fail around 4,450 and then breaks back below the 4,310 support zone, this could signal a failed breakout and potentially trigger a deeper correction toward 4,250–4,200, with 4,100 as a more extended downside target.
From a macro perspective, gold is currently being influenced by two opposing forces. A weaker U.S. dollar and signs of softer U.S. economic conditions are providing support for gold. However, rising long-term U.S. Treasury yields, combined with inflationary pressure from higher oil prices, could create headwinds for a non-yielding asset such as gold.
Key catalysts to watch include the FOMC Minutes on August 19, PCE data on August 26, and the Jackson Hole Symposium from August 27–29.
TRADING PLAN
Resistance: 4,435–4,450 | 4,500 | 4,550 | 4,600
Support: 4,385–4,370 | 4,310–4,300 | 4,250 | 4,200 | 4,100
BUY: Only consider long positions after price breaks above 4,450 and successfully retests and holds above the level.
SELL: Prefer short positions if a failed breakout develops around 4,450, or if price breaks below 4,310 and fails to reclaim the level on a retest.
NEUTRAL: As long as price remains around the middle of the range, particularly between 4,390–4,400, avoid chasing the market.
Personal View
At the moment, I am not willing to place a large bullish bet simply because gold is consolidating below 4,450. At the same time, there is not yet enough confirmation to take an aggressive bearish position while 4,310 remains intact.
For a potential larger move of approximately 8–10%, I would prefer to remain patient and wait for either a failed breakout around 4,450 or a confirmed breakdown below 4,310. Either scenario would provide a much clearer invalidation level and a stronger risk-to-reward opportunity.
For intraday trading, continue to monitor the boundaries of the range and trade the price action accordingly. BSE Ltd. (1W) - Make or Break at Major Channel SupportOverview:
Looking at the Weekly (1W) timeframe for BSE Ltd. (NSE: BSE), the stock has been respecting a very well-defined, long-term ascending parallel channel. After a strong impulsive move to the upside that tested the upper boundary of this channel near the 4,400 - 4,500 levels, the stock has entered a corrective phase.
Technical Observations:
The Ascending Channel: The broader trend remains bullish as long as the price stays within this upward-sloping channel. Both the upper resistance line and the lower support line have been tested and respected multiple times historically.
Mid-line Breakdown: During the recent correction, the price cleanly broke below the dotted mid-line of the channel. This indicated a loss of bullish momentum and signaled a deeper pullback toward the lower boundary.
Current Price Action (Crucial Support): This is the most important part of the chart right now. The current weekly candle is resting exactly on the lower support trendline of the ascending channel (around the 3,250 - 3,300 zone).
Possible Scenarios:
Scenario A: The Bounce (Bullish Continuation)
If this lower trendline holds as strong support, we should look for bullish reversal candlestick patterns on the daily or weekly timeframe. A successful bounce here would validate the channel once again.
Initial Target: Reclaiming the dotted mid-line of the channel.
Long-term Target: A retest of previous highs and the upper channel resistance.
Scenario B: The Breakdown (Trend Reversal)
If we see a decisive weekly candle close below this lower trendline, it would invalidate the long-term bullish channel structure. This would be a major bearish signal.
Downside Targets: If support fails, the next logical horizontal support zones to watch would be around the psychological 3,000 mark, followed by the 2,500 - 2,750 consolidation zones seen earlier in the trend.
Conclusion:
BSE is currently at a high-reward, low-risk pivot point for swing and positional traders. It is currently at a "make or break" level. It is highly advised to wait for clear price action confirmation (either a strong bounce or a decisive breakdown) before taking a heavy position.
Disclaimer: This is for educational purposes only and does not constitute financial advice. Always use strict risk management and do your own research before entering a trade.
 Long
Long
OFSS (1D) - Approaching Crucial Resistance within an Ascending COverview:
Here is a technical breakdown for Oracle Financial Services Software Limited (OFSS) on the Daily (1D) timeframe. The stock has shown massive bullish momentum over the past few months but is now arriving at a critical decision point.
Key Technical Observations:
Established Ascending Channel: Since the major low earlier in the year, the price has been perfectly respecting a rising parallel channel (marked by the dotted trendlines). The stock has consistently found support at the lower boundary and faced resistance at the upper boundary, confirming a strong prevailing uptrend.
Major Horizontal Resistance: The price action is currently challenging a major horizontal resistance line marked as the "Previous High" near the 11,979 level.
Current Price Action: At the current price of roughly 11,739, OFSS is consolidating right near the confluence of the upper trendline of the channel and the horizontal resistance zone.
Potential Scenarios to Watch:
Bullish Breakout: A strong daily candle close above the "Previous High" (above 11,979) and the upper channel boundary, backed by high trading volume, would invalidate the channel resistance. This would be a highly bullish signal, suggesting a continuation of the rally into unchartered territory.
Rejection and Pullback: Because the price is at a double-resistance zone (trendline + horizontal high), there is a high probability of profit booking. If the price faces rejection here, we could see a healthy correction or pullback toward the midline or the lower boundary of the ascending channel before it finds fresh buying interest.
Conclusion:
This is a "make or break" zone for OFSS. Traders should watch price action closely around the 11,979 resistance level. It is advisable to wait for a confirmed breakout or a clear rejection signal before taking new positions.
Disclaimer: This idea is for educational purposes only and does not constitute financial advice. Always manage your risk and do your own research before taking a trade.
 Long
Long
 Long
Long
Sudeep Pharma | Stage 2 Trend Under Watch
Sudeep Pharma remains in a strong Stage 2 uptrend, trading within a rising channel after its IPO base breakout. Price is currently consolidating, allowing the 50 DMA to catch up, while continuing to trade above all key moving averages.
Another positive sign is that volume has been drying up during the consolidation, suggesting selling pressure is fading. The large bearish candle on 6 Jul 2026 failed to receive downside follow-through, indicating sellers have not gained control. Meanwhile, the Nifty Pharma Index is trading near all-time highs, providing a supportive sector backdrop.
Trade Scenarios
Bullish: A breakout above the current base with strong volume could signal continuation of the Stage 2 uptrend.
Support Bounce: A pullback towards the lower boundary of the rising channel followed by a bullish reversal may offer another low-risk entry.
Bearish: A decisive breakdown below the current base, followed by a break below the 50 DMA and the lower boundary of the rising channel, would invalidate the current bullish structure and increase the probability of a deeper correction.
Markets remain sensitive to geopolitics, crude oil, and macroeconomic developments. Wait for price and volume confirmation—don't anticipate the move.
Disclaimer:
This analysis is shared for educational purposes only and reflects my personal study of the charts. I am not a SEBI-registered investment advisor. Nothing in this post should be construed as investment advice or a recommendation to buy or sell any security.
Study the chart carefully, build your own conviction, and never trade blindly. Risk management and proper position sizing are imperative—capital preservation always comes first.  Long
Long