ETHUSD/ETHBTC afternoon updateVery intriguing bullish setup for ETHUSD and ETHBTC. ETHUSD holding support at .618 Fibonacci drawn from pivots at 4093.88 and 2100. There are different bullish counts that can be drawn from 879.80 low, will know more if price gets above 4093.88 and how price moves above that resistance.
ETHUSD move may be magnified by bullish ETHBTC setup, if low of 0.04474 can hold off .618 Fibonacci drawn from 0.08864 and 0.01614.
Immediate bullish targets on both charts would be the median lines of each pi
Pitchforks
Tesla's kangaroo still hopping. 20/May/24TSLA kangaroo still boxing/ hopping inside the ring (triangle) since end of 2021. Strong support if there was a pullback toward 186 +/-. Which is confluence zone of 1) POC of Volume Profile (red horizontal line) 2) 233 weekly EMA (white MA Line) 3) Pitchfork lower channel (blue).
📈Quick BBSUDT 2H Long Setup📉BINANCE:BBUSDT
BINANCE:BBUSD
📈Quick BBUDT 2H Long Setup📈
⚡️long position with mid-risk status.⚡️
TP 1-2-3-4 and SL are on the chart.
The Alternate scenario: If the price stabilize below the Bollinger midline, the setup will be cancelled
⚠️Don't forget to de-risk your positions.⚠️
BLong
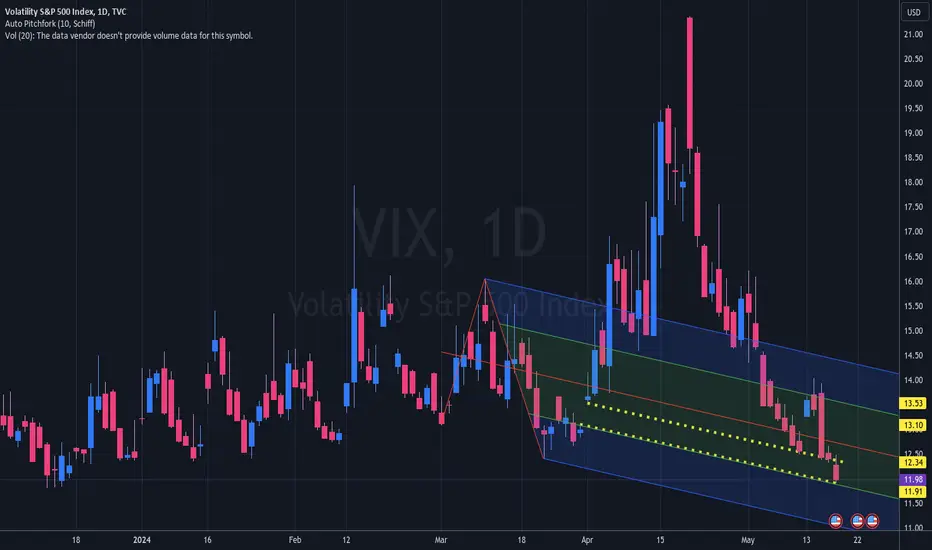
Schiff show: VIX gap filled.Volatility is near record lows. Low VIX is often associated with market tops. 0day options have been pushing VIX down further than normal though. Judging from the many solid candles on the monthly chart, the month often closes near tops and bottoms. So there should be plenty of time. The writing is on the wall. But it would not be surprising to see stock prices remain elevated, with correspondingly low VIX, until June 3 or later.
Caption: Using the auto pitchfork indicator and choosing Schiff p
📈Bitcoin on its way to $80K? / Serial analysis on BTC📉BINANCE:BTCUSDT
COINBASE:BTCUSD
Hello dear traders.
⚡️ In this post I will track the BTCUSDT movements from 11 Apr - 18 Apr.
📈 What to Expect Next?
💡The price of Bitcoin is in a vital situation. As long as the price is above the BB midline, the bullish scenario is quite valid.
The bullish scenario targets are on the price chart.
🔑Key Insights:
The level of $72,784 is the optimal level for risk-freeing long positions.
The risk of this position is lower in the upward direction due t
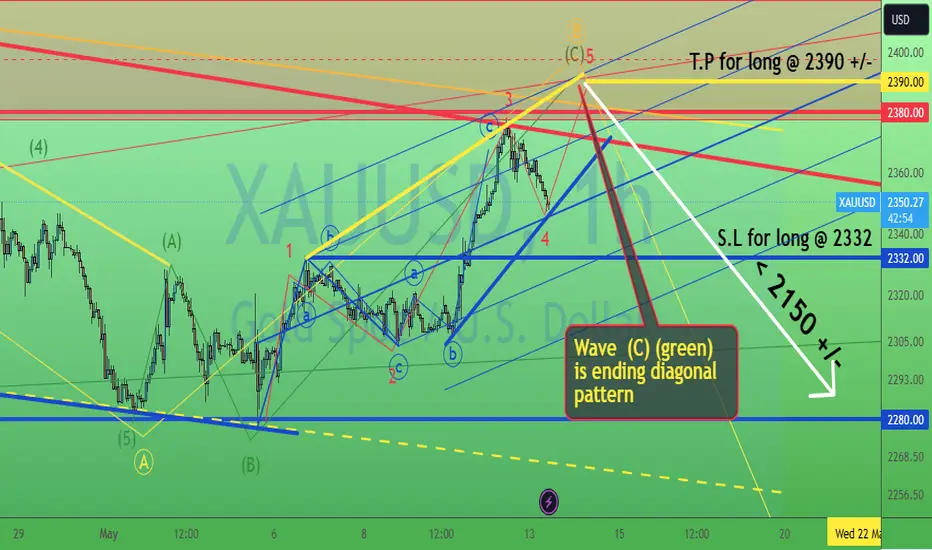
Gold's last path toward 2380 +/-. 13/May/24XAUUSD's last roadmap toward 2390 +/-. before 2150 +/-. Price currently at the last leg wave (C)(green) of expanding flat (A)(B)(C) pattern in wave B (Yellow Circled). Price/Market Structure Probably tell us somethings "Big" gonna happen on this 15/May/24 US CPI data...
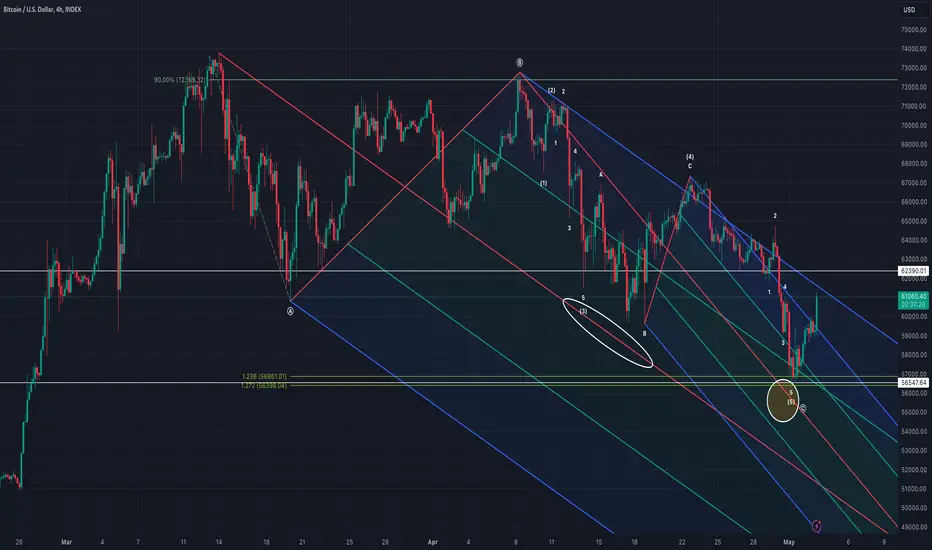
BTCUSD morning updateFirst of all, this is not the prettiest C wave, but if you have the BTCUSD bottom in, then I think this is how you have to do it. Price action did not touch the median line of either pitchfork, and if that remains true, price action should turn back up towards ATHs. I would like to see price get above 62390.01 to rule out a diagonal C wave to have more confidence in this count.
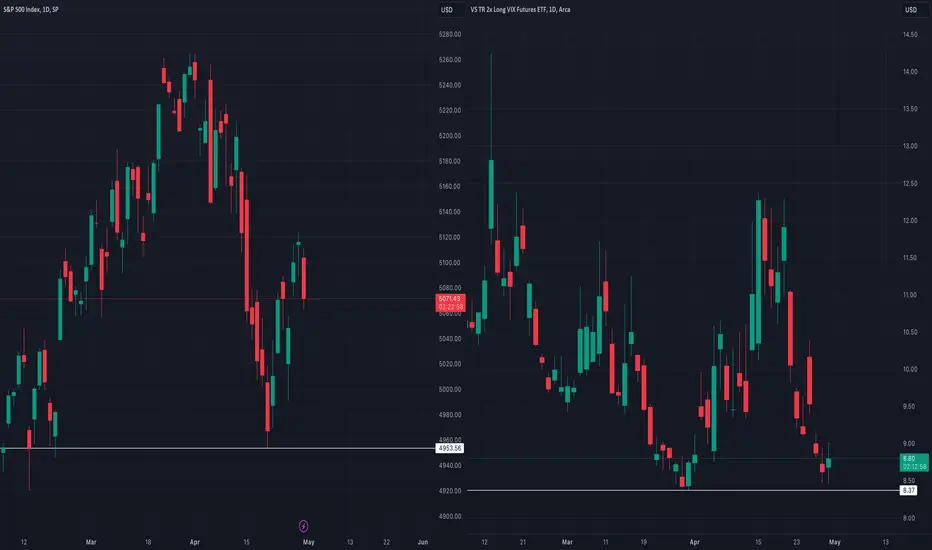
SPX vs VIXComparing SPX on the left with UVIX on the right. If UVIX double bottom can hold price above 8.37 and SPX can break below price of 4953.56, I find it highly probable that the top of equities is in. If UVIX at any point breaks below 8.37, then any breaks of SPX below 4953.56 would like be dip-buying opportunities. If UVIX breaks below 8.37, then it is also possible that SPX has already bottomed at 4953.56.
NDX morning update, big pictureI have altered my primary count to what I think is more accurate in terms of the largest wave structures. Area in orange ellipse was the "free money" wave (5) of iii, wave (4) that preceded it being a very rare (and incredibly bullish) running flat. For wave v, I have my bullish count in green and bearish count in red. There is a five-wave structure to complete wave v at 18464.70; 18464.70 is also ~1.618 extension of i projected on the origin of wave v, making this top highly technical. If this
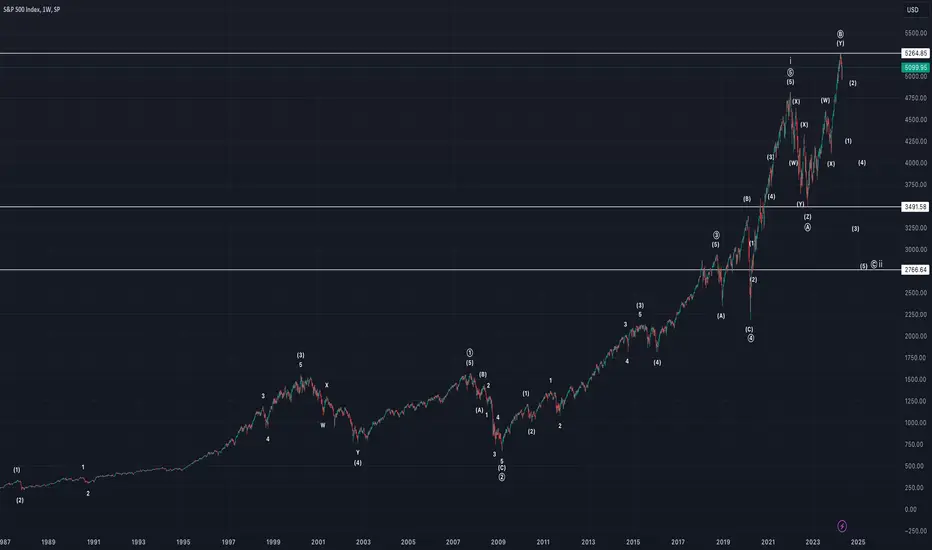
SPX, big pictureThis count has primary wave 1 peaking in October 2007, wave 2 a zigzag down to March 2009 low, wave 3 peaking in September 2018, wave 4 an expanded flat bottoming in March 2020 (COVID-19 low), and wave 5 peaking in January 2022. This would complete a full impulse from ATL to ATH.
After January 2022 (which would be wave 2 of largest degree), I have what looks like an expanded flat, which I project to bottom in the 2750-3250 area. The bottom of the C wave should at least pierce below October 2022