Long
Long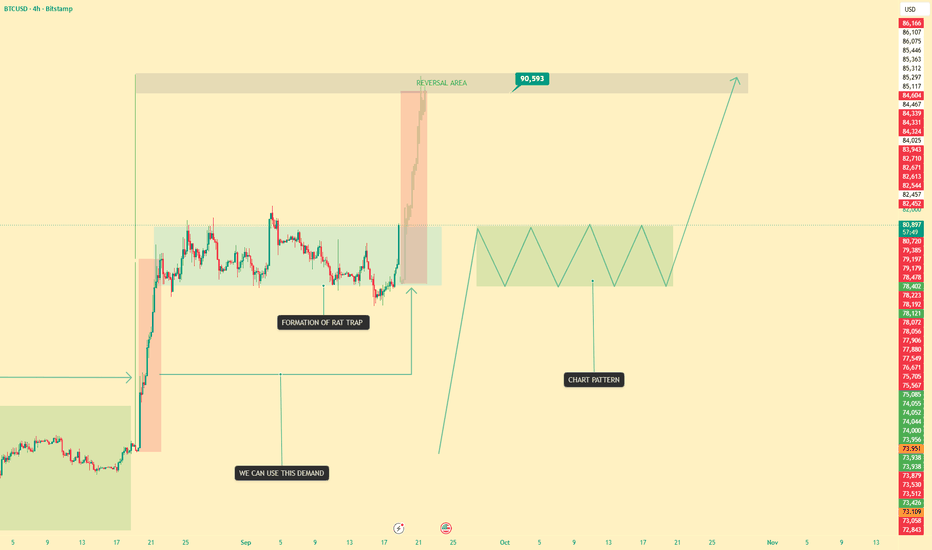
 Long
Long
APOLLO Micro Systems - Base Within a TrendWeekly View:
Zooming out, Apollo has been in a strong, well-defined uptrend since 2022, consistently trading above its long-term moving averages. The stock recently pushed into the upper boundary of a multi-year rising trendline (visible on the chart), and the last couple of weekly candles show the rally pausing right around that trendline resistance zone. This kind of pause near a long-term trendline, after such an extended move, often precedes either a healthy pullback/consolidation or a more prolonged distribution phase - the weekly candles will need to confirm which one plays out.
Daily View:
On the daily timeframe, this pause is showing up as a tighter, well-defined base — what looks like a classic Darvas Box. Price is consolidating above key DMAs, coiling around the 50 DMA, with candle ranges progressively tightening. Volumes have dried up meaningfully during this phase, generally a sign of supply exhaustion rather than distribution, and a pattern often seen in healthy basing structures.
Putting It Together:
The daily base is essentially forming right at the point where the weekly chart is testing long-term trendline resistance - which makes the resolution of this range more meaningful than a routine daily consolidation. A breakout above the box could indicate continuation into a fresh Stage 2 uptrend, potentially also clearing the weekly trendline resistance. A breakdown below the box would raise the risk of a shift toward Stage 4, with downside pressure on price, and could also mean the weekly trendline holds as resistance.
From a sector standpoint, defence stocks are showing broad relative strength, and the benchmark index is trading close to all-time highs, which is a supportive backdrop for quality names in this space.
Overall, this looks like a textbook case of a stock pausing at a decision point across both timeframes, where the eventual resolution of the box - up or down - will likely define the next leg. Sharing this purely as a technical structure worth studying.
Disclaimer: This post is for educational purposes only and reflects personal technical observations. I am not a SEBI-registered analyst/advisor, and nothing here constitutes investment advice or a recommendation to buy or sell. Please consult a SEBI-registered financial advisor before making any investment decisions.  Long
Long
Sudeep Pharma | Stage 2 Trend Under Watch
Sudeep Pharma remains in a strong Stage 2 uptrend, trading within a rising channel after its IPO base breakout. Price is currently consolidating, allowing the 50 DMA to catch up, while continuing to trade above all key moving averages.
Another positive sign is that volume has been drying up during the consolidation, suggesting selling pressure is fading. The large bearish candle on 6 Jul 2026 failed to receive downside follow-through, indicating sellers have not gained control. Meanwhile, the Nifty Pharma Index is trading near all-time highs, providing a supportive sector backdrop.
Trade Scenarios
Bullish: A breakout above the current base with strong volume could signal continuation of the Stage 2 uptrend.
Support Bounce: A pullback towards the lower boundary of the rising channel followed by a bullish reversal may offer another low-risk entry.
Bearish: A decisive breakdown below the current base, followed by a break below the 50 DMA and the lower boundary of the rising channel, would invalidate the current bullish structure and increase the probability of a deeper correction.
Markets remain sensitive to geopolitics, crude oil, and macroeconomic developments. Wait for price and volume confirmation—don't anticipate the move.
Disclaimer:
This analysis is shared for educational purposes only and reflects my personal study of the charts. I am not a SEBI-registered investment advisor. Nothing in this post should be construed as investment advice or a recommendation to buy or sell any security.
Study the chart carefully, build your own conviction, and never trade blindly. Risk management and proper position sizing are imperative—capital preservation always comes first.  Long
Long
 Long
Long
Phoenix Mills (PHOENIXLTD) – Stage 2 breakout and retest?Phoenix Mills (PHOENIXLTD)
Phoenix Mills belongs to the Real Estate / Realty sector (Retail-led commercial real estate, malls, offices, mixed-use developments). The realty sector has been showing improving relative strength, which adds a favorable sector tailwind.
Analysis
Stage 2 breakout appears to be underway after a prolonged consolidation.
The stock has broken out of a multi-month base and is now attempting a retest of the breakout zone, which is constructive if buyers continue to defend the breakout level.
Trading above all the key moving averages (50 DMA, 100 DMA and 200 DMA), confirming the primary uptrend remains intact.
Price structure continues to show higher highs and higher lows, a hallmark of a healthy Stage 2 trend.
The stock is slightly extended from the 50 DMA, so a pullback or period of consolidation would be completely normal. At current levels, the risk-to-reward may not be as attractive as it was during the base formation. Patience is often rewarded.
Fundamentals
The business continues to show strong operational momentum:
Sales (YoY):
FY25: ₹3,807 Cr
FY26: ₹4,423 Cr ▲
Profit After Tax (YoY):
FY25: ₹1,307 Cr
FY26: ₹1,557 Cr ▲
EPS (YoY):
FY25: ₹27.53
FY26: ₹34.22 ▲
Operating margins have also remained strong, with OPM improving to 60% in FY26.
The improving earnings profile supports the technical strength, but remember that price always leads fundamentals and markets can correct even when business performance remains excellent.
Points to Watch
Monitor whether the breakout level holds during the retest.
Watch for healthy volume on the next advance.
A sharp move away from the 50 DMA increases the probability of mean reversion.
Avoid chasing extended breakouts. Wait for your setup if the risk-to-reward isn't favorable.
Risk Management
Capital preservation comes first.
Always define your risk before entering a trade.
Never risk money you cannot afford to lose.
Even the strongest-looking setups fail. Position sizing and stop-loss discipline matter more than finding the "perfect" stock.
Disclaimer
This post is strictly for educational purposes to help traders learn technical analysis and market structure.
I am not a SEBI-registered research analyst or investment advisor. This is not a buy, sell, or investment recommendation. Please do your own due diligence before making any investment decisions.
One final thought: Don't blindly follow analysts, influencers, or social media posts—including this one. Learn to read charts, understand fundamentals, manage risk, and build your own process. Independent thinking and disciplined risk management are what help traders survive and improve over the long term.  Long
Long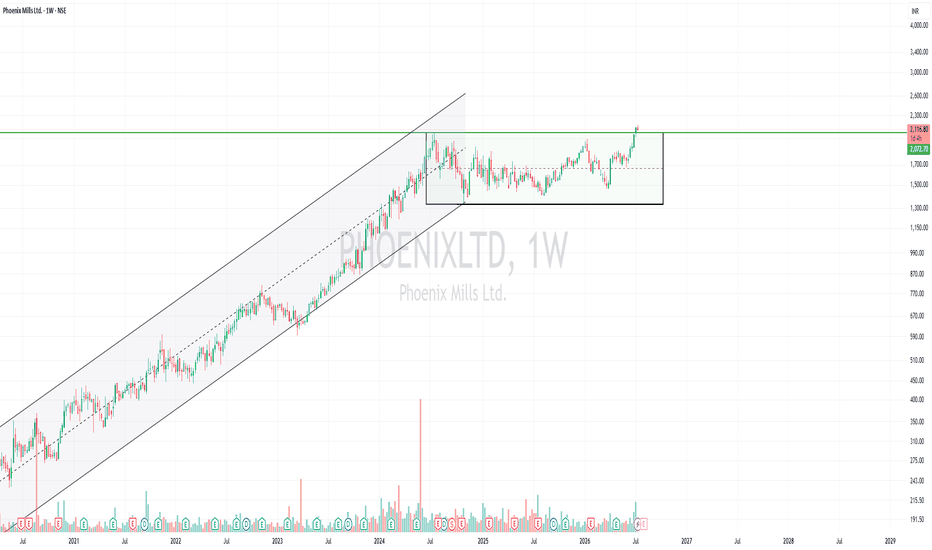
IOL Chemicals & Pharmaceuticals-Near a Multi-Year Breakout Zone
IOL Chemicals & Pharmaceuticals is trading near its highest level since 2020—effectively a nearly six-year high. The stock has moved above the ₹143–145 resistance zone and is now approaching the major historical resistance area around ₹180–182.
Technical observations
Price is trading above its key moving averages.
Weekly volume has started expanding during the recent advance.
Price action near the highs is relatively tight, indicating limited immediate selling pressure.
RSI is rising, reflecting improving momentum.
The broader Chemicals Index is near its all-time high and continues to maintain a higher-high, higher-low structure.
The Pharma sector is also holding up reasonably well.
A decisive weekly breakout and sustained close above the ₹180–182 zone could indicate a transition into a stronger Stage 2 advancing phase. Until that happens, the stock remains close to major historical resistance, so the breakout should not be anticipated blindly.
Key risks
The stock has moved sharply and is currently significantly extended from its 50-day moving average. This increases the possibility of a sudden pullback, volatility, or time-wise consolidation—even if the broader structure remains constructive.
Other risks include:
Ongoing geopolitical tensions and market-wide volatility
Sentiment-driven selling in small-cap stocks
Failed breakout or rejection near the historical resistance zone
Poor risk-to-reward for late entries after a steep vertical move
This post is intended only for studying price structure, volume behaviour, sector strength and stage analysis. It is not a trade recommendation and contains no suggested entry, target or stop-loss.
Do your own research, understand the business and assess the risks before taking any decision. I am not a SEBI-registered research analyst. Consult a qualified financial adviser where necessary.  Long
Long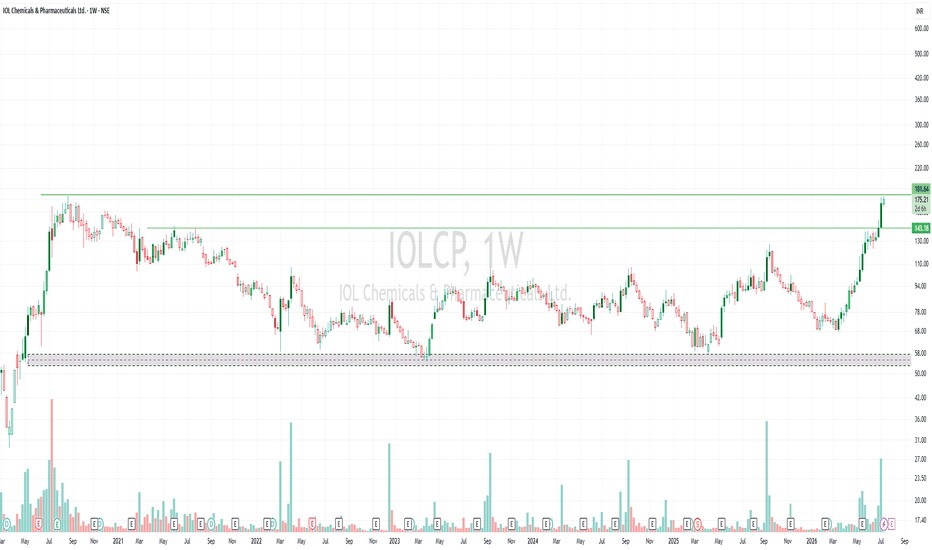
 Long
Long
 Long
Long
Adani Energy Solutions Ltd. – Daily Chart ReviewAdani Energy Solutions Ltd. – Daily Chart Review
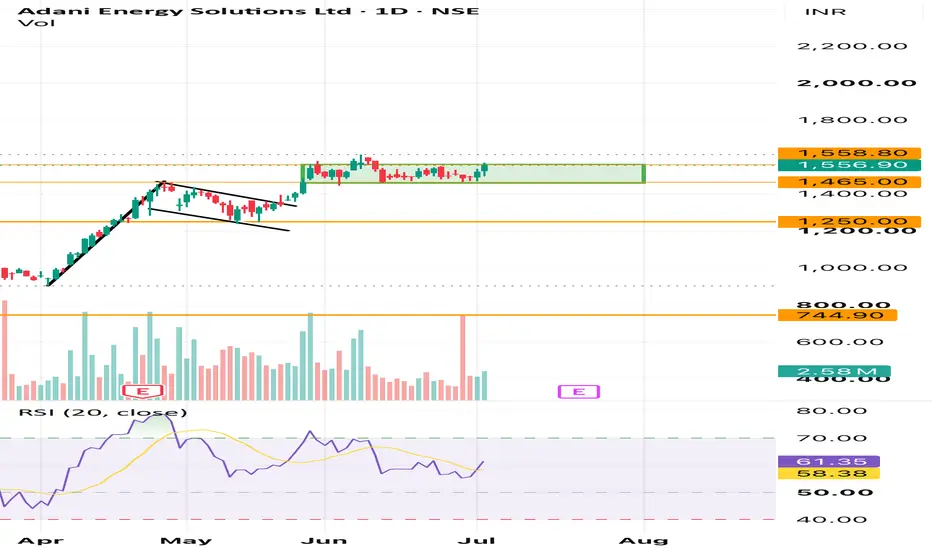
Adani Energy Solutions continues to trade in a strong primary uptrend, but the price has spent the last several weeks consolidating in a narrow range between ₹1,465 and ₹1,560. This appears to be a healthy pause after a sharp impulsive rally rather than a sign of trend reversal.
Technical Observations
* Rectangle Consolidation: Price is respecting a well-defined sideways range. Such consolidations often act as continuation patterns when they occur after a strong rally.
* Trend Structure: Higher highs and higher lows remain intact on the daily timeframe, indicating bulls are still in control.
* Volume: Volume has moderated during consolidation, which is constructive. A breakout accompanied by above-average volume would significantly improve the probability of trend continuation.
* RSI: RSI is around 61 and has turned upward after cooling off from earlier highs. This suggests bullish momentum is rebuilding. No major bearish divergence is visible at the moment.
Key Levels
* Immediate Resistance: ₹1,560–1,565
* Major Support: ₹1,465
* Positional Support: ₹1,250
Trading Plan
Bullish Scenario
* A decisive daily close above ₹1,560–1,565 with strong volume can trigger the next leg of the uptrend.
* Possible upside targets:
* ₹1,650
* ₹1,730
* ₹1,820 (if momentum remains strong)
Bearish Scenario
* Failure to hold ₹1,465 may result in profit booking towards ₹1,380–1,350 initially.
* The broader trend remains bullish unless the stock starts closing below ₹1,250.
Conclusion
The stock is showing characteristics of a bullish continuation setup. Consolidation after a sharp advance generally strengthens the trend by allowing momentum indicators to cool off. Traders should watch for a high-volume breakout above the range rather than anticipating it prematurely. Until the range is resolved, expect choppy price action.
Disclaimer: This analysis is for educational purposes only and reflects my personal interpretation of the chart. Please conduct your own research and manage risk appropriately before making any investment decisions.  Long
Long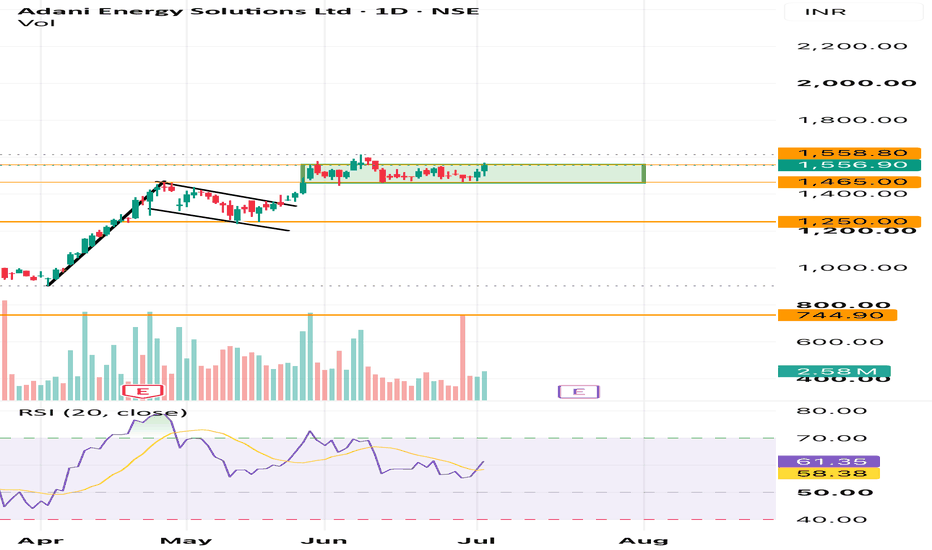
 Long
Long
BTC/USDT — Daily & 4H Continuation SetupBTC continues to maintain bullish market structure after reclaiming the mid-range consolidation zone and establishing acceptance above previous resistance. Higher lows continue to form across the 4H timeframe while the daily chart shows ongoing strength following the broader recovery from the 60k region.
Price is currently compressing beneath a major liquidity area near previous highs, suggesting the possibility of another expansion phase if current support continues holding.
📍 Entry Zone:
80,500 – 82,000
🛑 Stop Loss:
74,000 – 75,000
🎯 Targets:
• T1: 88,000 – 90,000
• T2: 94,000 – 96,000
📊 Potential Profit:
• T1: ~8–10%
• T2: ~15–18%
⚖️ Estimated Risk-to-Reward:
Approx. 1:1.5 to 1:3 depending on entries and position management.
The 4H structure continues to show sustained strength with buyers defending pullbacks instead of allowing deep retracements. At the same time, the daily timeframe is approaching a major higher timeframe liquidity zone near previous highs, making this an important region for potential expansion or reaction.
A clean hold above the 78k support region would continue favoring bullish continuation toward the upper supply zones. However, volatility around major psychological levels should still be expected.
Conservative traders may prefer waiting for consolidation or retests before entering after impulsive moves.
Independent opinion based on price action and market structure analysis.
NOT financial advice. Always manage risk properly. Long 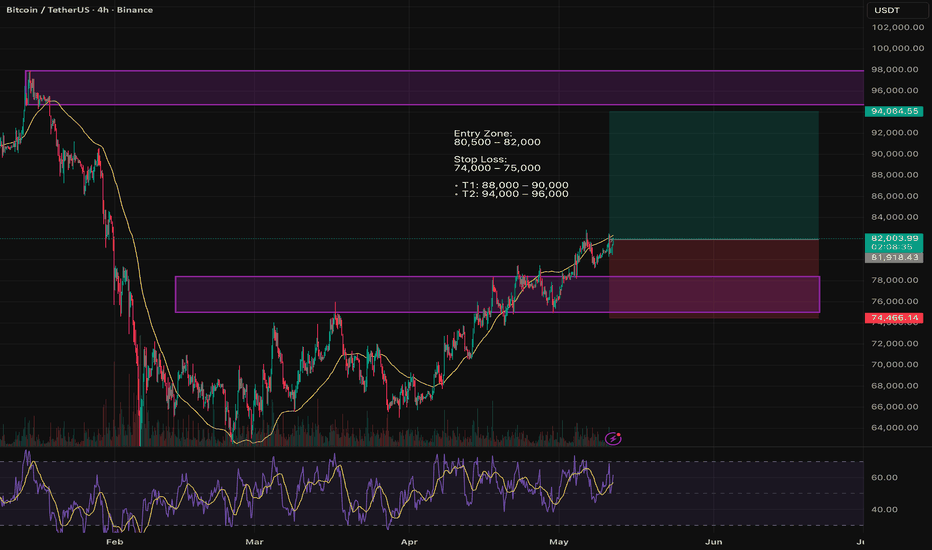
 Long
Long
 Long
Long
Bharti Airtel (Weekly Chart) – Technical ViewBharti Airtel (Weekly Chart) – Technical View
The weekly chart shows a descending trendline breakout attempt after several months of correction. Price has been consolidating inside the highlighted demand zone and is now testing the falling resistance line.
Key Observations
* Downtrend line is being challenged, indicating weakening bearish momentum.
* Multiple weekly candles have respected the ₹1,746–₹1,800 support zone, suggesting accumulation.
* Current close around ₹1,910.80 is near a crucial breakout area.
* RSI (20) at 50.9 has crossed above its moving average (45.8), signaling improving momentum.
* Volume has picked up during recent weeks, which is supportive of a breakout scenario.
Important Levels
Support
* ₹1,901 (immediate)
* ₹1,746 (major weekly support)
Resistance
* ₹1,947
* ₹1,976
* ₹2,057 (major breakout confirmation level)  Long
Long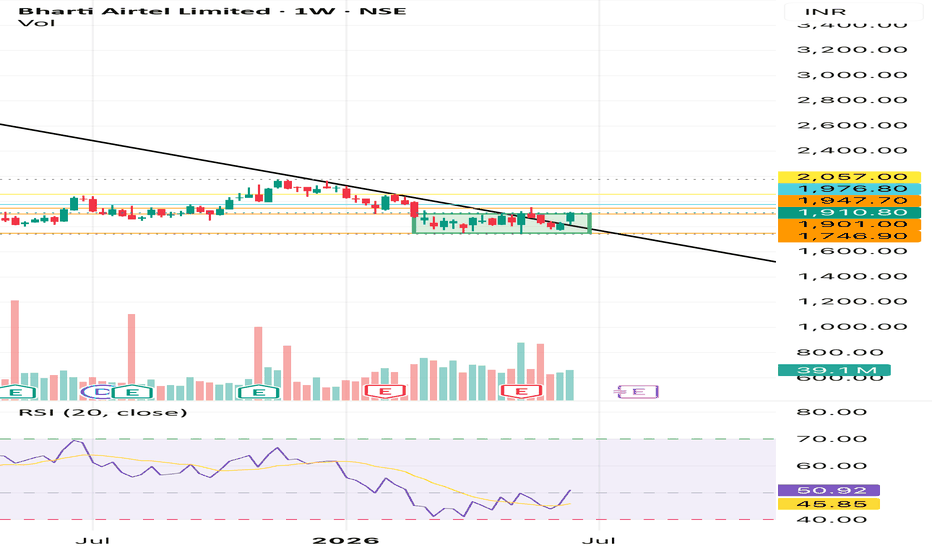
Fine Organic Industries Ltd. (Weekly Chart) symetrical traingleFine Organic Industries Ltd. (Weekly Chart) symetrical traingle breakout awaited.
Observation: Symmetrical Triangle / Ascending Compression Setup
Fine Organic is trading inside a long-term compression zone. Price has respected the rising trendline support and is now consolidating just below a major descending trendline resistance near ₹5,000–₹5,120.
The highlighted yellow box shows a tight consolidation after a sharp bounce from support, which often precedes an expansion move.
RSI (20):
* RSI is at 57.5, above its moving average (52.3).
* Momentum is improving and remains above the 50 zone.
* No significant bearish divergence is visible on the weekly timeframe.
Key Levels
Resistance Zones
* ₹5,000–₹5,120 (triangle breakout zone)
* ₹5,494
* ₹5,958
* ₹7,321 (major long-term target)
Support Zones
* ₹4,700
* ₹4,400
* Rising trendline support near ₹4,150–₹4,250
Trading View
✅ Sustained weekly close above ₹5,120 can confirm a triangle breakout and may trigger momentum towards ₹5,494 and ₹5,958.
✅ If volume expands during the breakout, the stock may eventually attempt the larger target zone around ₹7,321.
⚠️ Failure to break resistance and a close below ₹4,700 may lead to renewed consolidation within the pattern.  Long
Long

 Short
Short