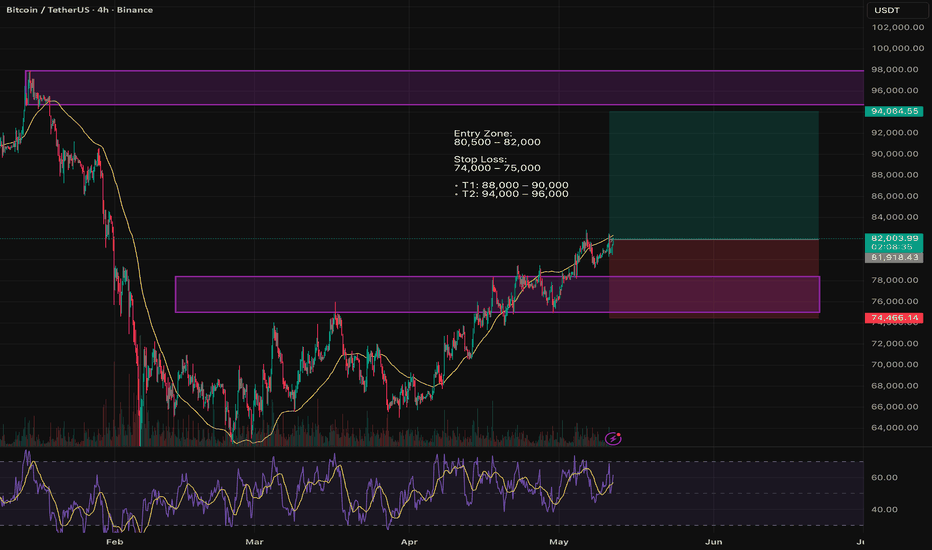
BTC/USDT โ Daily & 4H Continuation SetupBTC continues to maintain bullish market structure after reclaiming the mid-range consolidation zone and establishing acceptance above previous resistance. Higher lows continue to form across the 4H timeframe while the daily chart shows ongoing strength following the broader recovery from the 60k region.
Price is currently compressing beneath a major liquidity area near previous highs, suggesting the possibility of another expansion phase if current support continues holding.
๐ Entry Zone:
80,
Supply and Demand
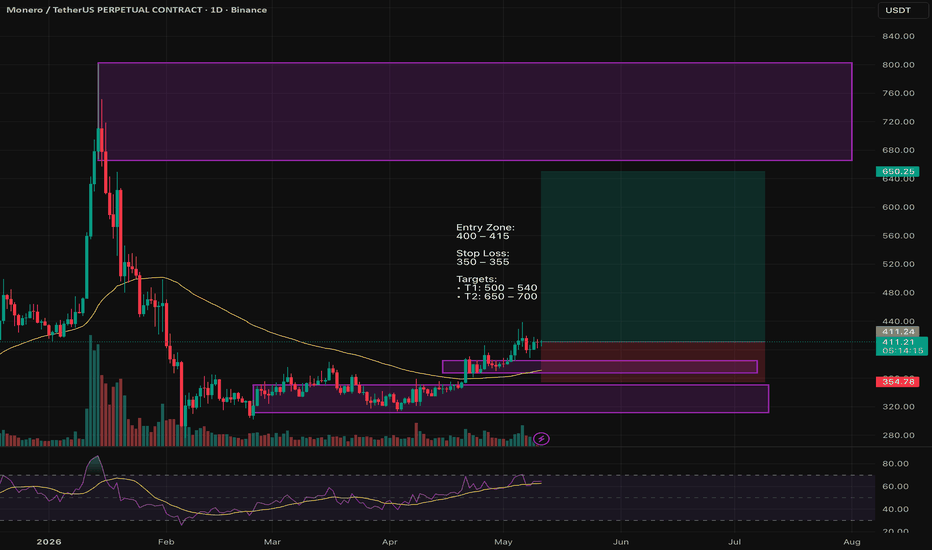
XMR/USDT โ Daily Swing Continuation SetupXMRUSDR continues to show strengthening higher timeframe structure after reclaiming a major consolidation range and establishing support above the key 360โ380 region. Following months of compression and accumulation, price is beginning to expand gradually while maintaining healthy momentum and trend continuation characteristics.
The current structure favors bullish continuation toward higher timeframe liquidity zones as long as the reclaimed support area remains protected.
๐ Entry Zone:
400 โ
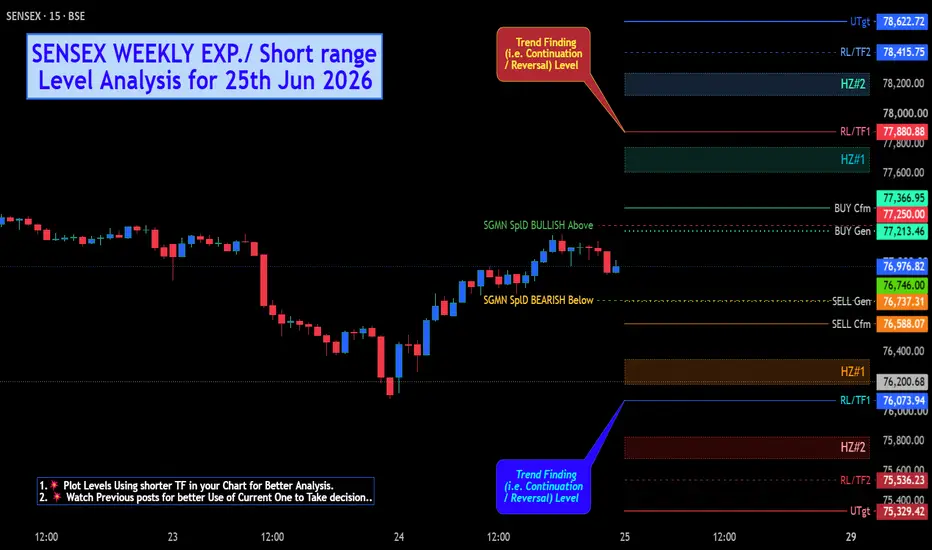
SENSEX WEEKLY EXP./Short range Level Analysis for 25th Jun 2026๐ SGMN SplD BULLISH Above => 77250.
๐ SGMN SplD Bearish BELOW => 76746.
Mentioned analysis based on 2 consecutive candle close in 15 min Time Frame.
โโโโโ๐ฅ๐ง๐จ๐ฉ๐ฆ๐ชโฌโโโโโ
๐ฅLevel Interpretation / description:
โ๐ปL#1: If the candle crossed & stays above the โBuy Genโ, it is treated / considered as Bullish bias. Cfm=> Confirmation.
L#2: Possibility / Probability of REVERSAL near ๐RL/TF1 & ๐RL/TF2
L#3: If the candle stays above โSell Genโ but below โBuy Genโ, it is treated / considered as S
Nifty Market outlook for tomorrow | 25 June 2026๐ฅ NIFTY at Make-or-Break Zone โ Breakout ya Fake Move?
๐ NIFTY50 โ 1H CHART ANALYSIS
โโโโโโโโโโโโโโโ
๐ CMP: 24,013
๐ด Resistance: 24,150 โ 24,200
๐ข Support: 23,780 โ 23,820
โโโโโโโโโโโโโโโ
๐ Bull Case:
Break & hold above 24,200
โ Momentum continuation
โ Targets: 24,400 โ 24,600 ๐
โโโโโโโโโโโโโโโ
๐ป Bear Case:
Break below 23,780
โ Support failure
โ Targets: 23,600 โ 23,400 ๐
โโโโโโโโโโโโโโโ
โก Key Level: 24,200
โโโโโโโโโโโโโโโ
Smart Money View:
Price stuck between liquidity zones
Repeated rejectio
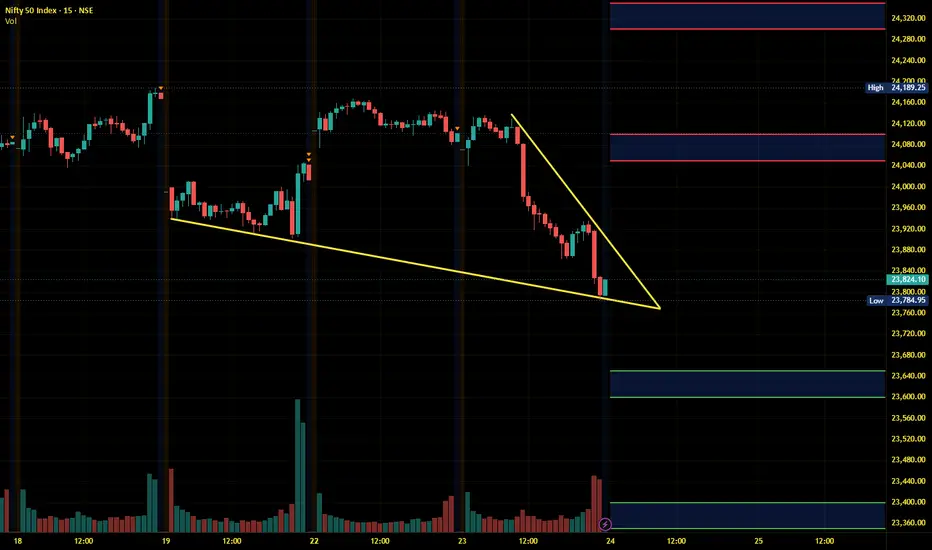
Nifty Intraday Analysis for 24th June 2026NSE:NIFTY
Index is near resistance, however, volatility is expected due to expiry of F&O contract on BSE on 25th June.
The upward movement may lead to 24050 โ 24100 resistance range and if the index crosses and sustains above this level then may reach near 24300 โ 24350 range.
On the contrary, a downward moment may drag the Index to 23650 โ 23600 support range in downward momentum and if this support is broken then index may tank near 23400 โ 23350 range.
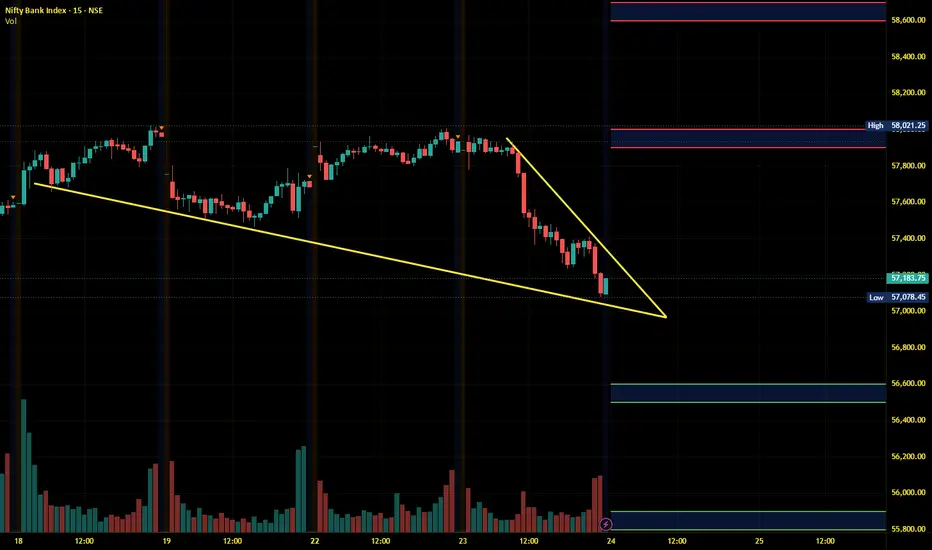
Banknifty Intraday Analysis for 24th June 2026NSE:BANKNIFTY
Index is near support, however, volatility is expected due to expiry of F&O contract on BSE on 25th June.
The upward moment may lead the Index to 57900 โ 58000 resistance range in upward momentum and if the index crosses and sustains above this level then may reach near 58600 โ 58700 range.
On the contrary, a downward moment may drag the Index to 56600 โ 56500 support range in downward momentum and if this support is broken then the index may tank near the 55900 โ 55800 range.
Finnifty Intraday Analysis for 24th June 2026NSE:CNXFINANCE
Index is near support, however, volatility is expected due to expiry of F&O contract on BSE on 25th June.
The upward movement may lead the Index to 26600 - 26650 resistance range and if the index crosses and sustains above this level then may reach near 26900 - 26950 range.
On the contrary, a downward moment may drag the to 26050 โ 26000 support range and if this support too is broken then index may tank near 25750 โ 25700 range.
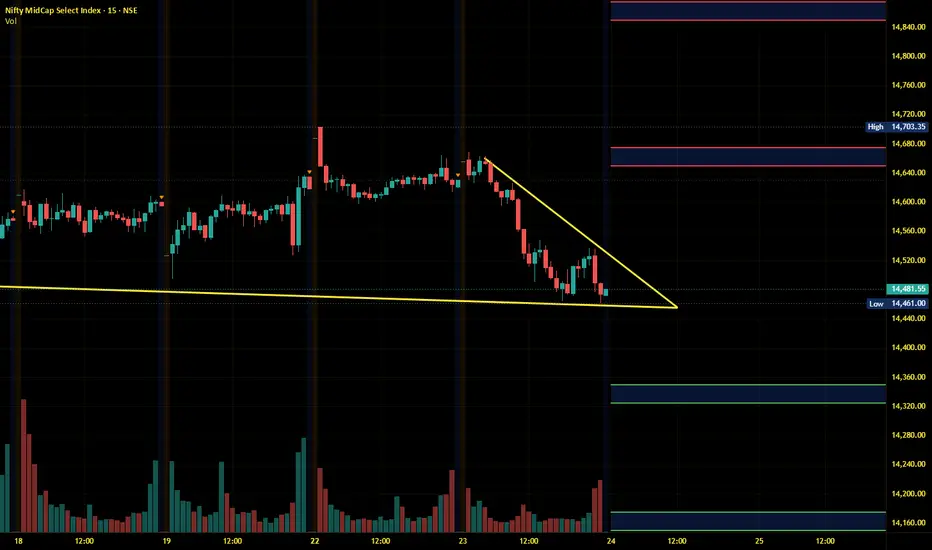
Midnifty Intraday Analysis for 24th June 2026NSE:NIFTY_MID_SELECT
Index is near support, however, volatility is expected due to expiry of F&O contract on BSE on 25th June.
The upward movement may lead the Index near 14650 โ 14675 resistance range and if the index crosses and sustains above this level then may reach 14850 โ 14875 range.
On the contrary, a downward moment may drag the index to 14350 โ 14325 support range and if this support is broken then index may tank near 14175 โ 14150 range.
NIFTY DAILY / Short range Level Analysis for 25th Jun 2026๐ SGMN SplD BULLISH Above => 24098.
๐ SGMN SplD Bearish BELOW => 23949.
Mentioned analysis based on 2 consecutive candle close in 15 min Time Frame.
โโโโโ๐ฅ๐ง๐จ๐ฉ๐ฆ๐ชโฌโโโโโ
๐ฅLevel Interpretation / description:
โ๐ปL#1: If the candle crossed & stays above the โBuy Genโ, it is treated / considered as Bullish bias. Cfm=> Confirmation.
L#2: Possibility / Probability of REVERSAL near ๐RL/TF1 & ๐RL/TF2
L#3: If the candle stays above โSell Genโ but below โBuy Genโ, it is treated / considered as Sid
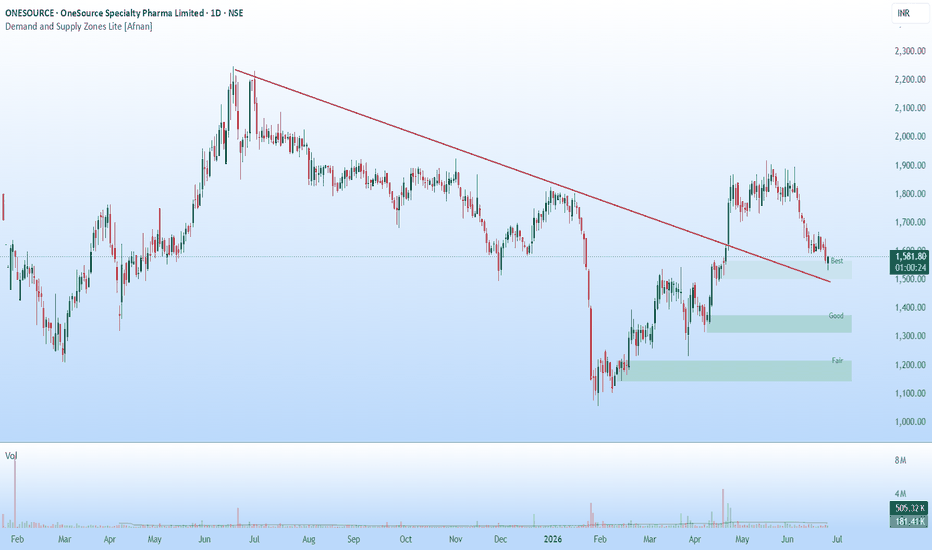
Smart Money Reloading? ONESOURCE Tests a Powerful Demand ZoneONESOURCE has reached a technically important area where multiple factors are coming together. After a rally earlier this year, the stock has undergone a healthy correction and is now revisiting a high-quality demand zone that previously triggered a powerful upward move.
The current structure is particularly interesting because this is not just any support area. This is the same zone from which buyers completely changed the character of the chart, transforming it from a prolonged sideways phas
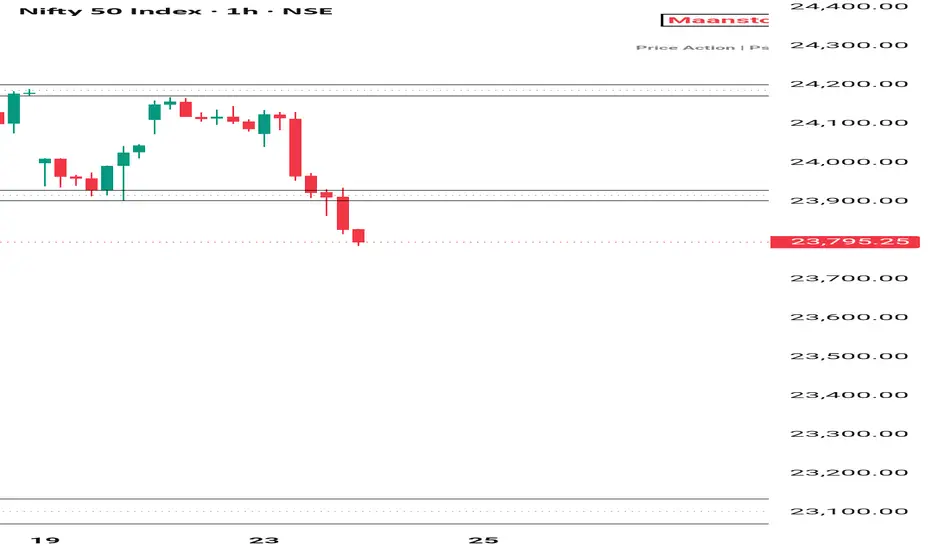
Nifty Market outlook for 24 June 2026๐ NIFTY50 โ 1H CHART ANALYSIS
CMP: 23,795
Resistance: 24,150 โ 24,200
Support: 23,900 โ 23,950
Clear breakdown below key support
No buying strength visible right now
Price rejected perfectly from resistance
Then strong selling came after support break
Bull Case:
Only if price reclaims 23,950
Then bounce possible towards 24,100+
Bear Case:
Below 23,900 โ downside continuation
Next major support: 23,100 โ 23,150
Key Level: 23,900 (Decision zone)
Smart Money View:
Clean liquidity grab above
And the weakness continues!! As we can see NIFTY feel sharply exactly as analysed in our previous post that we will see a negative market as long as we are below the trendline support. We might see further continuation of this downfall if manages to close itself below the trendline support in smaller time frame market in dotted lines as there is space till 23600. Else we may see a sideways to positive market if manages to close itself above the trendline so plan your trades accordingly and keep watching everyone.
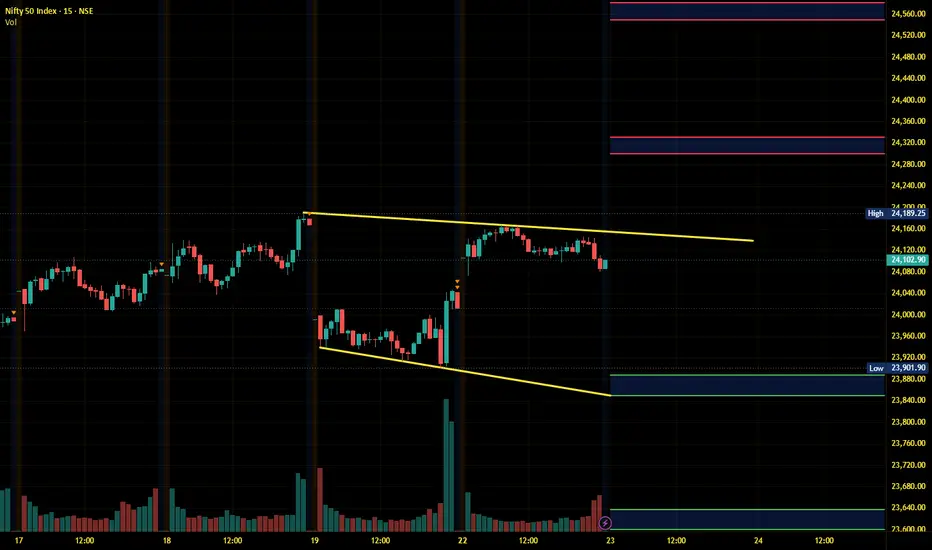
Nifty Intraday Analysis for 23rd June 2026NSE:NIFTY
Uptrend is expected to continue, however, Highest OI is buildup which will act as major resistance on weekly Option expiry day and if the resistance is broken then -
The upward movement may lead to 24300 โ 24350 resistance range and if the index crosses and sustains above this level then may reach near 24550 โ 24600 range.
On the contrary, a downward moment may drag the Index to 23900 โ 23850 support range in downward momentum and if this support is broken then index may tank
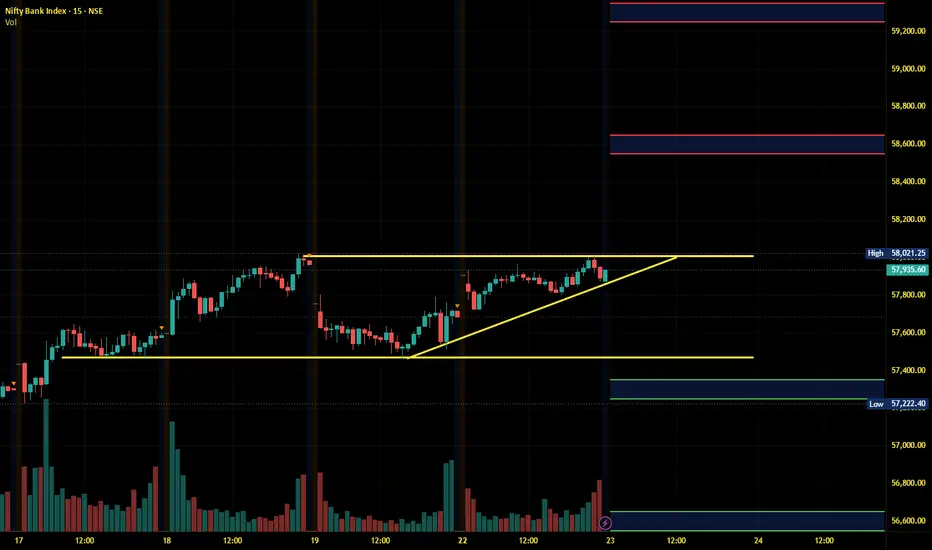
Banknifty Intraday Analysis for 23rd June 2026NSE:BANKNIFTY
Uptrend is expected to continue, however, volatility is expected due to expiry of F&O contract on BSE on 25th June.
The upward moment may lead the Index to 58550 โ 58650 resistance range in upward momentum and if the index crosses and sustains above this level then may reach near 59250 โ 59350 range.
On the contrary, a downward moment may drag the Index to 57350 โ 57250 support range in downward momentum and if this support is broken then the index may tank near the 56650 โ 56
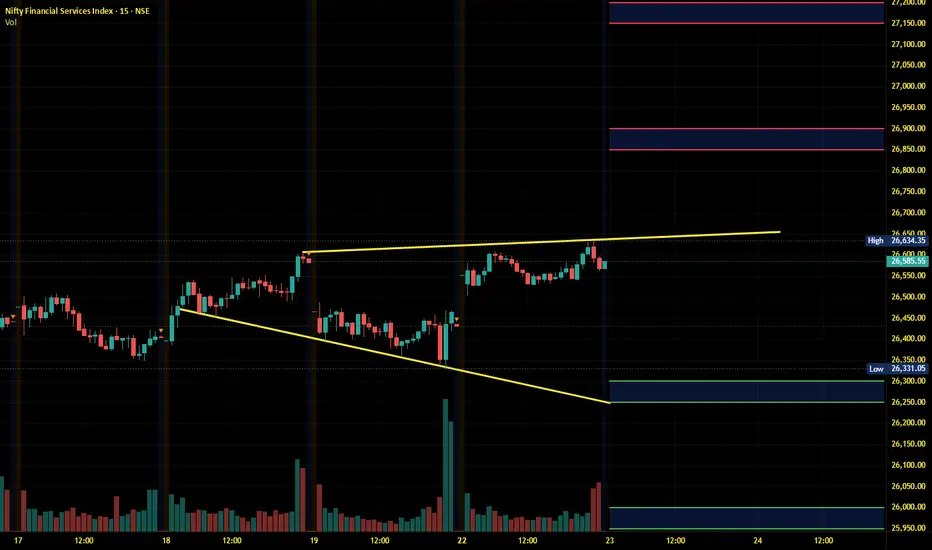
Finnifty Intraday Analysis for 23rd June 2026NSE:CNXFINANCE
Uptrend is expected to continue, however, volatility is expected due to expiry of F&O contract on BSE on 25th June.
The upward movement may lead the Index to 26850 - 26900 resistance range and if the index crosses and sustains above this level then may reach near 27150 - 27200 range.
On the contrary, a downward moment may drag the to 26300 โ 26250 support range and if this support too is broken then index may tank near 26000 โ 25950 range.
Midnifty Intraday Analysis for 23rd June 2026NSE:NIFTY_MID_SELECT
Uptrend is expected to continue, however, volatility is expected due to expiry of F&O contract on BSE on 25th June.
The upward movement may lead the Index near 14800 โ 14825 resistance range and if the index crosses and sustains above this level then may reach 15000 โ 15025 range.
On the contrary, a downward moment may drag the index to 14475 โ 14450 support range and if this support is broken then index may tank near 14275 โ 14250 range.
BULLISH view on Hindustan UnileverHigher high and higher low formations are key concepts in technical analysis used to identify and confirm an uptrend in the price of an asset, such as a stock or a currency pair. These formations are typically seen in price charts and can be indicators of bullish market sentiment.
When lower lows and lower highs are breaking, it typically indicates a potential reversal or shift in the prevailing downtrend. Let's break down what this means:
Lower Low (LL): A lower low occurs when the price of
NIFTY DAILY / Short range Level Analysis for 24th Jun 2026.๐ SGMN SplD BULLISH Above => 24900.
๐ SGMN SplD Bearish BELOW => 24753.
Mentioned analysis based on 2 consecutive candle close in 15 min Time Frame.
โโโโโ๐ฅ๐ง๐จ๐ฉ๐ฆ๐ชโฌโโโโโ
๐ฅLevel Interpretation / description:
โ๐ปL#1: If the candle crossed & stays above the โBuy Genโ, it is treated / considered as Bullish bias. Cfm=> Confirmation.
L#2: Possibility / Probability of REVERSAL near ๐RL/TF1 & ๐RL/TF2
L#3: If the candle stays above โSell Genโ but below โBuy Genโ, it is treated / considered as S
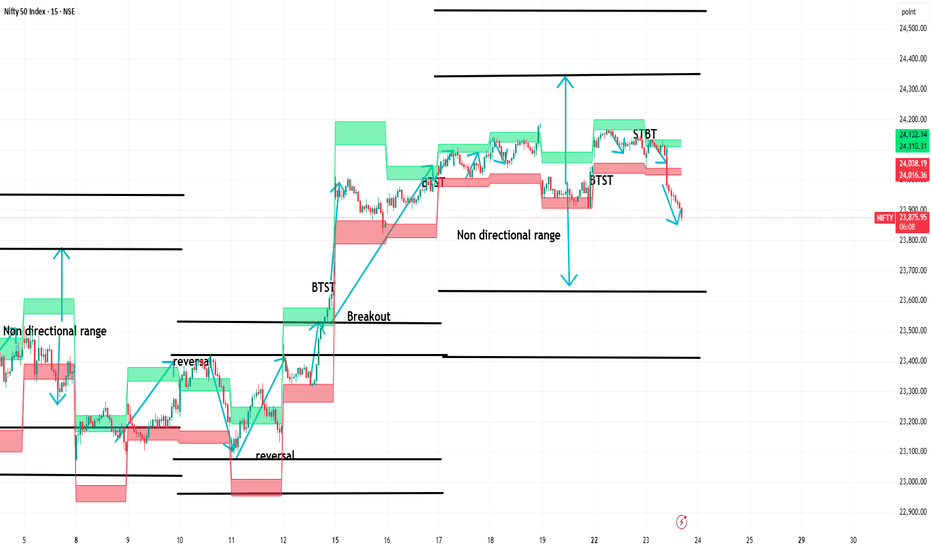
HOW-TO: Large Capital Used Multi-Strategy Baskets in algotradingThis tutorial explains how high-capital traders use multi-strategy baskets combining Intraday S/R levels, Weekly Expiry Range, and BTST/STBT momentum signals. Learn to execute multiple strategies simultaneously with defined risk.
Markets: Nifty, BankNifty
Timeframe: 15-minute
Part 1: The Three-Tool Setup
From the chart:
Tool 1: Intraday S/R Indicator โ Identifies entry/exit zones for each strategy
Tool 2: Weekly Expiry Range โ Defines weekly boundaries for options selling
Tool 3: BTST/STBT S
NIFTY: Trendline Breakout Meets Demand Zone โ Bigger Move Ahead?๐ The Bigger Picture Favors the Buyers ๐
At first glance, NIFTY may appear to be moving sideways, but a closer look reveals an interesting story developing beneath the surface.
The most important area on this chart is the Weekly Demand Zone . This higher timeframe demand area has already demonstrated its strength by attracting buyers and preventing further downside. Recently, price revisited this zone and immediately found support, suggesting that institutional demand may still be active.
H
BANKNIFTY DAILY Short Range Level Analysis: 23rd Jun 2026๐ SGMN SplD BULLISH Above => 58121.
๐ SGMN SplD Bearish BELOW => 57759.
Mentioned analysis based on 2 consecutive candle close in 15 min Time Frame.
โโโโโ๐ฅ๐ง๐จ๐ฉ๐ฆ๐ชโฌโโโโโ
๐ฅLevel Interpretation / description:
โ๐ปL#1: If the candle crossed & stays above the โBuy Genโ, it is treated / considered as Bullish bias. Cfm=> Confirmation.
L#2: Possibility / Probability of REVERSAL near ๐RL/TF1 & ๐RL/TF2
L#3: If the candle stays above โSell Genโ but below โBuy Genโ, it is treated / considered as S
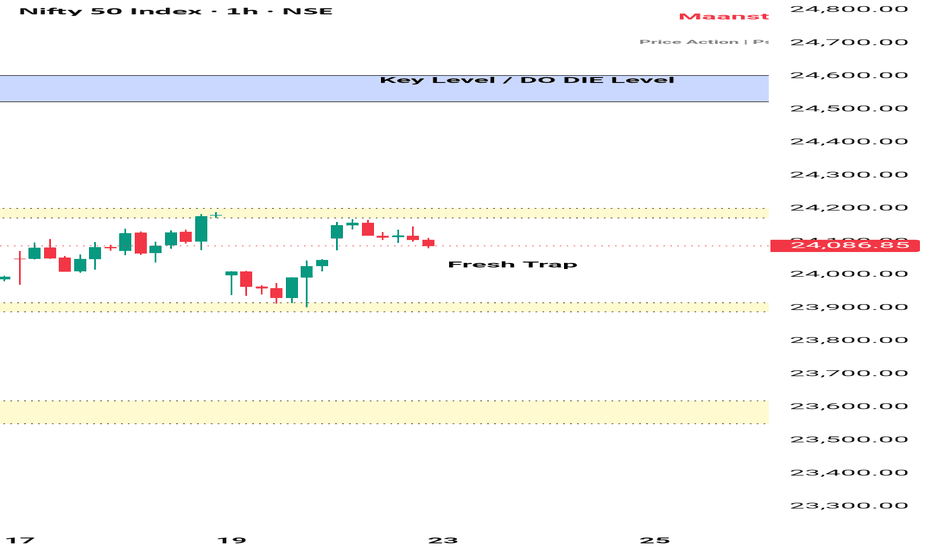
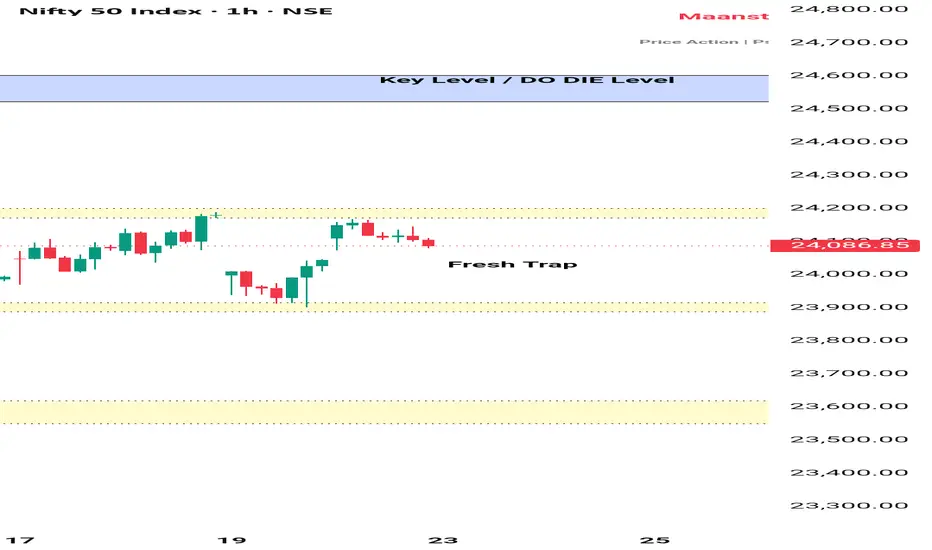
Nifty50 View for Tomorrow | Weekly Expiry | 23 June 2026๐ NIFTY50 โ 1H VIEW
Market still inside range
No clear breakout yet
CMP: 24,086
Resistance: 24,150 โ 24,200
Support: 23,900 โ 23,950
Above 24,200 โ strength builds
Path opens towards 24,350 โ 24,500
Rejection from resistance โ downside
Levels below 23,900 possible
Smart Money View:
Range + traps = delayed move
Final Thought:
Real move will start above 24,200 or below 23,900
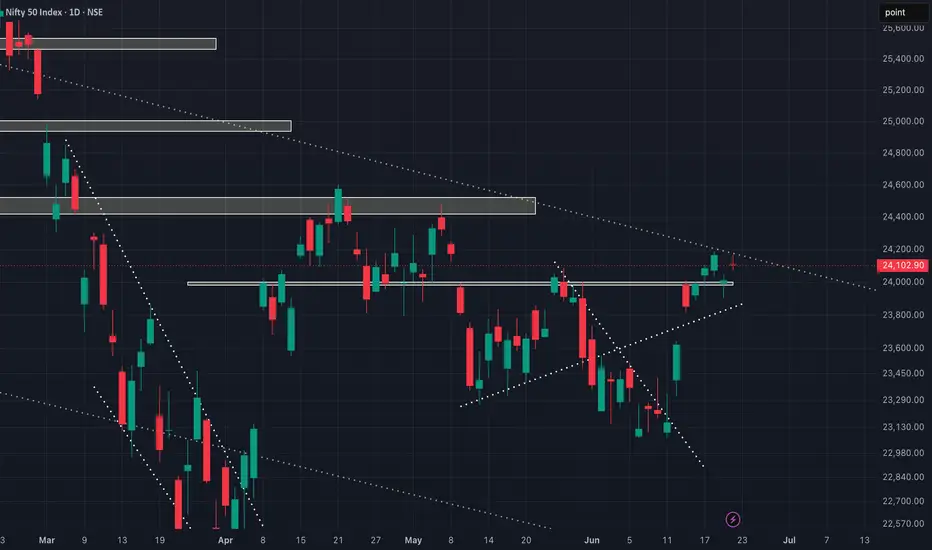
NIFTY will only turn bullish above 24200!As we can see NIFTY again got rejected around the trendline resistance. Now that the trendline has been tested multiple times, making it weaker. Hence any break above the given level can show strong upside but if maintains between the trendline and the demand zone of 24000, NIFTY could remain volatile. So, plan your trades accordingly and keep watching everyone.