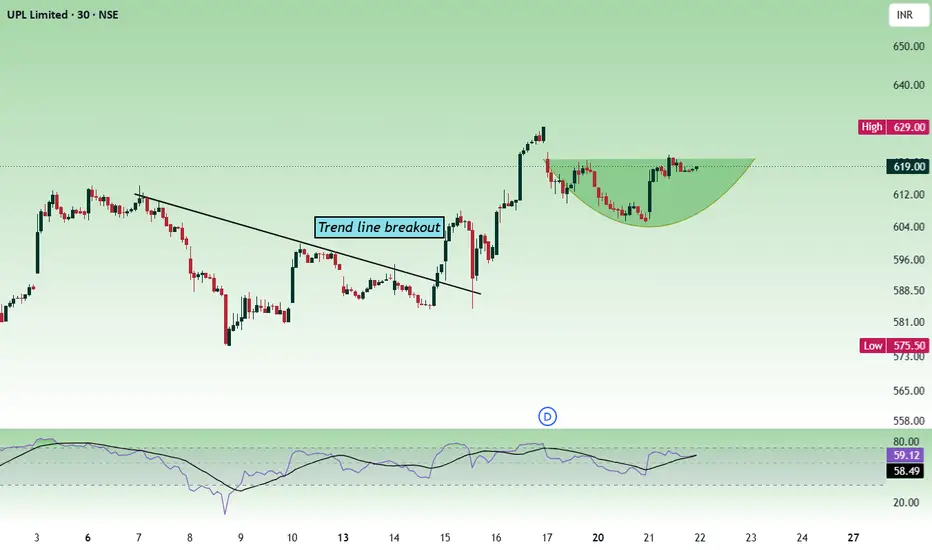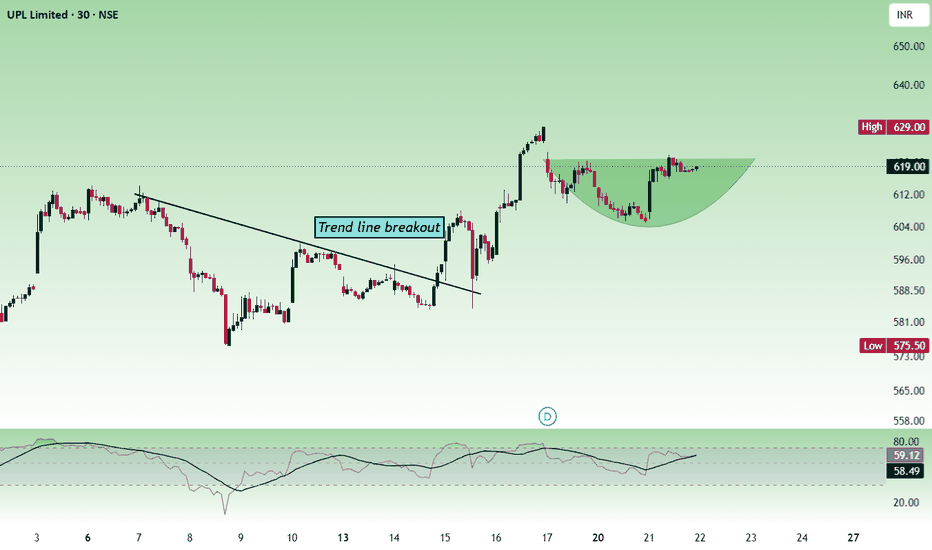
UPL - Multitime frame analysisAs per the daily time frame, the price has given a trendline breakout and sustained above the trendline. In the lower time frame, the price has formed a rounding bottom pattern, which is bullish.
Buy above 620 with a stop loss of 614 for the targets 626, 632, 636, 642 and 648.
The price will become bearish if it falls below the 600 zone and shows bearish strength; it can move towards the next support. In other words, the price is bullish as long as it sustains above the 600 zone.
Always do your analysis before taking any trade.
Support and Resistance
XAUUSD GOLD ANALYSIS ON (21 JUL 2026)#XAUUSD UPDATEDE
SELL LIMITED - 4078-4088
If price stay below 4110, then next target 4040,4010 and 3970 and above that 4150
Plan;If price break 4078-4088 area,and stay below 4080,we will place sell order in gold with target of 4040,4010 and 3970 & stop loss should be placed at 4110
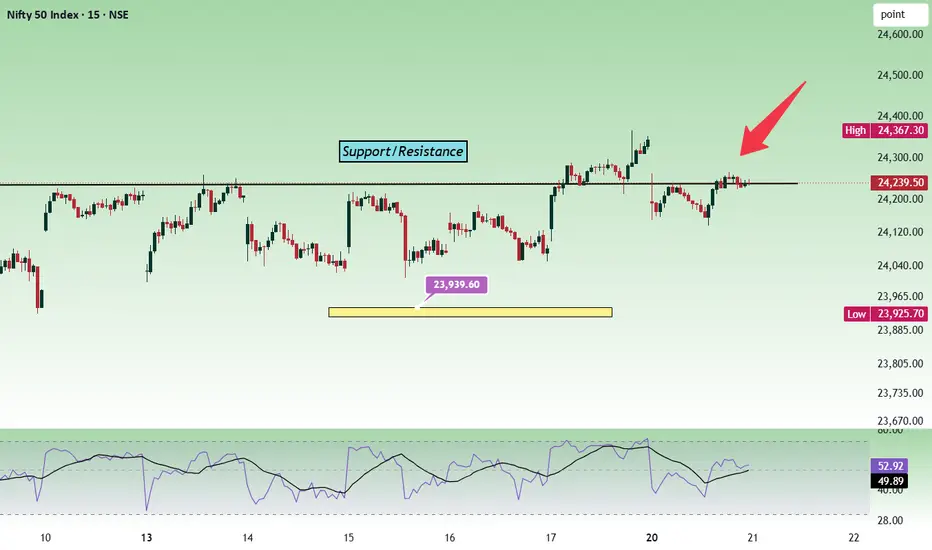
Nifty - Expiry day analysis July 21.The price did not give a trending movement today and moved within a range. As per the daily chart, an inside bar has formed today. Sustaining 24200 - 24240 is important to move up further.
Buy above 24260 with the stop loss of 24200 for the targets 24300, 24340, 24400, 24460 and 24500.
Sell below 24120 with the stop loss of 24180 for the targets 24080, 24020, 23980, 23940 and 23880.
The expected expiry day range is 23900 to 24400.
Always do your analysis before taking any trade.
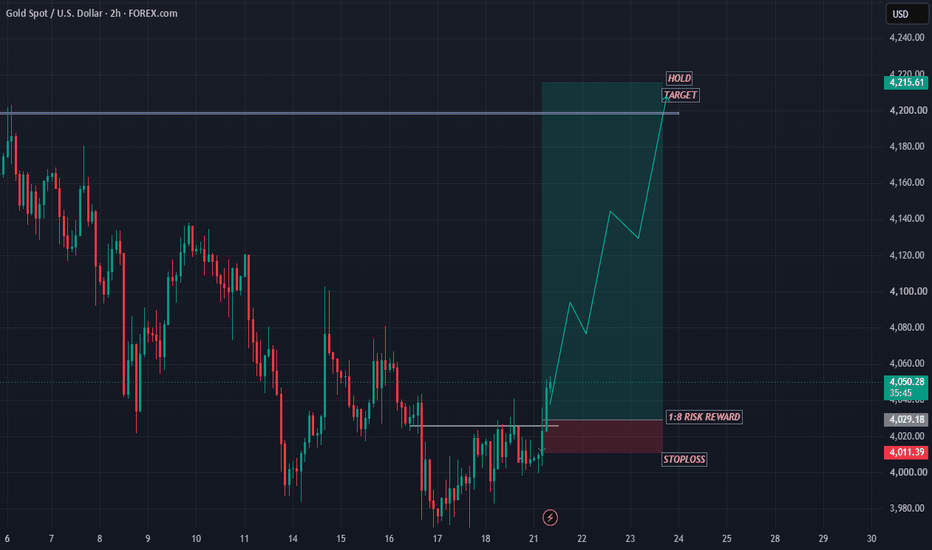
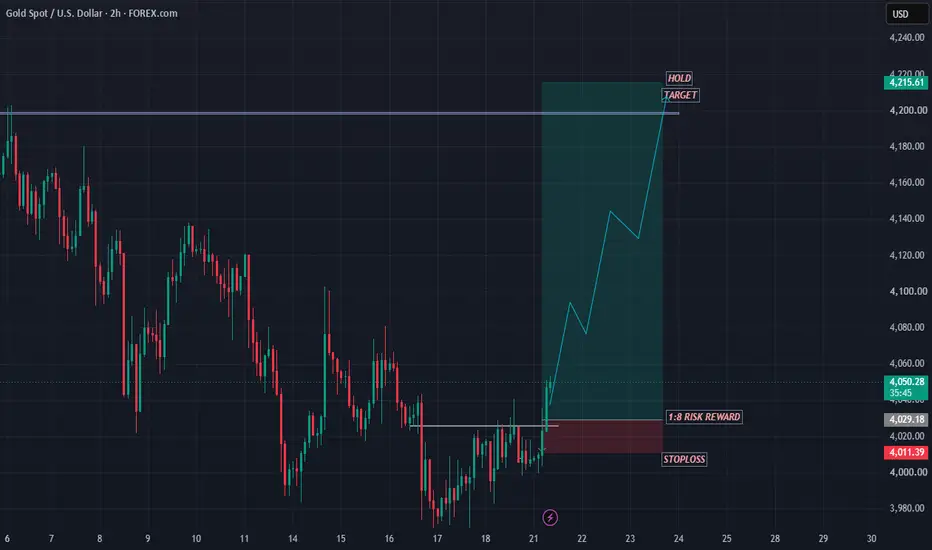
GOLD SHOWING A GOOD UP MOVE WITH 1:8 RISK REWARD GOLD SHOWING A GOOD UP MOVE WITH 1:8 RISK REWARD
DUE TO THESE REASON
A. its following a rectangle pattern that stocked the market
which preventing the market to move any one direction now it trying to break the strong resistant lable
B. after the break of this rectangle it will boost the market potential for break
C. also its resisting from a strong neckline the neckline also got weeker ald the price is ready to break in the outer region
all of these reason are indicating the same thing its ready for breakout BREAKOUT trading are follws good risk reward
please dont use more than one percentage of your capitalfollow risk reward and tradeing rules
that will help you to to become a bettertrader
thank you
Nifty Intraday Analysis for 21st July 2026NSE:NIFTY
Index is the range between 24000 - 24350 range and range bound moment is expected as long as the index will be in this range. If index breaks and sustain above 24350, then -
The upward movement may lead to 24450 – 24500 resistance range and if the index crosses and sustains above this level then may reach near 24700 – 24750 range.
On the contrary, The downward moment may drag the Index to 24000 – 23950 support range in downward momentum and if this support is broken then index may tank near 23750 – 23700 range.
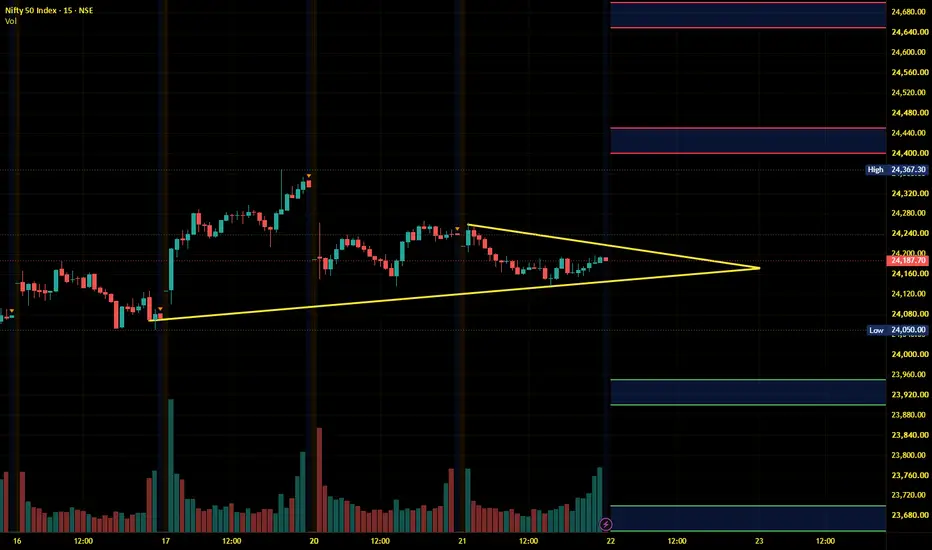
Nifty Intraday Analysis for 22nd July 2026NSE:NIFTY
Index is near 24200 - 24250 resistance zone and if the index sustain above this resistance, then -
The upward movement may lead to 24400 – 24450 resistance range and if the index crosses and sustains above this level then may reach near 24650 – 24700 range.
On the contrary, The downward moment may drag the Index to 23950 – 23900 support range in downward momentum and if this support is broken then index may tank near 23700 – 23650 range.
Midnifty Intraday Analysis for 21st July 2026NSE:NIFTY_MID_SELECT
Index is near resistance and if the index sustain above 14850 then -
The upward movement may lead the Index near 14950 – 14975 resistance range and if the index crosses and sustains above this level then may reach 15125 – 15150 range.
On the contrary, The downward moment may drag the index to 14625 – 14600 support range and if this support is broken then index may tank near 14450 – 14425 range.
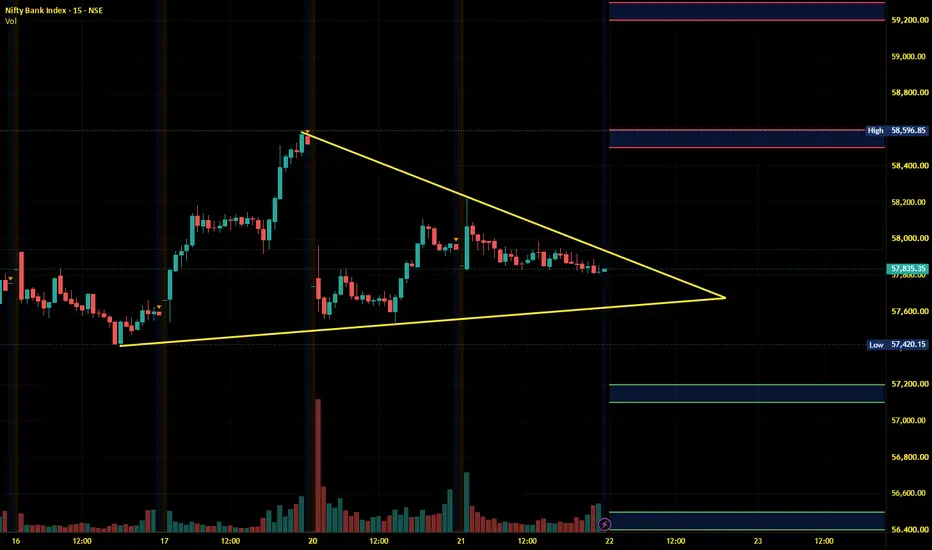
Banknifty Intraday Analysis for 22nd July 2026NSE:BANKNIFTY
Index near 58000 - 58100 resistance if Index could not break and sustain above this resistance then break down below 57700 will drag to Index down.
The upward moment may lead the Index to 58500 – 58600 resistance range in upward momentum and if the index crosses and sustains above this level then may reach near 59200 – 59300 range.
On the contrary, The downward moment may drag the Index to 57200 – 57100 support range in downward momentum and if this support is broken then the index may tank near the 56500 – 56400 range.
Banknifty Intraday Analysis for 21st July 2026NSE:BANKNIFTY
Index is the range between 57300 - 58600 range and range bound moment is expected as long as the index will be in this range.
The upward moment may lead the Index to 58600 – 58700 resistance range in upward momentum and if the index crosses and sustains above this level then may reach near 59300 – 59400 range.
On the contrary, The downward moment may drag the Index to 57300 – 57200 support range in downward momentum and if this support is broken then the index may tank near the 56500 – 56400 range.
Finnifty Intraday Analysis for 22nd July 2026NSE:CNXFINANCE
Highest Call OI in the Index is at 27500 strike, If Index sustain above 26500, rapid uptrend expected. If Index could not sustain above 26500 level then Index is expected to go down.
The upward movement may lead the Index to 26800 - 26850 resistance range and if the index crosses and sustains above this level then may reach near 27100 - 27150 range.
On the contrary, The downward moment may drag the to 26250 – 26200 support range and if this support too is broken then index may tank near 25950 – 25900 range.
Midnifty Intraday Analysis for 22nd July 2026NSE:NIFTY_MID_SELECT
Index is near resistance and if the index sustain above 14850 then -
The upward movement may lead the Index near 14975 – 15000 resistance range and if the index crosses and sustains above this level then may reach 15150 – 15175 range.
On the contrary, The downward moment may drag the index to 14650 – 14625 support range and if this support is broken then index may tank near 14475 – 14450 range.
Finnifty Intraday Analysis for 21st July 2026NSE:CNXFINANCE
Index is near support of 26400 - 26300 zone and uptrend is expected as long as index is above this support zone.
The upward movement may lead the Index to 26850 - 26900 resistance range and if the index crosses and sustains above this level then may reach near 27150 - 27200 range.
On the contrary, The downward moment may drag the to 26400 – 26350 support range and if this support too is broken then index may tank near 26100 – 26050 range.
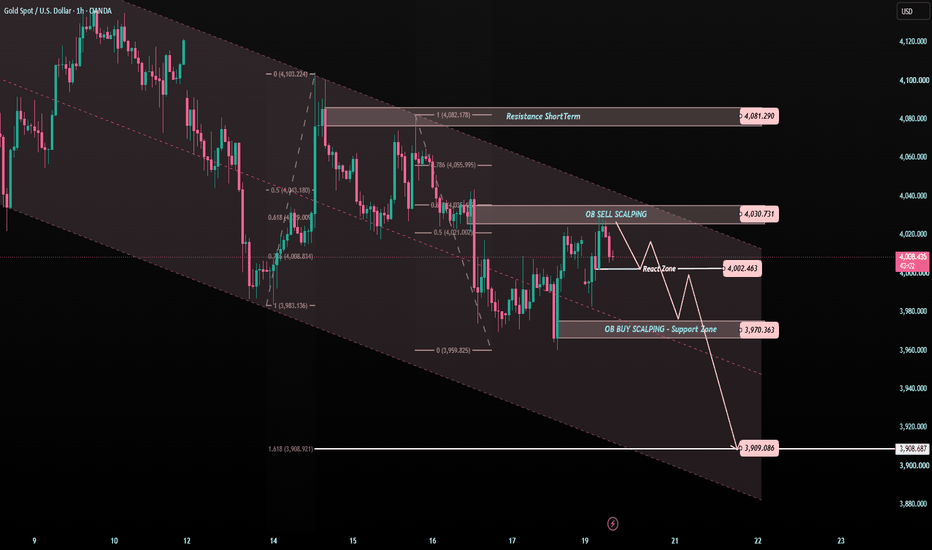
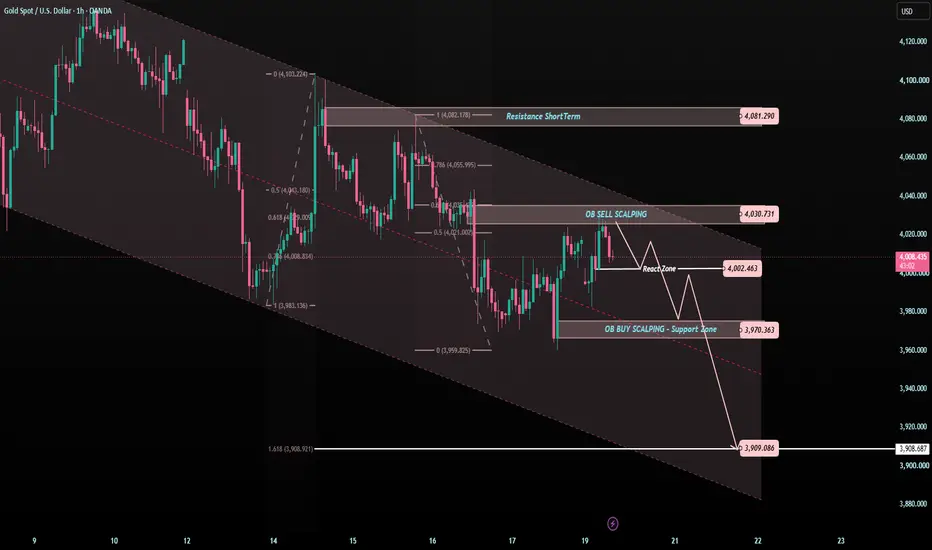
XAUUSD — 4,030 Is the Trap Zone?Gold is still moving inside the descending price channel.
Price is trading around 4,010 after reacting from the lower area, but the recovery is not clean yet.
Why?
Because gold is now moving into the first sell reaction zone, while the larger structure is still under bearish pressure.
For me, today’s chart is not about chasing the bounce.
It is about watching whether 4,030 becomes a trap for buyers.
The simple read
Gold is still cautious while price stays below 4,030.
The 4,030 area is the OB sell scalping zone and also sits near the Fibonacci reaction structure.
If sellers defend this zone, gold may rotate lower again toward 4,002.
If 4,002 fails, the next important support is 3,970.
Below 3,970, the deeper downside target is 3,909.
The stronger resistance remains higher at 4,081.
Gold needs to reclaim 4,030 first, then 4,081, before the recovery becomes cleaner.
Key price zones
Current price area: 4,005 - 4,015
First reaction zone: 4,002
OB sell scalping zone: 4,030
Short-term resistance: 4,081
OB buy scalping / support zone: 3,970
Fibo extension target: 3,909
Bearish pressure weakens above: 4,030
Recovery becomes stronger above: 4,081
Trading plan
📉 Rejection scenario
If gold reaches 4,030 and shows rejection:
Sellers may try to push price back toward 4,002.
If 4,002 breaks, the next support zone is 3,970.
If 3,970 also fails, the deeper target becomes 3,909.
This keeps the descending channel structure active.
📈 Short recovery scenario
If gold breaks and holds above 4,030:
A short-term recovery may continue toward 4,081.
But this is still not a full bullish reversal yet.
Gold needs a clean break and hold above 4,081 before the recovery structure becomes stronger.
No clean hold above 4,030 = no strong buy view.
📈 Support reaction scenario
If gold pulls back into 3,970:
This is the first important buy reaction area on the chart.
A clean bullish reaction from 3,970 may create a short-term bounce.
But if 3,970 breaks clearly, I will watch 3,909 as the deeper reaction zone.
No reaction from support = no buy.
Tiara’s View
A small recovery inside a bearish channel can look attractive.
But if price is still below resistance, the market can easily turn the bounce into a trap.
That is why 4,030 is the key level today.
If gold cannot break this zone, sellers may still control the next move.
If gold holds above it, the chart may try to recover toward 4,081.
Main view:
Gold remains cautious below 4,030.
4,030 is the trap zone to watch.
4,002 and 3,970 are the nearest support areas.
3,909 is the deeper downside target if the channel keeps control.
Reaction first.
Confirmation second.
Trade last.
No confirmation = no trade.
Do you think gold will break 4,030, or reject from this trap zone first?
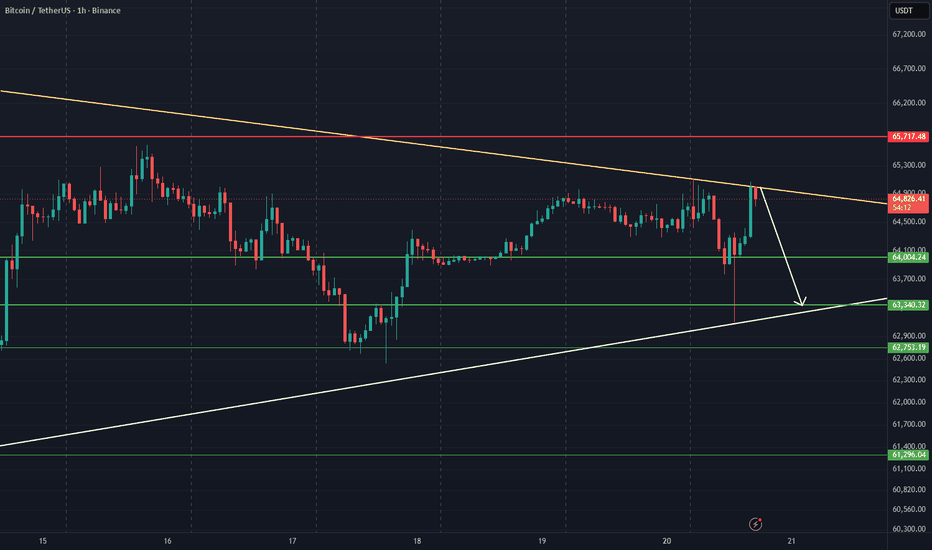
BTCUSD Rejection at Major Resistance? Short Setup Around 65000BTCUSD Analysis: Watching the 65,000–65,100 Resistance Zone
BTCUSD is approaching a key resistance area between 65,000 and 65,100, where sellers could step in and trigger a bearish rejection.
Trade Idea
Entry Zone: 65,000 – 65,100
Bias: Bearish
Stop Loss: 65,710
Target 1: 64,000
Target 2: Below 64,000 (depending on momentum)
Why this setup?
Price is testing a significant resistance zone.
A rejection here could attract fresh selling pressure.
Risk-to-reward becomes attractive if the resistance holds.
Trade Management
Wait for bearish confirmation (such as a rejection candle, bearish engulfing pattern, or lower-timeframe market structure break) before entering. If BTC closes decisively above 65,710, the bearish setup becomes invalid.
Disclaimer: This is a technical analysis idea based on price action and key resistance levels. Always manage your risk and wait for confirmation before entering any trade.
Do you expect BTC to reject this resistance or break through it? Share your view below.
📌 Disclaimer:
This analysis is for educational purposes only and is not financial advice. Always manage risk and follow your trading plan.
Your feedback drives our content and keeps everyone trading smarter. Let’s make those pips together! 🚀
Happy Trading,
– The InvestPro Team
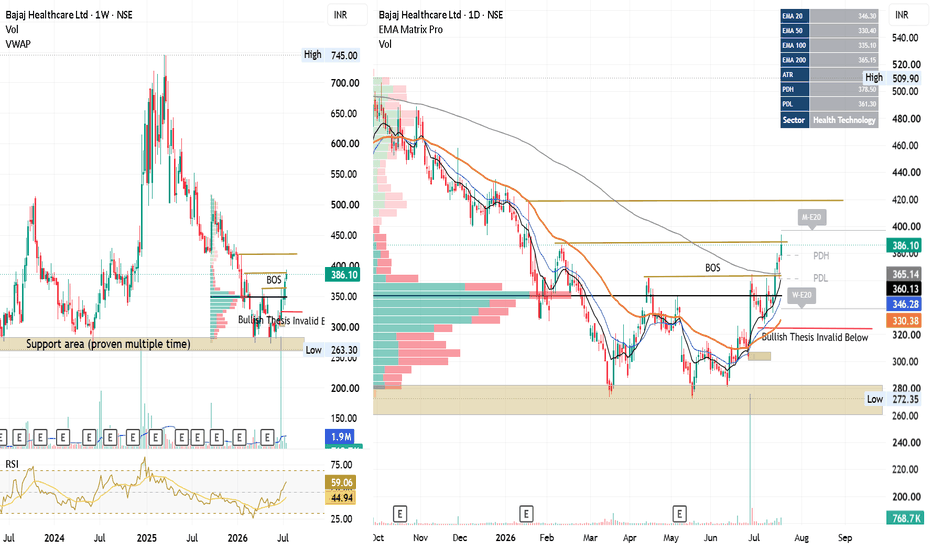
Bajaj Healthcare: Multi-Year Base Breakout SignalsNSE:BAJAJHCARE
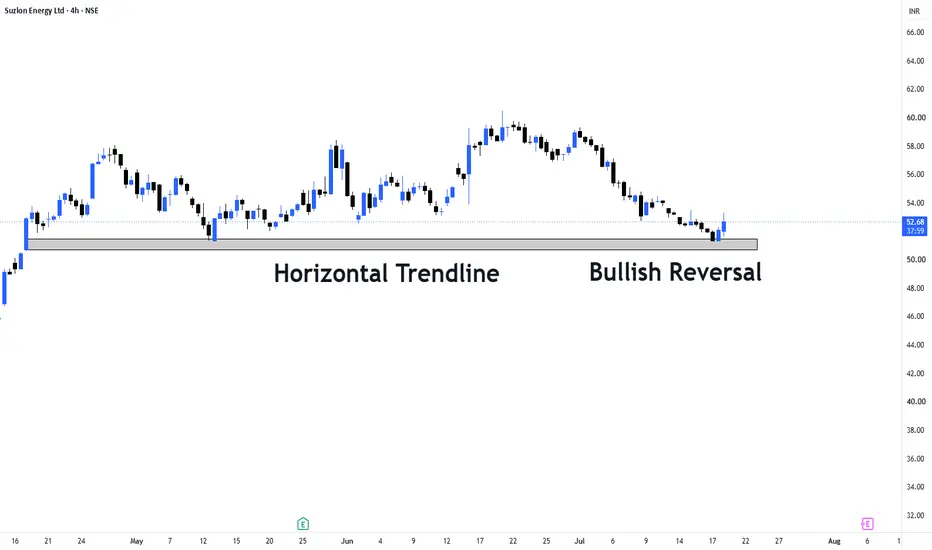
Bajaj Healthcare Ltd. has shown a strong recovery from its long-term support zone around ₹260–280, an area that has been defended multiple times on the weekly chart.
The recent move above the previous swing high has resulted in a clear Break of Structure (BOS), indicating that the stock may be transitioning from a prolonged corrective phase into a new bullish structure.
Key observations:
• Multi-tested weekly demand zone remains intact.
• Price has reclaimed the high-volume accumulation area.
• Daily structure has shifted from lower highs to higher highs.
• Price is trading above EMA20, EMA50, EMA100 and EMA200.
• EMA200 is now acting as an important reference level.
• Weekly RSI has moved back above 50, supporting improving momentum.
Important levels:
Immediate Support : ₹360–365
Structure Support : ₹330–340
Major Demand : ₹260–275
Near Resistance : ₹420
Next Resistance :₹470
Major Resistance: ₹520
Trading plan: As long as price sustains above the ₹330–340 structure zone, the bullish setup remains valid. A successful hold above ₹360–365 could open the path toward ₹420 and higher resistance levels.
Bullish thesis invalidation : A decisive breakdown below the marked invalidation zone would weaken the current bullish structure and increase the probability of a deeper retracement.
Educational observation: The chart currently reflects a classic sequence of demand absorption → accumulation → BOS → potential markup phase, making it an interesting case study for positional and swing traders.
------------------------------------------------------------------------------------------------------------------
Disclaimer: This analysis is shared purely for educational and informational purposes. It is not investment advice, a recommendation, or a solicitation to buy or sell any security. Please conduct your own research and manage risk appropriately before taking any trade.
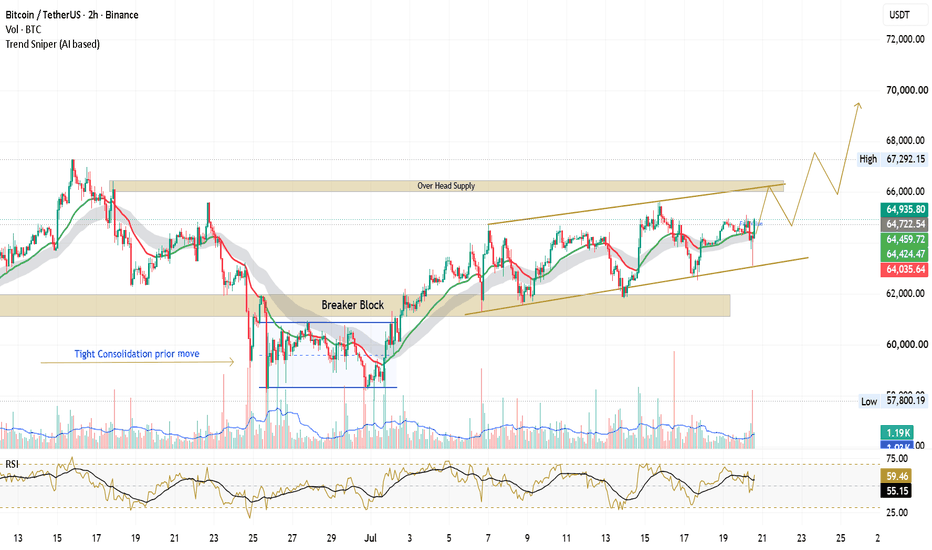
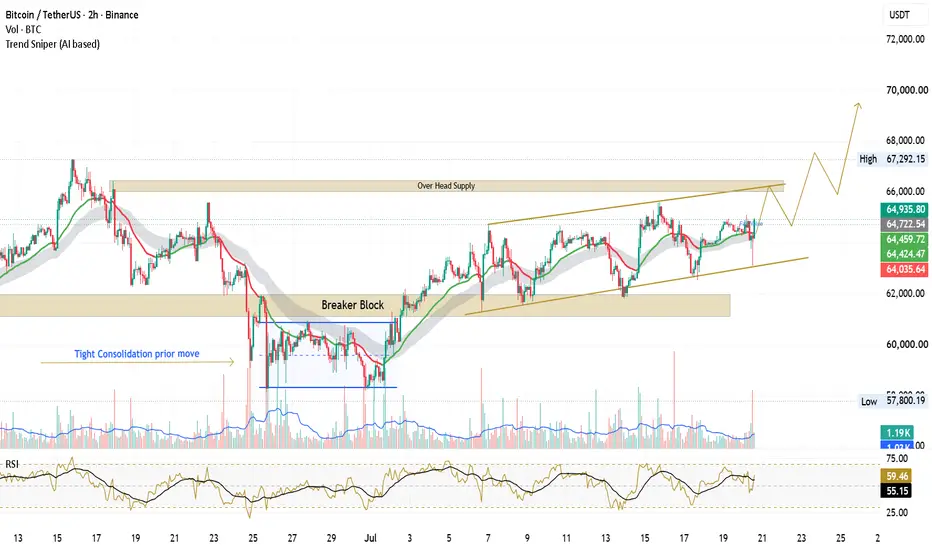
BTCUSDT: Ascending Structure Meets Major Supply Zone – Breakout BINANCE:BTCUSDT
BTCUSDT is approaching a significant overhead supply zone after maintaining a series of higher lows within an ascending structure on the 2H timeframe.
A previous breaker block has successfully acted as support, reinforcing the current bullish market structure. The recent consolidation near resistance suggests buyers are absorbing supply, but confirmation is still required before assuming a sustained breakout.
Key observations:
* Price continues to respect the ascending trendline.
* Breaker block has provided a strong reaction, indicating demand at lower levels.
* Tight consolidation before the impulsive move highlights an important accumulation area.
* Immediate focus remains on the marked overhead supply zone.
Possible scenarios:
* A convincing breakout and acceptance above the supply zone could lead to continuation toward higher price levels.
* Failure to sustain above resistance may result in another pullback toward the ascending trendline or the breaker block for a retest.
As always, confirmation through price action and volume is more important than anticipating the next move.
Disclaimer: This analysis is shared solely for educational and informational purposes. It reflects personal observations of market structure and price action and should not be considered financial or investment advice. Always conduct your own research and manage risk appropriately before making trading decisions.
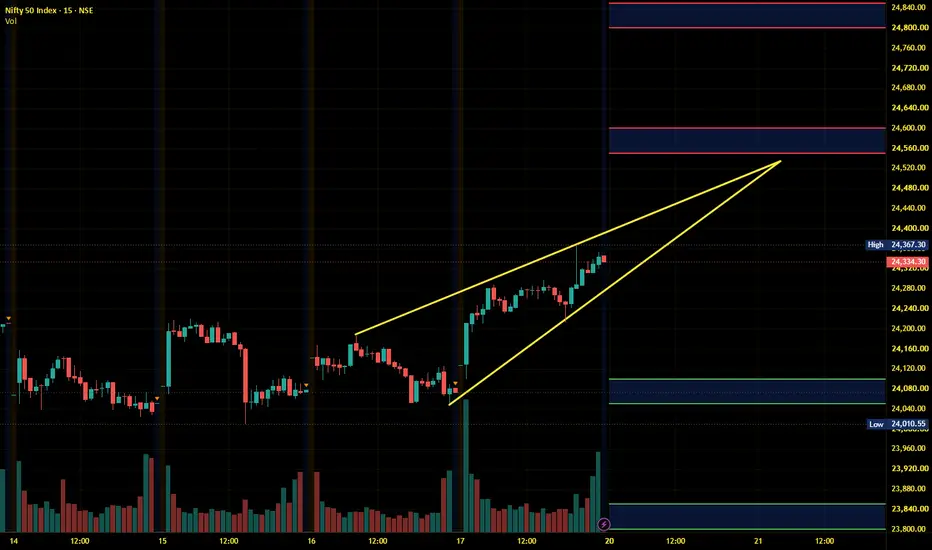
Nifty Intraday Analysis for 20th July 2026NSE:NIFTY
Volatility is expected in the index due to mixed results from banking sector stocks as well as RIL.
The upward movement may lead to 24550 – 24600 resistance range and if the index crosses and sustains above this level then may reach near 24800 – 24850 range.
On the contrary, The downward moment may drag the Index to 24100 – 24050 support range in downward momentum and if this support is broken then index may tank near 23850 – 23800 range.
Midnifty Intraday Analysis for 20th July 2026NSE:NIFTY_MID_SELECT
Index is near resistance and if the index sustain above 14750 then -
The upward movement may lead the Index near 14875 – 14900 resistance range and if the index crosses and sustains above this level then may reach 15050 – 15075 range.
On the contrary, The downward moment may drag the index to 14575 – 14550 support range and if this support is broken then index may tank near 14400 – 14375 range.
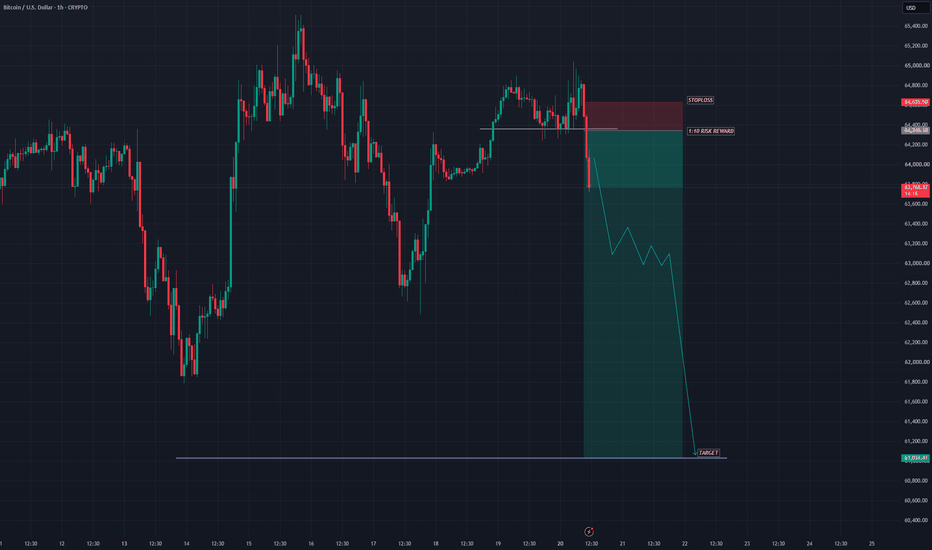
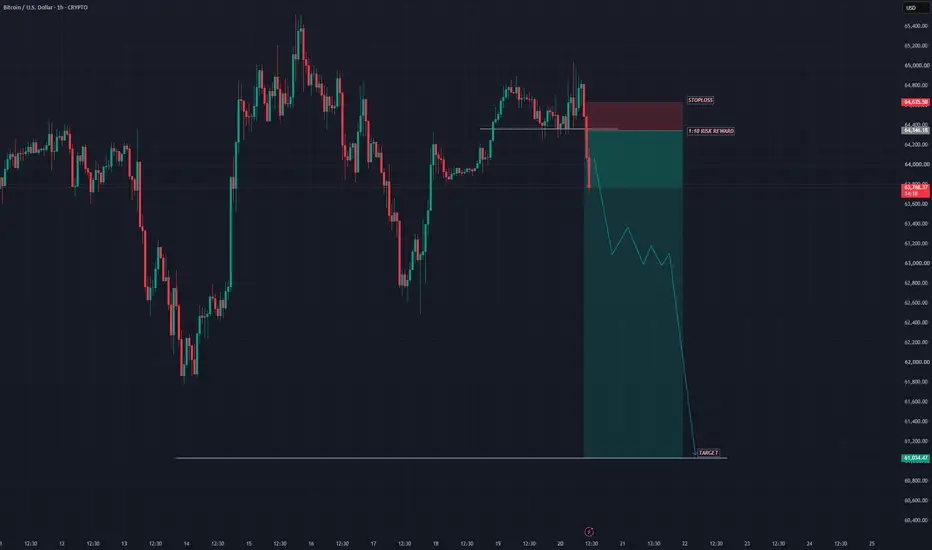
BTCUSD SHOWING A GOOD DOWN MOVE WITH 1:10 RISK REWARD BTCUSD SHOWING A GOOD DOWN MOVE WITH 1:10 RISK REWARD
DUE TO THESE REASON
A. its following a rectangle pattern that stocked the marketwhich preventing the market to move any one direction now it trying to break the strong resistant lable
B. after the break of this rectangle it will boost the market potential for breakC. also its resisting from a strong neckline the neckline also got weeker ald the price is ready to break in the outer region
all of these reason are indicating the same thing its ready for breakout BREAKOUT trading are follws good risk reward
please dont use more than one percentage of your capitalfollow risk reward and tradeing rules that will help you to to become a bettertrader
thank you