Finnifty Intraday Analysis for 05th August 2026NSE:CNXFINANCE
Index has immediate minor resistance near 27000 and if crosses and sustains above this level then uptrend may lead to 27500.
The upward movement may lead the Index to 27100 - 27150 resistance range and if the index crosses and sustains above this level then may reach near 27400 - 27450 range.
On the contrary, The downward moment may drag the to 26600 – 26550 support range and if this support too is broken then index may tank near 26300 – 26250 range.
Support and Resistance
Midnifty Intraday Analysis for 05th August 2026NSE:NIFTY_MID_SELECT
Uptrend is expected to continue as long as the Index is above 14700.
The upward movement may lead the Index near 15025 – 15050 resistance range and if the index crosses and sustains above this level then may reach 15200 – 15225 range.
On the contrary, The downward moment may drag the index to 14725 – 14700 support range and if this support is broken then index may tank near 14550 – 14525 range.
XAUUSD — 4,047 Holds, 4,104 Opens?Gold is starting to build a cleaner recovery structure.
After reacting from the lower support area around 4,020, price has moved back above the previous descending pressure and is now trading inside a short-term rising channel.
This is a better sign for buyers.
But the market is not fully clear yet.
Why?
Because gold is still below the next reaction resistance around 4,085 and the stronger OB sell zone near 4,104.
The simple read
Gold is currently trading around 4,055 - 4,065.
The key su
Banknifty Intraday Analysis for 05th August 2026NSE:BANKNIFTY
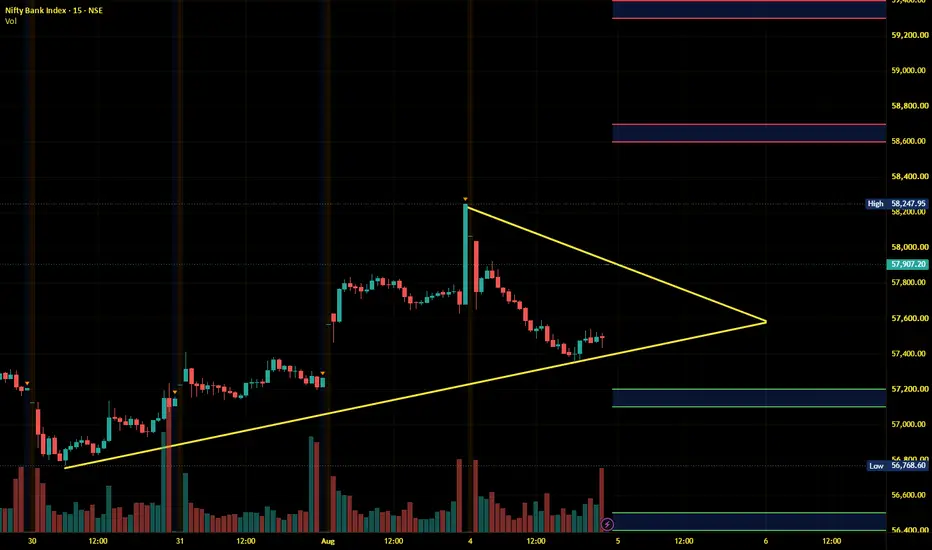
Index is near 58000 make or break level as highest Call and Put OI is at 58000 strike.
The upward moment may lead the Index to 58600 – 58700 resistance range in upward momentum and if the index crosses and sustains above this level then may reach near 59300 – 59400 range.
On the contrary, The downward moment may drag the Index to 57200 – 57100 support range in downward momentum and if this support is broken then the index may tank near the 56500 – 56400 range.
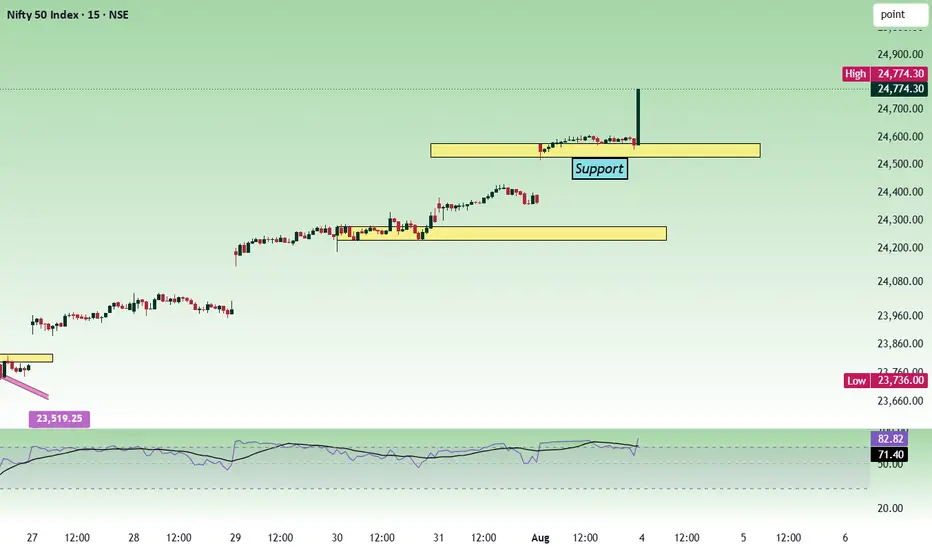
Nifty Intraday Analysis for 04th August 2026NSE:NIFTY
Index is overbought and expected to cool down on week Option expiry day.
The upward movement may lead to 25000 – 25050 resistance range and if the index crosses and sustains above this level then may reach near 25250 – 25300 range.
On the contrary, The downward moment may drag the Index to 24550 – 24500 support range in downward momentum and if this support is broken then index may tank near 24300 – 24250 range.
Banknifty Intraday Analysis for 04th August 2026NSE:BANKNIFTY
Index is near 58500 - 58600 overbought resistance zone and uptrend will continue if it sustains above this resistance zone.
The upward moment may lead the Index to 59000 – 59100 resistance range in upward momentum and if the index crosses and sustains above this level then may reach near 59700 – 59800 range.
On the contrary, The downward moment may drag the Index to 57500 – 57400 support range in downward momentum and if this support is broken then the index may tank near the
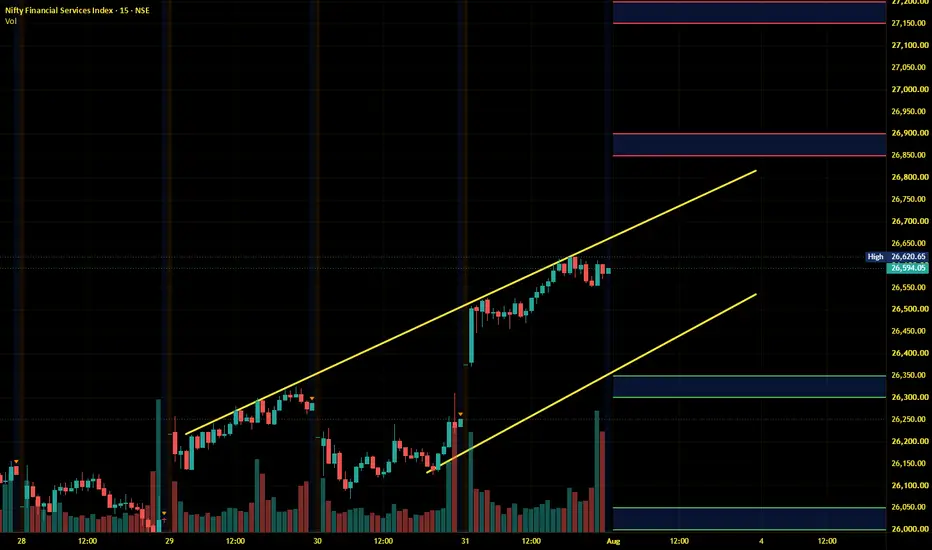
Finnifty Intraday Analysis for 04th August 2026NSE:CNXFINANCE
Index is near 27050 - 27100 overbought resistance zone and uptrend will continue if it sustains above this resistance zone.
The upward movement may lead the Index to 27250 - 27300 resistance range and if the index crosses and sustains above this level then may reach near 27550 - 27600 range.
On the contrary, The downward moment may drag the to 26750 – 26700 support range and if this support too is broken then index may tank near 26450 – 26400 range.
Midnifty Intraday Analysis for 04th August 2026NSE:NIFTY_MID_SELECT
Uptrend is expected to continue as long as the Index is above 14700.
The upward movement may lead the Index near 15050 – 15075 resistance range and if the index crosses and sustains above this level then may reach 15225 – 15250 range.
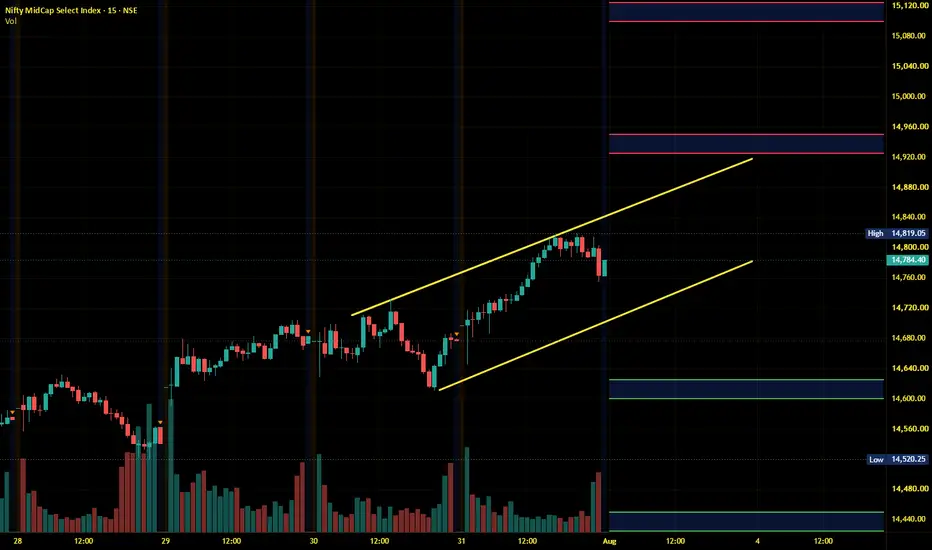
On the contrary, The downward moment may drag the index to 14750 – 14725 support range and if this support is broken then index may tank near 14575 – 14550 range.
LIC Life Insurance Corporation- Showing weaknessNSE:LICI
Lic India
Shows weakness after hitting his trendline resistance.
in daytime frame price standing on support zone and also take support after gap down opening
Plan:
1. daytime making spinning top with high volume, there is high chance to reversal may not be immediately, but reversal can be possible. price also stand at support zone 402-389.
2. weekly time frame shows clearly weakness, but good fundamental stock can be going sideways rather than to downside. weekly time frame major su
TITAN 1. Fundamental Outlook: Has Titan Given Its Full Run, or Is There Room Left?
While Titan has already delivered legendary compound returns over the decades, its fundamental business story is far from exhausted.
Why the Fundamental Runway Remains Strong
Unorganized-to-Organized Shift: The Indian jewellery market is still roughly 60–65% unorganized. Tanishq, Mia, and Zoya have immense headroom to capture market share from local unorganized jewelers as consumers demand certified purity and trans
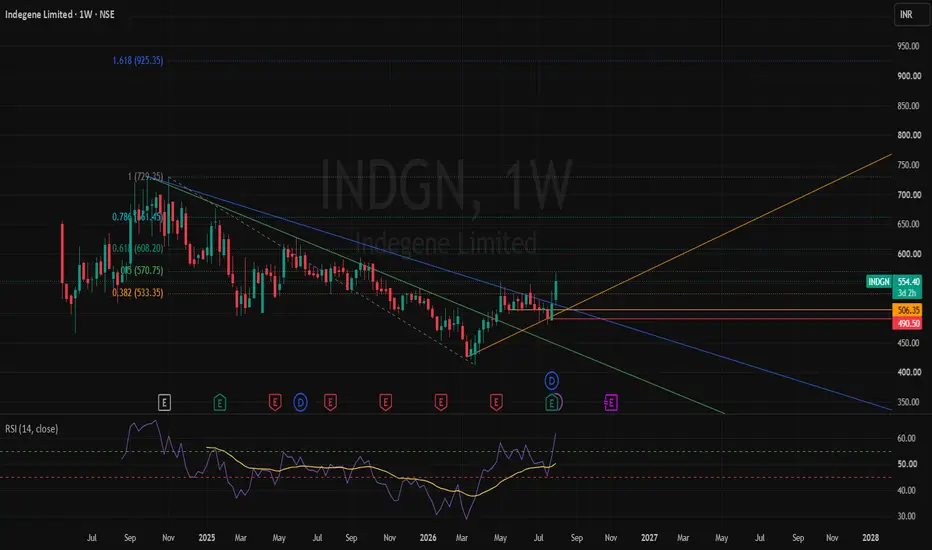
INDGN: Weekly Recovery Attempt | 570–620 Zone Now in FocusINDGN is showing an interesting weekly recovery setup after spending many months inside a falling structure.
The chart had been under pressure for a long time, but recent price action suggests that weakness may be slowing and a base formation / recovery attempt may be developing. The stock has pushed up from lower levels and is now testing an important resistance cluster.
My view:
The immediate recovery structure remains constructive as long as price holds above the ₹506–490 zone.
The first me
One 97 Communications (Paytm): Wave (iv) Testing a Key Support CPrice is correcting after a strong impulsive Wave (iii) advance and has entered a confluence support zone.
The 38.2% Fibonacci retracement (~₹1,276) aligns closely with prior price structure, making this the first area to watch for a potential Wave (iv) completion. If buyers defend this zone, the trend may be preparing for a Wave (v) continuation.
A sustained break below this area would shift attention towards the 50% (₹1,236) and 61.8% (₹1,195) retracement levels.
Waiting for price confirmat
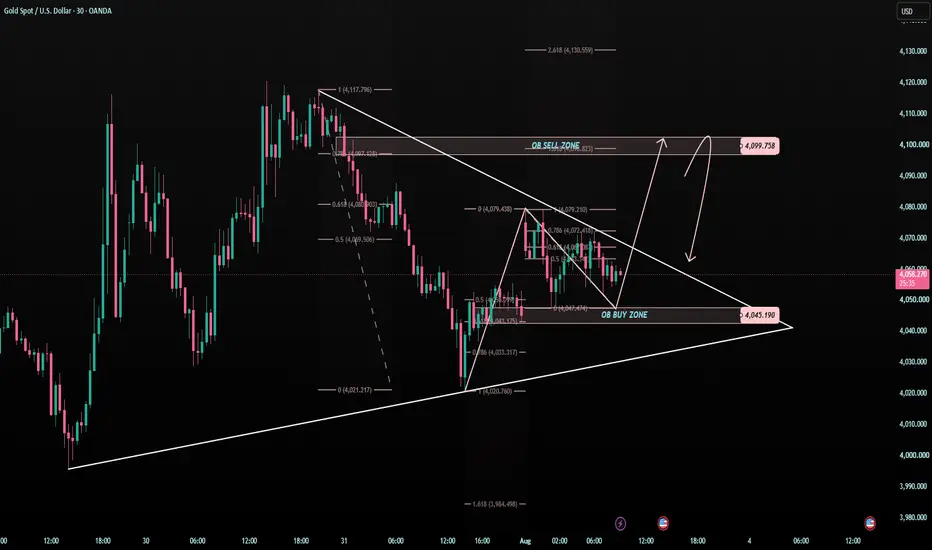
XAUUSD — The Compression Before 4,100Gold is moving inside a tight decision structure.
Price is now trading around 4,050 - 4,060, sitting between the short-term downtrend pressure and the OB Buy Zone around 4,045.
This is not the best place to chase.
It is the place to wait.
The simple read
Gold is compressing near support.
The 4,045 area is the key OB Buy Zone on the chart.
If buyers defend this zone, price may try to break the short-term downtrend line and continue toward 4,080 first.
Above 4,080, the next major target be
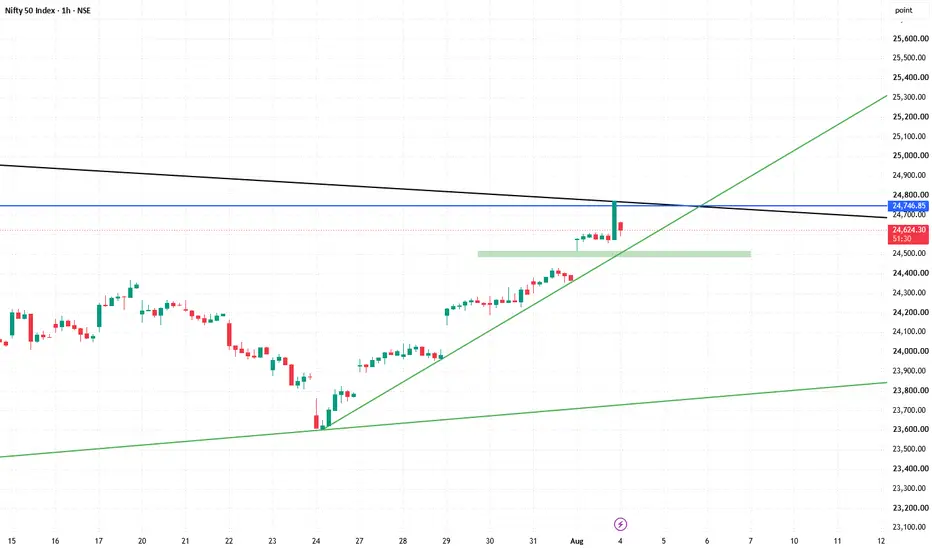
NIFTY Pullback Buying Zone | 24,500–24,520 in FocusAfter a strong bullish move, NIFTY is witnessing a healthy retracement rather than a trend reversal. As long as the broader market structure remains intact, this pullback could offer a favorable buying opportunity for swing traders.
Trade Setup
Buy Zone: 24,500–24,520
Target 1: 24,700
Target 2: 24,750
Extended Target: Higher levels if momentum continues and price sustains above resistance.
Trade Thesis
Overall trend remains bullish with higher highs and higher lows.
Current declin
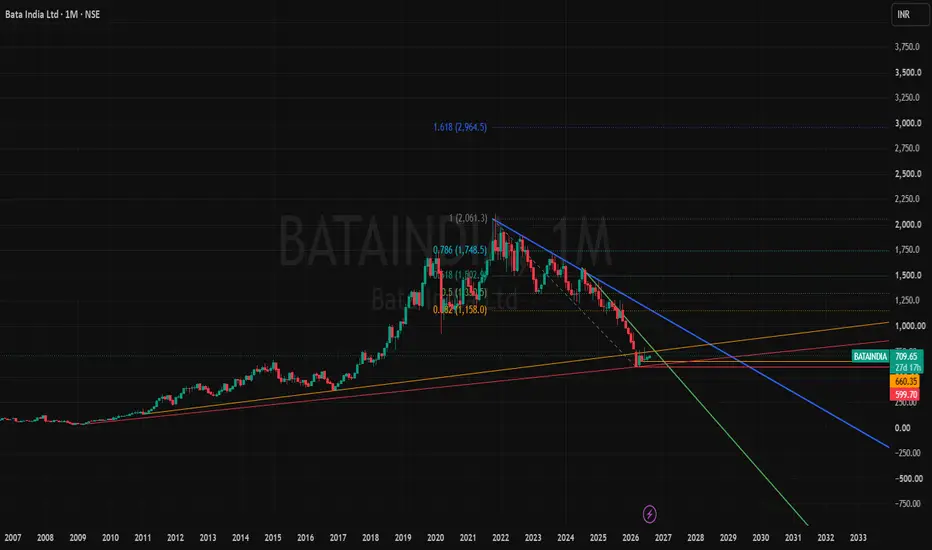
BATAINDIA | Multi-Year Base — ₹800 Breakout WatchBata India — Weekly and Monthly Chart Study
NSE: BATAINDIA
After a prolonged correction from above ₹2,000, Bata India is attempting to stabilize near an important long-term support area.
The present move is constructive, but the larger trend has not reversed yet. The first test is near ₹720–740, while a sustained move above ₹780–800 would provide stronger evidence of a weekly trend change.
Current stage: Early Recovery Watch
Primary timeframe: Weekly and monthly
Approach: Long-term weekly tre
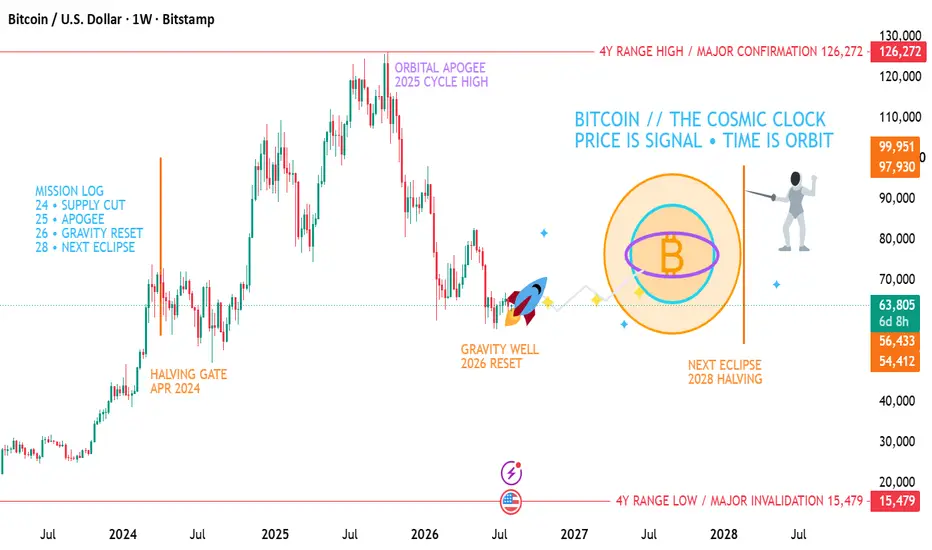
The Cosmic Clock – Is Time More Important Than Price?Most traders focus only on price . This chart suggests looking at time instead.
The idea is simple: Bitcoin moves in repeating market cycles, and major turning points often appear around important time-based events such as the halving. Instead of predicting every price swing, the chart treats time as the framework that guides the next big move.
After reaching a cycle high in 2025, Bitcoin entered a corrective phase. The current area is marked as a "Gravity Well Reset," suggesting the marke
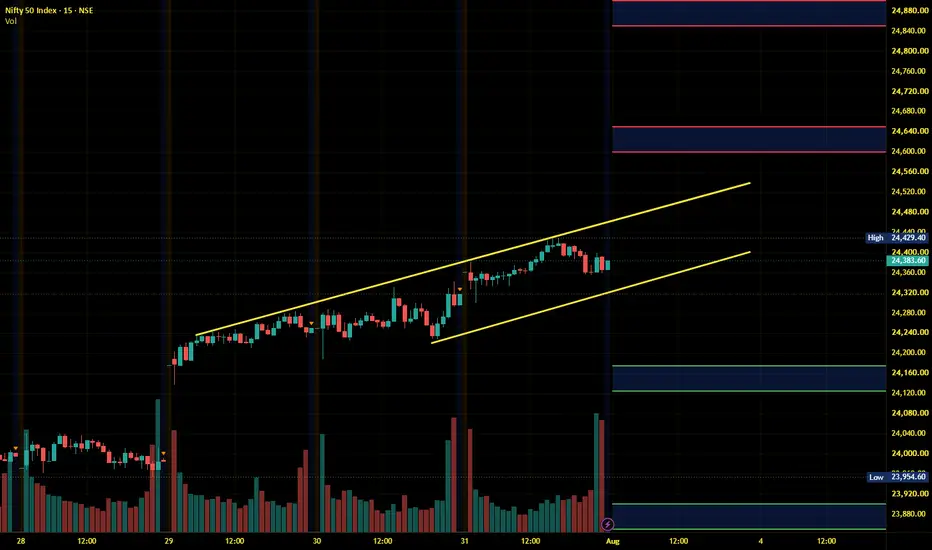
Nifty Intraday Analysis for 03rd August 2026NSE:NIFTY
Index has support near 24300 and resistance near 24400 level and if the Index break and sustain above 24450 then -
The upward movement may lead to 24600 – 24650 resistance range and if the index crosses and sustains above this level then may reach near 24850 – 24900 range.
On the contrary, The downward moment may drag the Index to 24175 – 24125 support range in downward momentum and if this support is broken then index may tank near 23900 – 23850 range.
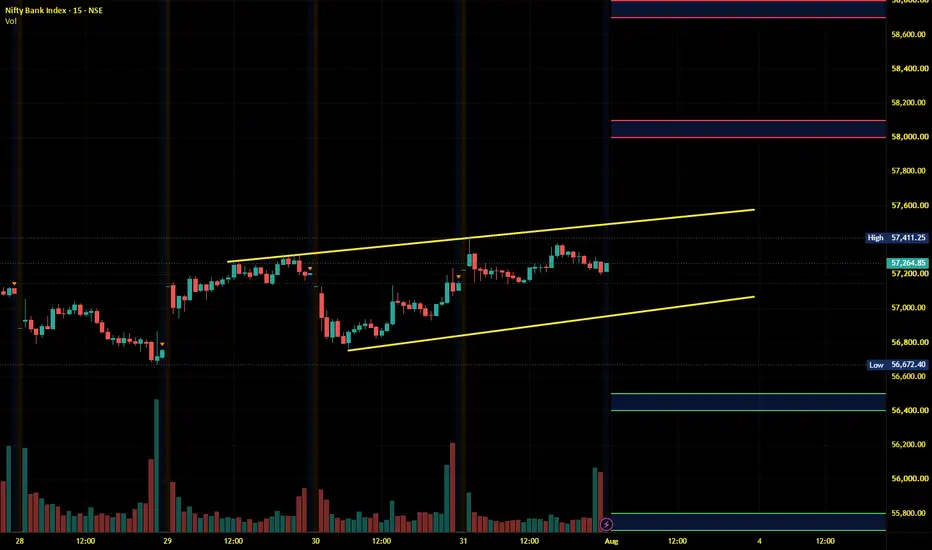
Banknifty Intraday Analysis for 03rd August 2026NSE:BANKNIFTY
Index is near 57300 - 57400 resistance zone and if the Index breaks and sustains above this zone.
The upward moment may lead the Index to 58000 – 58100 resistance range in upward momentum and if the index crosses and sustains above this level then may reach near 58700 – 58800 range.
On the contrary, The downward moment may drag the Index to 56500 – 56400 support range in downward momentum and if this support is broken then the index may tank near the 55800 – 55700 range.
Finnifty Intraday Analysis for 03rd August 2026NSE:CNXFINANCE
Uptrend is expected to continue as long as the Index is above 26500.
The upward movement may lead the Index to 26850 - 26900 resistance range and if the index crosses and sustains above this level then may reach near 27150 - 27200 range.
On the contrary, The downward moment may drag the to 26350 – 26300 support range and if this support too is broken then index may tank near 26050 – 26000 range.
Midnifty Intraday Analysis for 03rd August 2026NSE:NIFTY_MID_SELECT
Uptrend is expected to continue as long as the Index is above 14700.
The upward movement may lead the Index near 14925 – 14950 resistance range and if the index crosses and sustains above this level then may reach 15100 – 15125 range.
On the contrary, The downward moment may drag the index to 14625 – 14600 support range and if this support is broken then index may tank near 14450 – 14425 range.
Nifty - Expiry day analysis August 4The price took support from the 24500 zone and is moving up. On the daily chart, we can see clearly that the price opened and closed above the important resistance zone, which shows bullish strength.
Buy above 24820 with a stop loss of 24760 for the targets 24860, 24920 and 24960.
Sell below 24640 with a stop loss of 24700 for the targets 24600, 24560 and 24520.
Expected expiry day range is 24700 to 25100.
Always do your analysis before taking any trade.
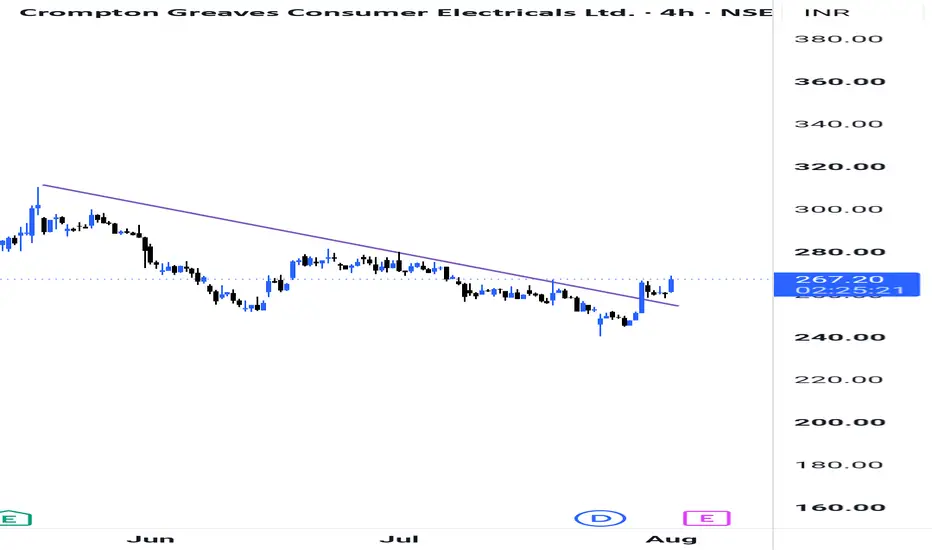
CROMPTON Trendline Breakout Confirmed | Breakout Retest SuccessfCROMPTON has confirmed a strong bullish reversal after breaking out of a long-term descending trendline on the 4H timeframe. The breakout was backed by a powerful bullish candle, followed by a successful retest of the breakout zone, where previous resistance acted as new support. Price has now moved above the previous swing high, confirming a bullish market structure with higher highs.
This Breakout → Retest → Higher High sequence is one of the strongest momentum continuation patterns in technic
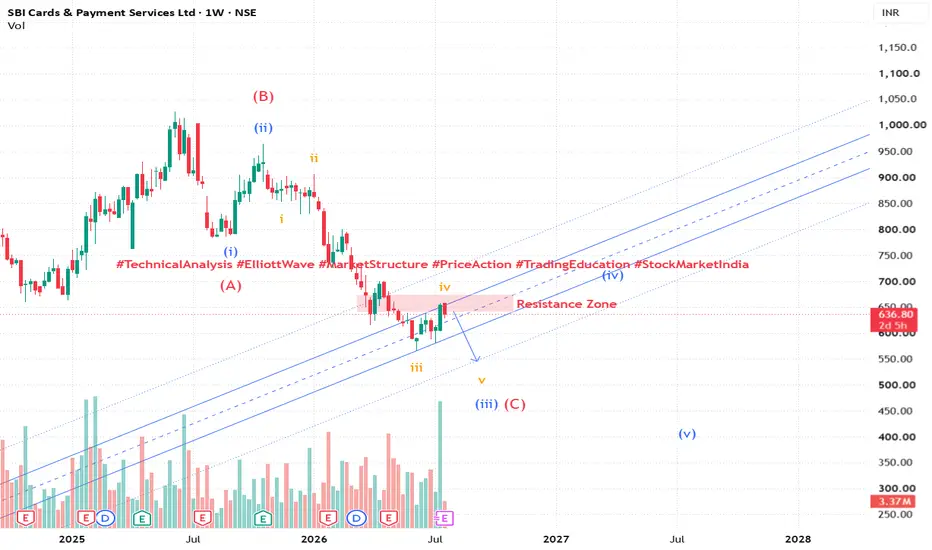
SBI Cards: Two Valid Counts, One Decision ZoneOne of the strengths of Elliott Wave is that it encourages thinking in multiple scenarios rather than forcing a single market narrative.
The current structure in SBI Cards can be interpreted in two ways:
The ongoing advance may represent Wave (iv) within a larger impulsive decline.
Alternatively, the entire decline from the highs may be unfolding as an ABC correction, with the current 1–5 impulse forming Wave (C).
At this stage, both counts remain technically valid and indicate a downside mov
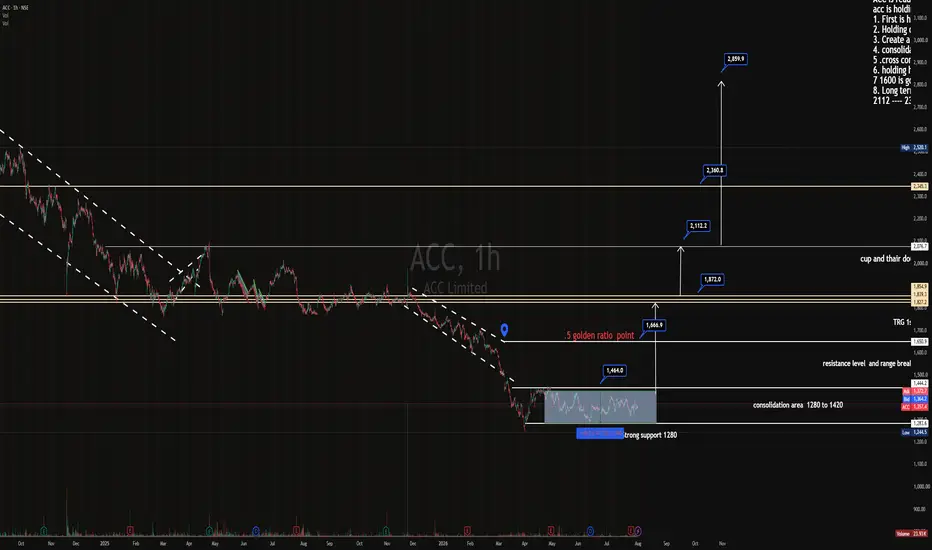
ACC ON DISCOUNTED PRICE FOR BUY ACC is ready for reversal
acc is holding multiple technical point and chart pattern
1. First is half from top on discounted price
2. Holding double down side channel Reversal sign
3. Create a support at bottom 1200 & 1800
4. consolidation and range between 1280 to 1420
5 .cross consolidation zone and resitance point give breakout 1420 to 1620
6. holding hook pattern and rounding bottom reversal + range breakout double channel
7 1600 is golden ratio of fab point
8. Long term double top