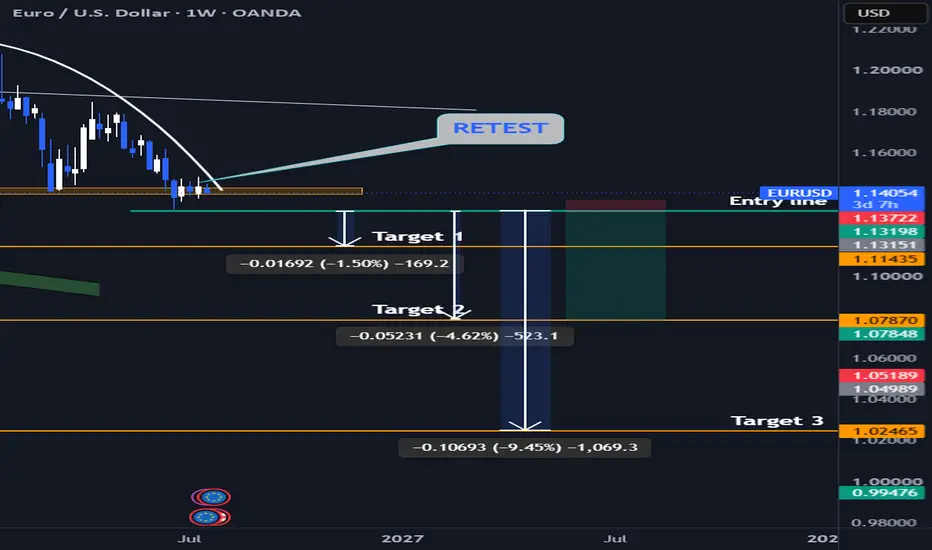
EURO Ready For Another DIP? Short Target of 1000+Pips!Hey everyone! It’s been a minute, but I'm back with a HUGE swing opportunity on EUR/USD! 🔥
Zoom out on the Weekly TF and look at this setup we’ve got a clear declining triple top / rounding top pattern pushing right up against major trendline resistance! We are prime and ready for a massive markdown! 💥
⏳ The Play: This is a high-patience swing trade. Expect it to unfold over 2.5 to 3 months, so stick to the Weekly chart and let the trade work its magic! This is the ultimate test of trader disc
Support and Resistance
XAUUSD GOLD ANALYSIS ON (21 JUL 2026)#XAUUSD UPDATEDE
SELL LIMITED - 4078-4088
If price stay below 4110, then next target 4040,4010 and 3970 and above that 4150
Plan;If price break 4078-4088 area,and stay below 4080,we will place sell order in gold with target of 4040,4010 and 3970 & stop loss should be placed at 4110
Nifty Intraday Analysis for 21st July 2026NSE:NIFTY
Index is the range between 24000 - 24350 range and range bound moment is expected as long as the index will be in this range. If index breaks and sustain above 24350, then -
The upward movement may lead to 24450 – 24500 resistance range and if the index crosses and sustains above this level then may reach near 24700 – 24750 range.
On the contrary, The downward moment may drag the Index to 24000 – 23950 support range in downward momentum and if this support is broken then index
Banknifty Intraday Analysis for 21st July 2026NSE:BANKNIFTY
Index is the range between 57300 - 58600 range and range bound moment is expected as long as the index will be in this range.
The upward moment may lead the Index to 58600 – 58700 resistance range in upward momentum and if the index crosses and sustains above this level then may reach near 59300 – 59400 range.
On the contrary, The downward moment may drag the Index to 57300 – 57200 support range in downward momentum and if this support is broken then the index may tank near t
Finnifty Intraday Analysis for 21st July 2026NSE:CNXFINANCE
Index is near support of 26400 - 26300 zone and uptrend is expected as long as index is above this support zone.
The upward movement may lead the Index to 26850 - 26900 resistance range and if the index crosses and sustains above this level then may reach near 27150 - 27200 range.
On the contrary, The downward moment may drag the to 26400 – 26350 support range and if this support too is broken then index may tank near 26100 – 26050 range.
Midnifty Intraday Analysis for 21st July 2026NSE:NIFTY_MID_SELECT
Index is near resistance and if the index sustain above 14850 then -
The upward movement may lead the Index near 14950 – 14975 resistance range and if the index crosses and sustains above this level then may reach 15125 – 15150 range.
On the contrary, The downward moment may drag the index to 14625 – 14600 support range and if this support is broken then index may tank near 14450 – 14425 range.
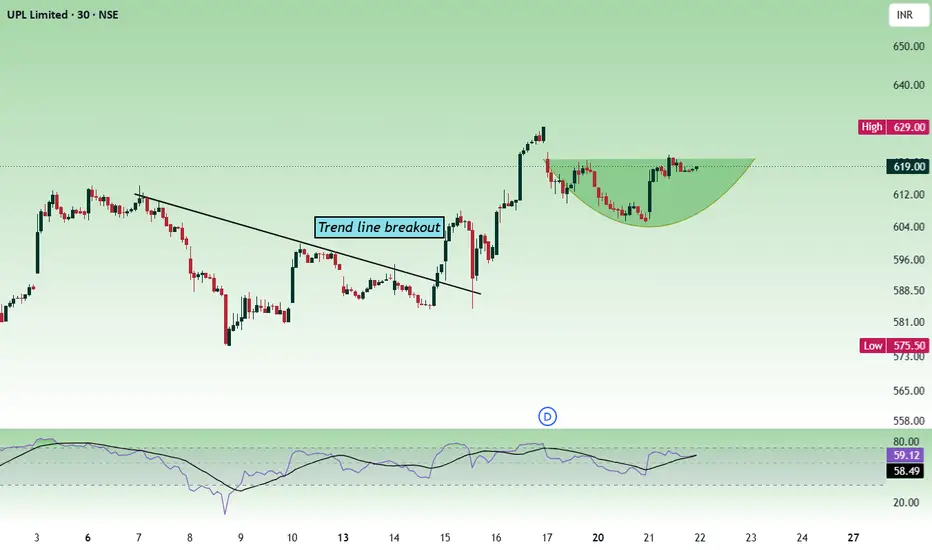
UPL - Multitime frame analysisAs per the daily time frame, the price has given a trendline breakout and sustained above the trendline. In the lower time frame, the price has formed a rounding bottom pattern, which is bullish.
Buy above 620 with a stop loss of 614 for the targets 626, 632, 636, 642 and 648.
The price will become bearish if it falls below the 600 zone and shows bearish strength; it can move towards the next support. In other words, the price is bullish as long as it sustains above the 600 zone.
Always do your
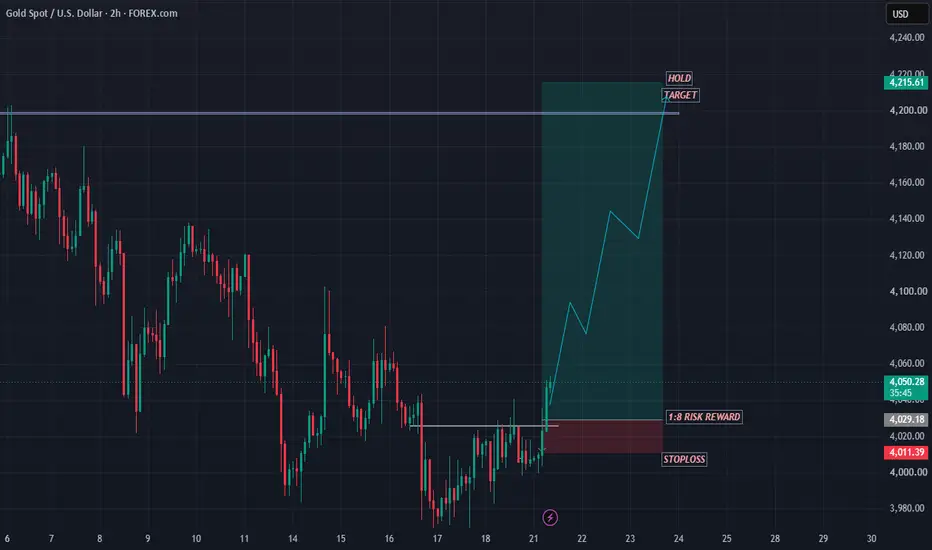
GOLD SHOWING A GOOD UP MOVE WITH 1:8 RISK REWARD GOLD SHOWING A GOOD UP MOVE WITH 1:8 RISK REWARD
DUE TO THESE REASON
A. its following a rectangle pattern that stocked the market
which preventing the market to move any one direction now it trying to break the strong resistant lable
B. after the break of this rectangle it will boost the market potential for break
C. also its resisting from a strong neckline the neckline also got weeker ald the price is ready to break in the outer region
all of these reason are indicating the same thing its r
Is Nifty weak or strong?With the renewed tension in the middle-east, and oil prices rising again, Nifty is likely to remain under pressure.
The level 24261 was crucial Nifty just touched 24266 but could not close above it.
Any weakness below 24225 may take it down to 24125 and 24050 level for a retest.
BTCUSD Rejection at Major Resistance? Short Setup Around 65000BTCUSD Analysis: Watching the 65,000–65,100 Resistance Zone
BTCUSD is approaching a key resistance area between 65,000 and 65,100, where sellers could step in and trigger a bearish rejection.
Trade Idea
Entry Zone: 65,000 – 65,100
Bias: Bearish
Stop Loss: 65,710
Target 1: 64,000
Target 2: Below 64,000 (depending on momentum)
Why this setup?
Price is testing a significant resistance zone.
A rejection here could attract fresh selling pressure.
Risk-to-reward becomes attractive if the resistanc
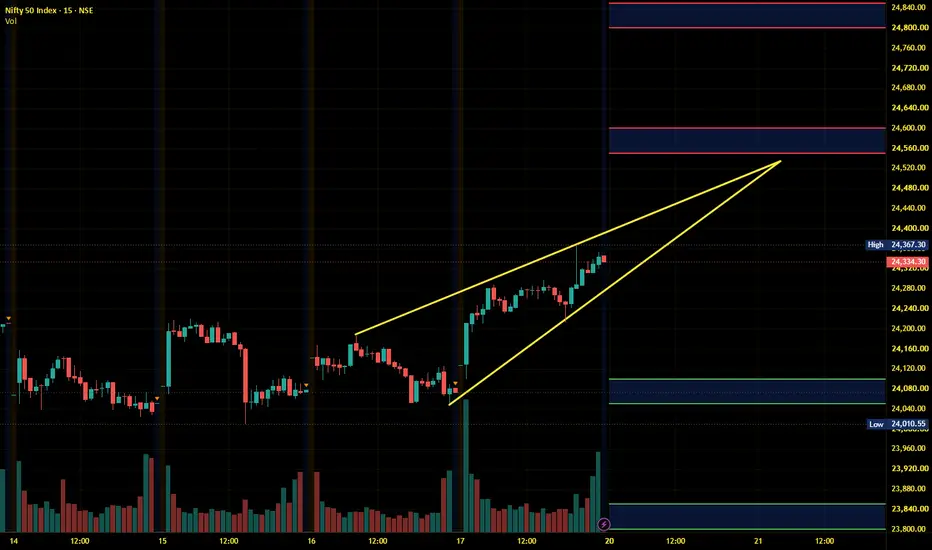
Nifty Intraday Analysis for 20th July 2026NSE:NIFTY
Volatility is expected in the index due to mixed results from banking sector stocks as well as RIL.
The upward movement may lead to 24550 – 24600 resistance range and if the index crosses and sustains above this level then may reach near 24800 – 24850 range.
On the contrary, The downward moment may drag the Index to 24100 – 24050 support range in downward momentum and if this support is broken then index may tank near 23850 – 23800 range.
Banknifty Intraday Analysis for 20th July 2026NSE:BANKNIFTY
Volatility is expected in the index due to mixed results from banking sector stocks.
The upward moment may lead the Index to 59200 – 59300 resistance range in upward momentum and if the index crosses and sustains above this level then may reach near 60000 – 60100 range.
On the contrary, The downward moment may drag the Index to 57800 – 57700 support range in downward momentum and if this support is broken then the index may tank near the 57100 – 57000 range.
Finnifty Intraday Analysis for 20th July 2026NSE:CNXFINANCE
Volatility is expected in the index due to mixed results from banking sector stocks.
The upward movement may lead the Index to 27150 - 27200 resistance range and if the index crosses and sustains above this level then may reach near 27450 - 27500 range.
On the contrary, The downward moment may drag the to 26650 – 26600 support range and if this support too is broken then index may tank near 26350 – 26300 range.
Midnifty Intraday Analysis for 20th July 2026NSE:NIFTY_MID_SELECT
Index is near resistance and if the index sustain above 14750 then -
The upward movement may lead the Index near 14875 – 14900 resistance range and if the index crosses and sustains above this level then may reach 15050 – 15075 range.
On the contrary, The downward moment may drag the index to 14575 – 14550 support range and if this support is broken then index may tank near 14400 – 14375 range.
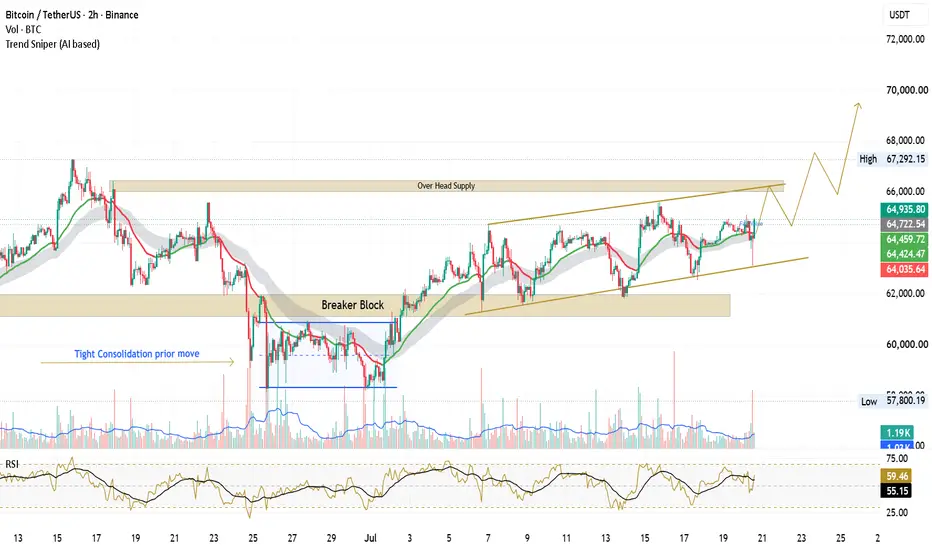
BTCUSDT: Ascending Structure Meets Major Supply Zone – Breakout BINANCE:BTCUSDT
BTCUSDT is approaching a significant overhead supply zone after maintaining a series of higher lows within an ascending structure on the 2H timeframe.
A previous breaker block has successfully acted as support, reinforcing the current bullish market structure. The recent consolidation near resistance suggests buyers are absorbing supply, but confirmation is still required before assuming a sustained breakout.
Key observations:
* Price continues to respect the ascending tren
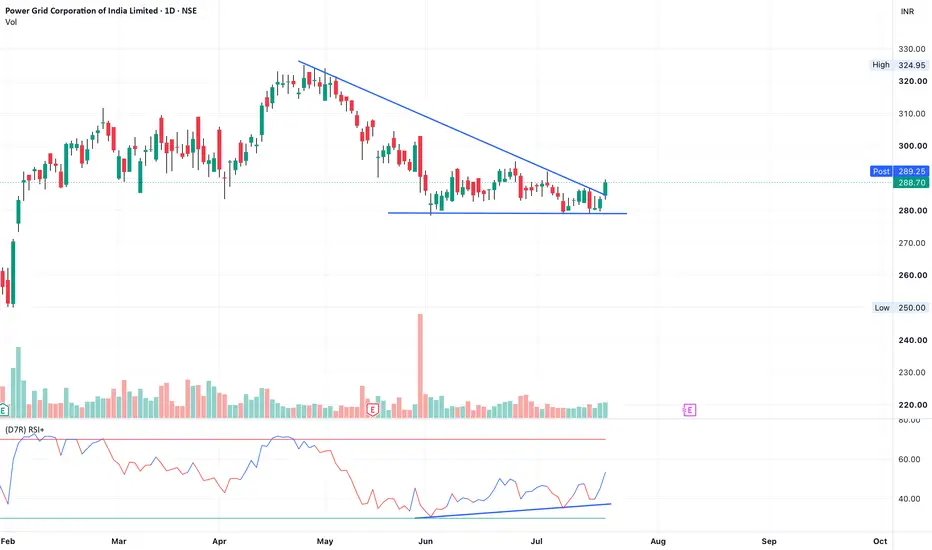
PowerGrid - RSI Bullish DivergencePowergrid has shown up move based on RSI bullish divergence. What this means is, the price was at the same level but the RSI was making higher lows. This is a long setup. Moreover, the price has broken descending triangle.
Note: I am not a registered SEBI member. Hence, please do not consider this as an investment advice. This is just for educational purposes.
TCS testing resistance with low volumesBased on TCS earnings, there was an up-move with volumes. Currently, the price is near resistance. However, the rejection volume is not high. So keep a watch on this for further up move
Note: I am not a registered SEBI member. Hence, please do not take this as an investment advice. This is just for education purposes only.
Bajaj Healthcare: Multi-Year Base Breakout SignalsNSE:BAJAJHCARE
Bajaj Healthcare Ltd. has shown a strong recovery from its long-term support zone around ₹260–280, an area that has been defended multiple times on the weekly chart.
The recent move above the previous swing high has resulted in a clear Break of Structure (BOS), indicating that the stock may be transitioning from a prolonged corrective phase into a new bullish structure.
Key observations:
• Multi-tested weekly demand zone remains intact.
• Price has reclaimed the high-volu
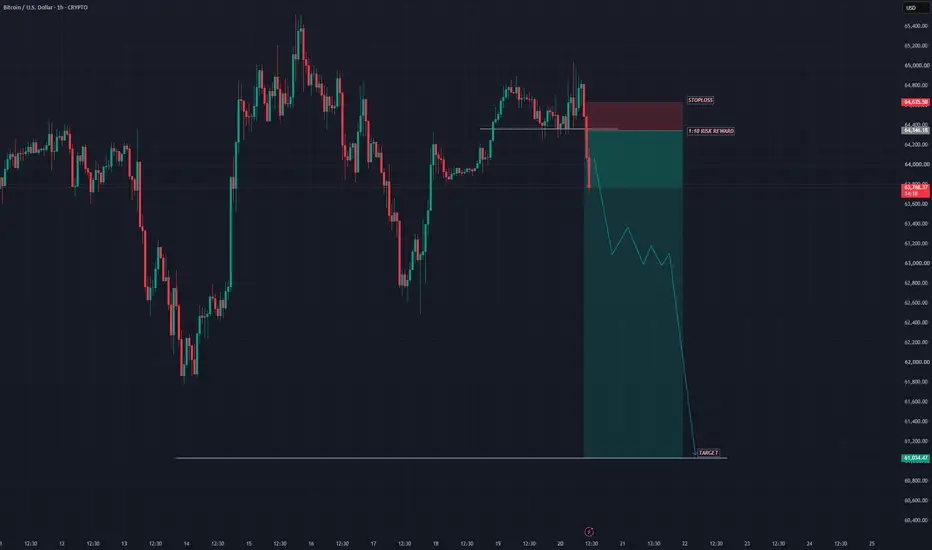
BTCUSD SHOWING A GOOD DOWN MOVE WITH 1:10 RISK REWARD BTCUSD SHOWING A GOOD DOWN MOVE WITH 1:10 RISK REWARD
DUE TO THESE REASON
A. its following a rectangle pattern that stocked the marketwhich preventing the market to move any one direction now it trying to break the strong resistant lable
B. after the break of this rectangle it will boost the market potential for breakC. also its resisting from a strong neckline the neckline also got weeker ald the price is ready to break in the outer region
all of these reason are indicating the same thing it
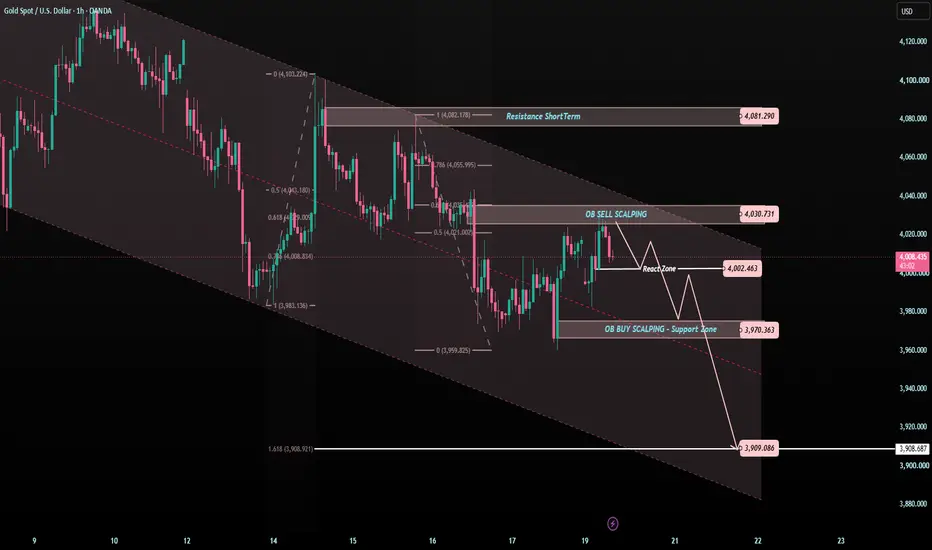
XAUUSD — 4,030 Is the Trap Zone?Gold is still moving inside the descending price channel.
Price is trading around 4,010 after reacting from the lower area, but the recovery is not clean yet.
Why?
Because gold is now moving into the first sell reaction zone, while the larger structure is still under bearish pressure.
For me, today’s chart is not about chasing the bounce.
It is about watching whether 4,030 becomes a trap for buyers.
The simple read
Gold is still cautious while price stays below 4,030.
The 4,030 area is the OB