XAUUSD GOLD ANALYSIS ON (28 SEP 2026)#XAUUSD UPDATE...!!!
Current price = 4212
BUY LIMITED - 4205-4195
If price stay above 4165 then next target 4230,4260 and 4290 and below that 4120
Plan1;If price break 4205-4195 area,and stay above 4200 we will placed buy order in gold with target of 4230,4260 and 4290 & stop loss should be placed at 4165
Support and Resistance
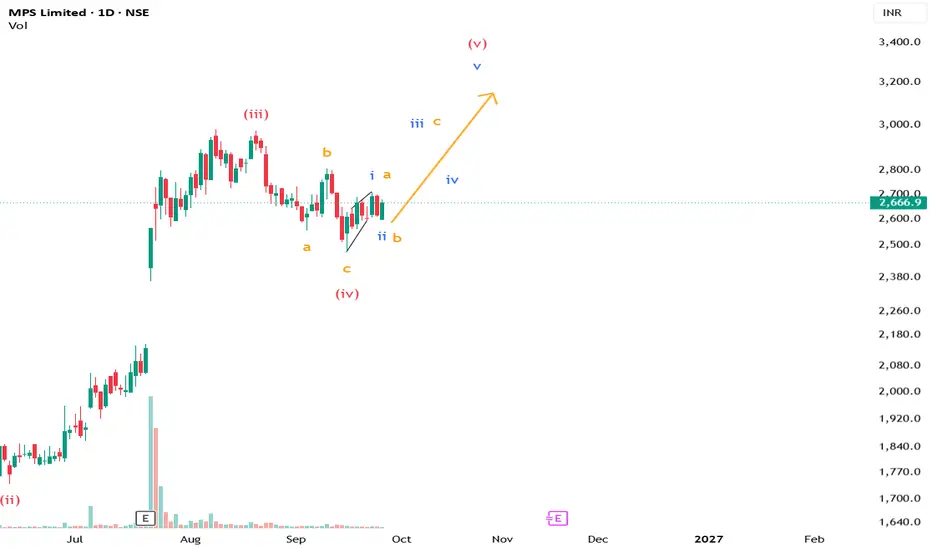
MPS – Two Counts Worth TrackingThe primary count suggests the larger Wave (iv) correction may be complete, with the next impulse developing higher. Within this move, blue Wave 1 appears to have formed as a Leading Diagonal, followed by Wave 2.
There is also an alternate orange ABC count, where the correction from the recent high is still unfolding. This would mean the current bounce may be part of Wave B, with Wave C still pending.
The next few sessions should help distinguish between the two structures.
#MPS #ElliottWave
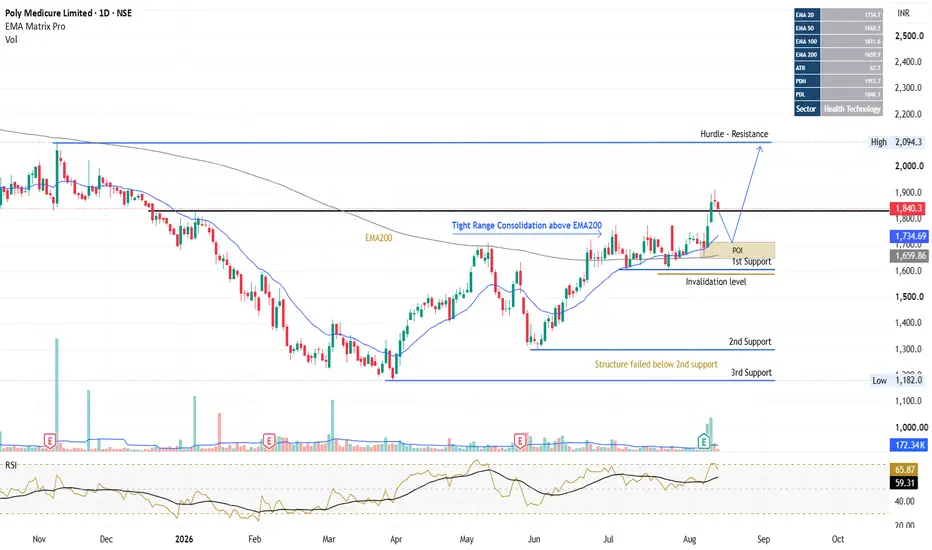
POLYMED: Structural Breakout possibleNSE:POLYMED
Breakout & Expansion: The daily chart demonstrates a clear shift from a multi-month markdown into an aggressive expansion phase. The daily candle 11Aug ₹1,863.9 (+5.16%) cleanly breaks above the local hurdle/resistance zone around ₹1,820–₹1,840.
EMA Reclaim: Price action has reclaimed the 200 EMA (₹1,659), 50 EMA (₹1,660), and 20 EMA (₹1,734), signifying a short-to-medium-term alignment flip back to bullish.
Point of Interest (POI) & Liquidity: Before this breakout candle
TCS Back at the Zone That Sparked the July RallyTata Consultancy Services is back at a familiar and important level. Back in July, we flagged the 200 Monthly EMA (₹2,087) as the key recovery target in a longer-term view — price went on to rally hard, hitting a high of ₹2,495 on July 30. Since then, TCS has reversed and fallen all the way back down, and is now trading at ₹2,082 — essentially sitting right on that same EMA zone again.
What the recent price action shows (short-term Fibonacci view):
Drawing a fresh retracement from the July low
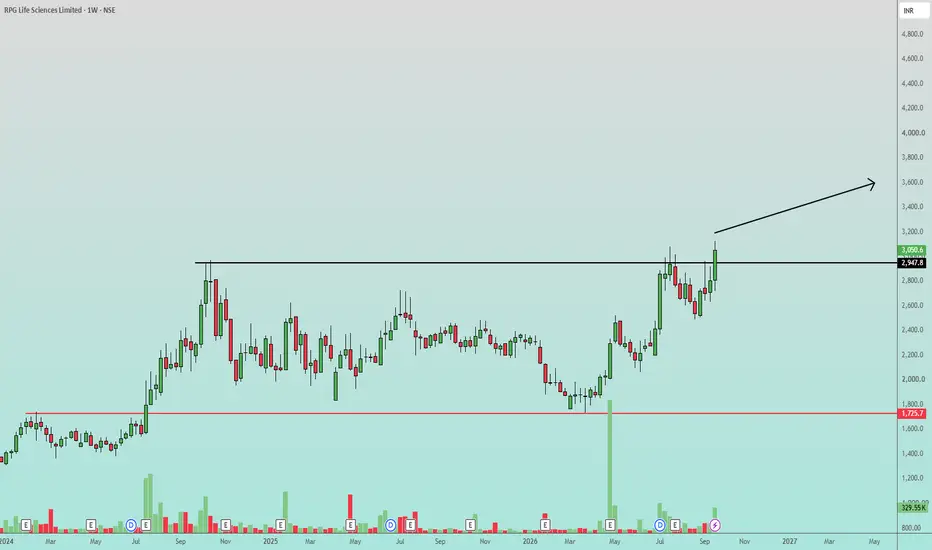
RPGLIFE Strong Weekly Breakout Above Multi-Month ResistanceTechnical Analysis & Context:
RPG Life Sciences Limited is demonstrating strong bullish momentum on the weekly timeframe. After an extended period of consolidation, the stock has successfully broken out above a critical, multi-month resistance zone near the 2947.8 level.
Looking at the broader structure, the stock built a massive base with historical support holding firm around the 1725.7 mark (indicated by the red line).
Following this accumulation phase, it tested the ~2950 resistance multip
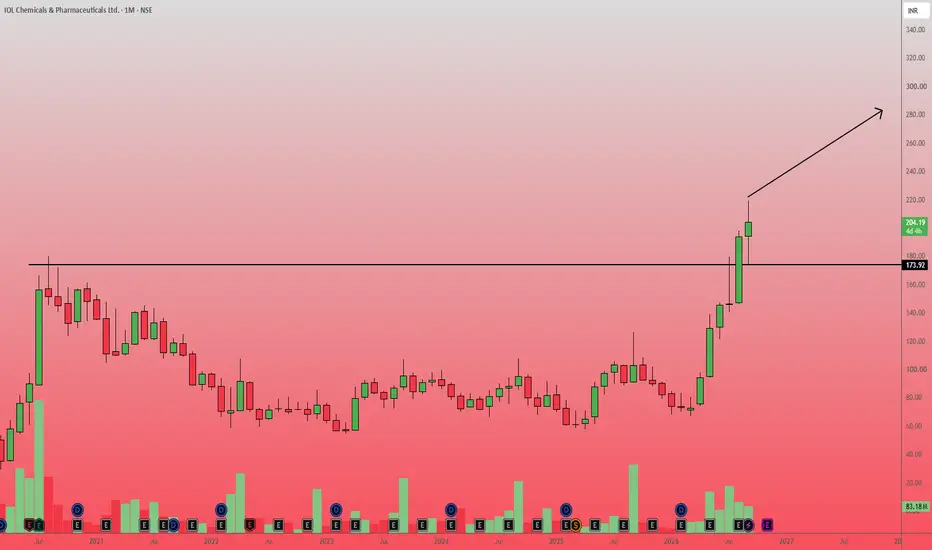
IOLCP Multi-Year Base Breakout on Monthly TimeframeTechnical Analysis & Chart Structure:
The monthly chart of IOL Chemicals & Pharmaceuticals Ltd. reveals a classic multi-year base formation and subsequent breakout.
After an extended period of consolidation spanning several years, the price has successfully breached a major horizontal resistance level marked at approximately 173.92.
This breakout is supported by strong bullish momentum, as evidenced by consecutive large green monthly candles.
Additionally, the volume profile at the bottom of
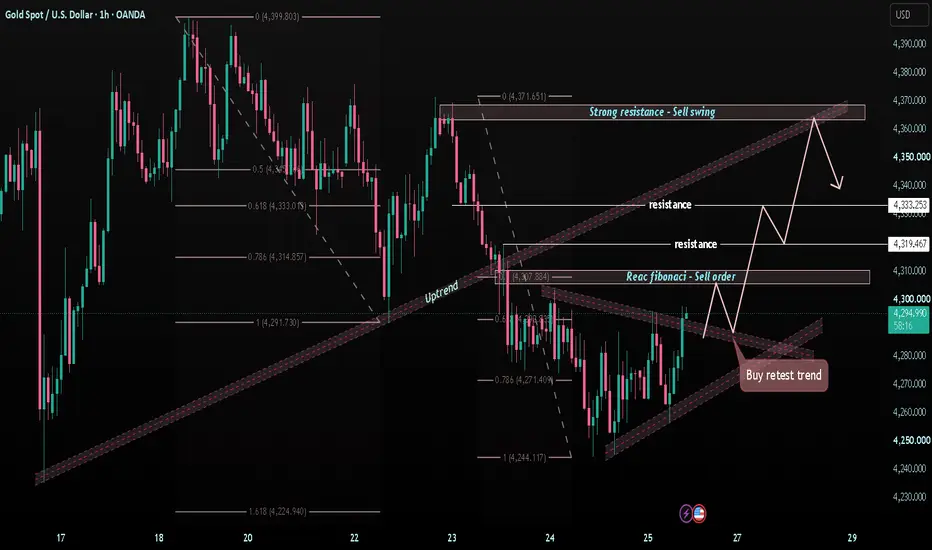
XAUUSD — 4,270 Retest Before 4,333?Gold is trading around 4,290 after recovering from the recent H1 low.
Price is compressing between short-term trend structures, while the larger recovery still needs confirmation above resistance.
Macro News
A stronger U.S. dollar and rising Treasury yields continue to pressure Gold. Markets are also pricing a higher chance of another Fed rate hike in October, keeping the higher-for-longer story in focus.
The simple read
The 4,268–4,275 area is the key retest zone.
If buyers defend this tr
SOUTHBANK Strong Breakout from Consolidation Accompanied by VolBased on the technical structure in South Indian Bank is exhibiting a classic bullish continuation setup on the weekly timeframe.
Chart Analysis: The stock has been trading within a well-defined rectangular consolidation box (roughly between the 43.50 support and 49.00 resistance levels) since early June.
The most recent weekly candle shows a decisive breakout above the upper boundary of this range, closing strongly at 49.95.
Notably, this breakout is validated by a significant surge in buyin
SEDEMAC High-Volume Breakout Above Key ResistanceThe daily chart for SEDEMAC Mechatronics Ltd. shows a strong bullish breakout.
The price decisively cleared a major horizontal resistance level at 3,305.0, closing well above it at 3,444.9.
This technical move is validated by a massive volume spike shown at the bottom of the chart, indicating high buying interest and strong momentum.
Bias: Long
Trade Plan
Entry Point: Consider a long entry near the current market price of 3,444.9, or wait for a potential pullback to retest the 3,305.0 breako
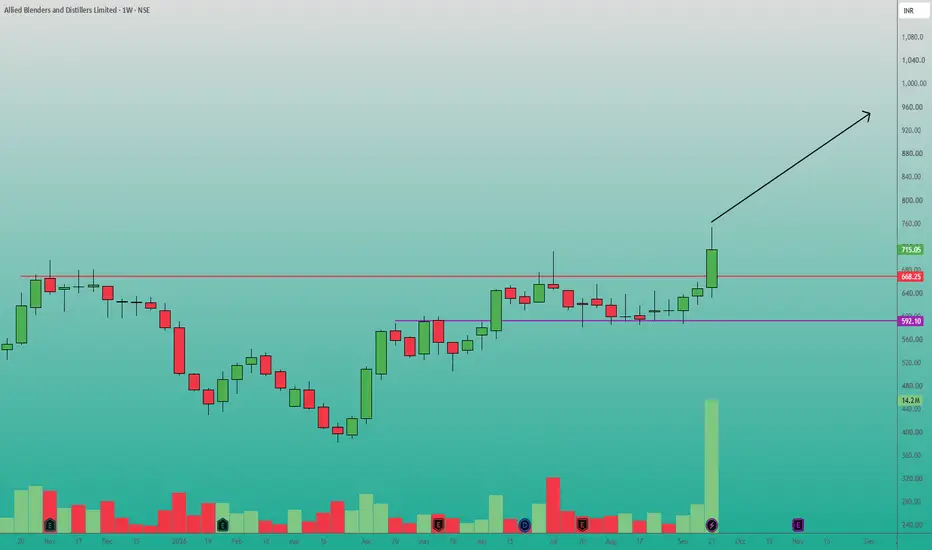
ABDL Multi-Month Resistance Breakout Supported by Massive VolumeLooking at the weekly chart of Allied Blenders and Distillers Limited, we can observe a strong bullish continuation setup.
The price has officially broken out of a multi-month consolidation phase, surging past the major resistance zone marked by the red horizontal line at 668.25.
A critical factor validating this breakout is the massive spike in buying volume accompanying the current weekly candle.
This high relative volume indicates significant institutional or market interest, suggesting th
WELSPUNLIV Strong Multi-Month Resistance BreakoutWelspun Living Limited has demonstrated strong bullish momentum, successfully breaking out above a critical multi-month horizontal resistance level at 209.05.
This breakout is significant because it follows a prolonged period of consolidation and base-building.
Crucially, the breakout is accompanied by a noticeable surge in trading volume, validating the upward move and indicating strong institutional or market-wide accumulation.
The price action suggests a structural shift in the long-term t
IREDA Testing Crucial Horizontal Support Zone at 111About the Chart:
Based on the weekly timeframe, Indian Renewable Energy Development Agency Ltd. is currently at a critical technical juncture.
After a prolonged downtrend from its highs near 310, the stock has corrected significantly and is now hovering right above a major horizontal support line drawn at 111.20.
The current price sits at 113.22, showing a tight consolidation near this floor.
Because this is a weekly chart, this 111.20 level acts as a strong make-or-break zone; a successful de
AETHER Strong Bullish Breakout from Daily Consolidation BoxTaking a look at the daily chart for Aether Industries, we can observe a classic trend continuation setup.
After a strong impulsive move upwards starting in June, the stock entered a prolonged period of sideways consolidation spanning August and September.
This price action formed a well-defined rectangular consolidation zone, with resistance resting near the 1,700 level and support holding firm around the 1,560-1,570 area.
In the most recent daily session, the stock delivered a decisive brea
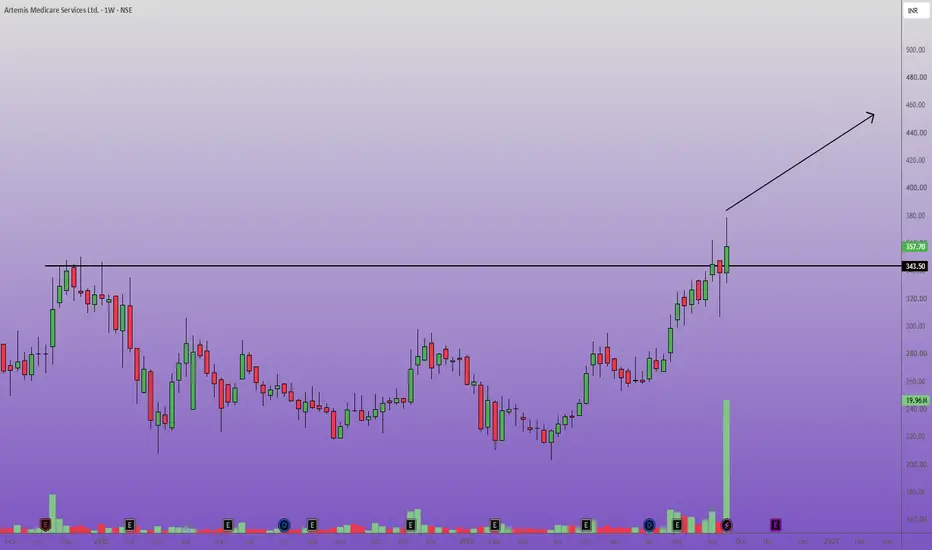
ARTEMISMED Weekly Breakout with Massive Volume SurgeArtemis Medicare Services Ltd. has formed a highly bullish technical setup on the weekly timeframe.
The stock recently broke out above a critical horizontal resistance line at the 343.50 level.
This breakout is validated by a massive, anomalous spike in trading volume, indicating strong institutional accumulation and high conviction behind the move.
Following a prolonged period of volatility and basing, this price action suggests a structural shift in momentum.
The previous heavy resistance
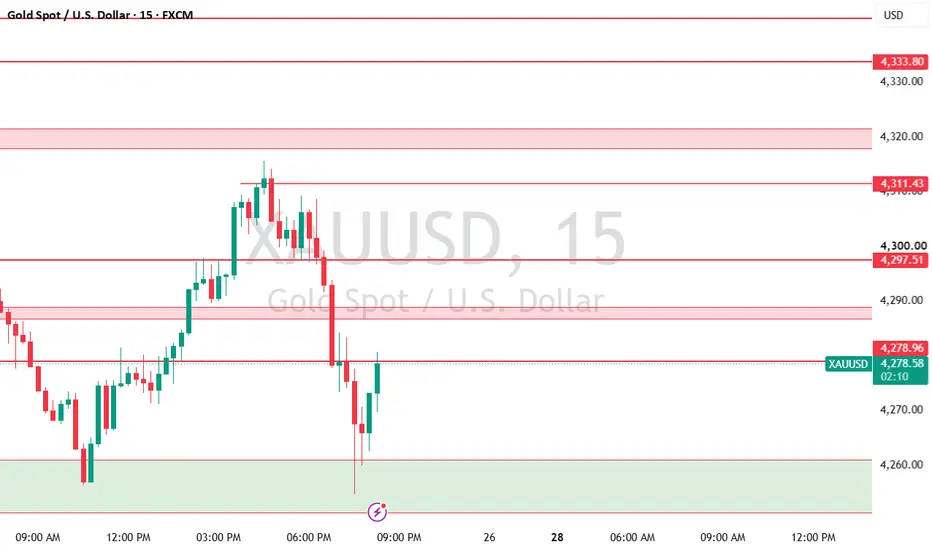
XAUUSD 15m Analysis: Crucial Demand Zone Test — BounceTraders, let's take a look at the current setup for Gold (XAUUSD) on the 15-minute timeframe.
After a sharp corrective move from the highs near the 4,311 resistance area, price action has rapidly compressed and is currently testing a major localized support zone (marked in green).
Current Market Context
Current Price: ~4,275
Immediate Structure: Short-term bearish momentum has driven the price straight into our primary demand block (4,260 - 4,275 region).
We are seeing some initial stalling
XAUUSD (Gold) Intraday Setup: Potential Relief BounceTaking a look at the 15m chart for XAUUSD, we've seen a recent dip, but the price is now stabilizing and consolidating right around the 4,263 mark. Despite the recent selling pressure, this intraday structure is starting to show signs of seller exhaustion, presenting a solid setup to catch a bounce.
If buyers step up to defend the immediate 4,250–4,260 support zone, we could see a swift relief rally. Here is the game plan for a long position:
🟢 Entry Zone: Current levels around 4,263 (Scaling
Nifty Intraday Analysis for 25th September 2026NSE:NIFTY
Index is near 23000 support level and bounce from this level is expected otherwise further downside expected.
The upward movement may lead to 23300 – 23350 resistance range and if the index crosses and sustains above this level then may reach near 23550 – 23600 range.
On the contrary, The downward moment may drag the Index to 22825 – 22775 support range in downward momentum and if this support is broken then index may tank near 22550 – 22500 range.
Banknifty Intraday Analysis for 25th September 2026NSE:BANKNIFTY
Index is near 55000 support level and bounce from this level is expected otherwise further downside expected. Reversal is expected if the index sustains above 56000 level.
The upward moment may lead the Index to 56200 – 56300 resistance range in upward momentum and if the index crosses and sustains above this level then may reach near 56900 – 57000 range.
On the contrary, The downward moment may drag the Index to 54700 – 54600 support range in downward momentum and if this sup
Finnifty Intraday Analysis for 25th September 2026NSE:CNXFINANCE
Index is near 24800 support level and bounce from this level is expected otherwise further downside expected. Reversal is expected if the index sustains above 25300 level.
The upward movement may lead the Index to 25200 - 25250 resistance range and if the index crosses and sustains above this level then may reach near 25500 - 25550 range.
On the contrary, The downward moment may drag the to 24700 – 24650 support range and if this support too is broken then index may tank n
Midnifty Intraday Analysis for 25th September 2026NSE:NIFTY_MID_SELECT
Index is near 14000 support level and bounce from this level is expected otherwise further downside expected.
The upward movement may lead the Index near 14200 – 14225 resistance range and if the index crosses and sustains above this level then may reach 14375 – 14400 range.
On the contrary, The downward moment may drag the index to 13875 – 14850 support range and if this support is broken then index may tank near 13700 – 13675 range.
XAUUSD — 4,314 Retest or 4,239 Sweep?Gold is trading around 4,286 after breaking below the H1 rising trendline.
The short-term structure remains weak while price stays below the previous breakout area.
Macro News
Gold remains pressured by expectations of further Fed tightening after strong U.S. business activity reinforced inflation concerns. Oil is easing as Iran signals openness to diplomacy, helping limit some pressure, but higher-for-longer rate expectations remain the main headwind.
The simple read
4,310–4,318 is now the
ANTELOPUS Strong Weekly Breakout and Support RetestIn this idea, we are analyzing a high-probability bullish setup for Antelopus Selan Energy Ltd on the weekly timeframe.
Technical Analysis:
Major Resistance Breakout: The chart demonstrates a decisive breakout above a critical horizontal resistance level at 1,033.7.
This structural ceiling previously contained the price action, making this upward breach highly significant.
Volume Confirmation: The breakout was propelled by a massive surge in buying volume, easily identifiable by the exceptio
NRAIL Multi-Year Resistance Breakout on Monthly TimeframeChart Analysis:
The 1-month chart for NR Agarwal Industries Ltd. reveals a significant structural breakout.
The price has decisively cleared a major multi-year resistance zone, specifically the 589.00 level, which marks the previous highs from 2018.
This breakout is accompanied by a massive bullish monthly candle and a notable surge in trading volume, indicating strong buying conviction and institutional participation.
Furthermore, the prior swing resistance at 534.85 was also comfortably bre