Education

NHCFOODS: Consolidating at Macro Support Aft Volatile CorrectionOverview :
NHC Foods Limited (BSE: 517554) is currently navigating a period of consolidation on the daily (1D) timeframe. After peaking at a 52-week high of ₹1.35, the stock has experienced significant volatility and corrective pressure, now trading near the ₹1.06 level. The company, a nano-cap entity in the FMCG sector, has recently seen a notable expansion in its equity base following FCCB conversions, which continues to influence market sentiment.
Trend Direction (Moving Averages) :
MA Ribbon/EMA Analysis : The stock is currently trading in a tight range relative to its short-term moving averages. With the 5-day, 10-day, 20-day, and 50-day SMAs all clustered near the ₹1.10 level, the price is currently suppressed by this overhead resistance. However, it maintains a position slightly above its 200-day SMA (approx. ₹1.00), suggesting that the long-term bullish trend remains precariously intact.
Momentum Indicators :
RSI (Relative Strength Index) : The RSI(14) is currently in the 42–44 range. This indicates a neutral to slightly bearish momentum. It is neither overbought nor oversold, suggesting a lack of decisive trend-driving volume.
MACD : The MACD line remains below its signal line and the zero line, which is traditionally viewed as a bearish signal, reflecting the lack of upward momentum seen over the past month.
Fibonacci : The stock is testing levels that align with recent structural support. A breakdown below the ₹1.00 psychological floor would likely signal a retest of the 52-week low near ₹0.59.
Key Levels to Watch :
Resistance : The immediate hurdle is the ₹1.10–₹1.11 zone (the cluster of short-term moving averages and the recent high). A volume-backed breakout above ₹1.15 is required to shift the bias to bullish.
Support : The primary support zone sits at ₹1.00–₹1.05. If the price fails to hold the ₹1.00 level, the stock may enter a deeper retracement phase.
Directional Bias: NEUTRAL / CAUTIOUS
The stock is in a "wait-and-see" phase. Until NHCFOODS can decisively clear the ₹1.11 resistance with significant trading volume, the risk of sideways consolidation or a drift toward support remains higher than the probability of an impulsive breakout.
Disclaimer : This analysis is for educational purposes only and does not constitute financial advice. Nano-cap stocks like NHC Foods carry high volatility and liquidity risks; please manage your position sizing accordingly.  Long
Long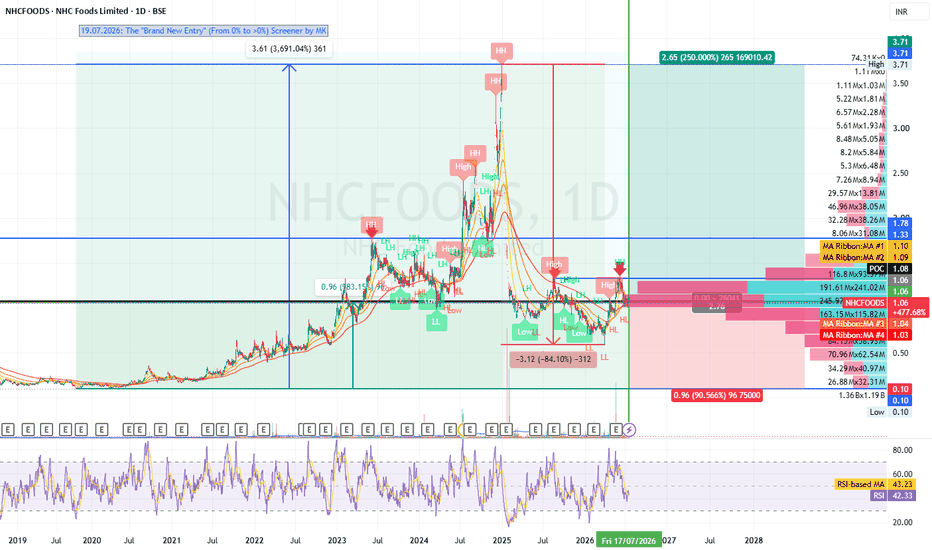
 Long
Long
XAUUSD — Bearish Continuation Toward Fibonacci Target
Fundamental Analysis
Gold remains sensitive to USD momentum, Treasury yields, and upcoming U.S. macro data. For next week, the technical bias still leans bearish while price stays below the major descending structure.
Technical Analysis
On the 4H chart, XAUUSD is trading around 4,017 after losing momentum under the downtrend trendline. The nearest sell reaction zone is around 4,050 - 4,070, where price may retest the Fibonacci sell area before another downside move. If this zone rejects price, sellers may continue to push gold toward the lower Fibonacci psychological target around 3,755. A stronger recovery toward 4,203 or 4,300 - 4,384 would only be a deeper bearish retest unless price breaks the major downtrend.
Important Key Levels
Current price: 4,017
Nearest sell zone: 4,050 - 4,070
Strong resistance: 4,203
Fibonacci liquidity zone: 4,290 - 4,310
Major Fibonacci sell zone: 4,380 - 4,384
Main downside target: 3,755 - 3,740
Invalidation: above 4,203
Trading Scenario
Main Sell Setup
Entry: 4,050 - 4,070
Stop Loss: 4,203
Take Profit 1: 3,950
Take Profit 2: 3,850
Take Profit 3: 3,755 - 3,740
Sell Condition
Wait for gold to recover into the 4,050 - 4,070 Fibonacci sell zone and show bearish rejection. A failed reclaim, long upper wick, bearish engulfing candle, or close back below the zone would confirm seller pressure. If price breaks below the recent low, the bearish continuation setup becomes stronger. If gold breaks and holds above 4,203, this sell setup should be invalidated.
Overall View
The main view for next week remains bearish while XAUUSD trades below the downtrend structure. A short-term recovery can happen, but the preferred plan is to wait for price to retest the Fibonacci sell zone before looking for continuation toward the 3,755 - 3,740 target area.
Do you share the same bearish view on gold for next week, or are you waiting for a deeper retest near 4,203 first?
 Short
Short
Risk Management Determines Long-Term SuccessEvery trader dreams of finding the perfect strategy.
Some spend years searching for the best indicator.
Others constantly switch between chart patterns, timeframes, or trading systems, believing the next one will finally unlock consistent profits.
Yet many of these traders continue to lose money.
Not because their analysis is poor.
But because they ignore the one skill that matters more than any entry signal:
Risk management.
In trading, success isn't determined by how much you make on your best trade.
It's determined by how well you protect yourself during your worst ones.
Every Trader Will Experience Losses
One of the biggest misconceptions in trading is the belief that successful traders rarely lose.
The reality is very different.
Even the most experienced professionals have losing trades, losing weeks, and sometimes even losing months.
The difference is not that they avoid losses.
The difference is that they control them.
They understand that losses are a normal part of a probability-based business.
Instead of trying to eliminate risk, they focus on managing it.
Capital Is Your Greatest Asset
Without capital, there is no trading.
Every opportunity in the market requires one thing:
The ability to participate.
A trader who loses half of their account doesn't just lose money.
They lose flexibility, confidence, and future opportunities.
Recovering from large losses is far more difficult than most people realize.
A 50% loss requires a 100% gain just to return to break-even.
That is why protecting capital should always come before chasing profits.
Small Losses Keep You in the Game
Many beginners view losing trades as failures.
Professional traders see them as operating costs.
Every business has expenses.
For a trader, controlled losses are simply part of doing business.
The goal is not to avoid every losing trade.
The goal is to ensure that no single trade causes significant damage.
A series of small losses is manageable.
One uncontrolled loss can erase months of steady progress.
Position Size Matters More Than Confidence
Confidence can be dangerous.
A trader may believe they have found the perfect setup and decide to risk a large portion of their account.
But the market doesn't reward confidence.
It rewards discipline.
Professional traders often risk only a small percentage of their capital on any single trade.
This approach allows them to survive unexpected events and continue trading with a clear mind.
Long-term consistency comes from controlled position sizing, not oversized bets.
Winning Isn't Everything
Many traders judge themselves by their win rate.
But winning frequently does not automatically lead to profitability.
Imagine two traders.
One wins 80% of their trades but allows losses to become much larger than gains.
Another wins only half of the time but keeps losses small and lets profitable trades grow.
Over hundreds of trades, the second trader may produce much stronger results.
Long-term success depends on the relationship between risk and reward, not simply how often you are right.
Risk Management Supports Emotional Control
Large financial risk creates emotional pressure.
Fear encourages traders to exit winning trades too early.
Hope convinces them to hold losing positions for too long.
Greed tempts them to increase position size after a few successful trades.
When risk is controlled, emotions become easier to manage.
Smaller exposure allows traders to follow their plans instead of reacting impulsively.
Discipline becomes far easier when survival is never threatened by a single decision.
Think in Years, Not Trades
The market will always provide another opportunity.
Missing one trade is rarely important.
Protecting your ability to take the next hundred trades is.
Professional traders measure success over hundreds of trades, not individual outcomes.
They understand that consistency compounds over time.
One exceptional trade rarely builds a successful trading career.
Thousands of disciplined decisions do.
Final words:words:
Every trader wants better entries, stronger trends, and higher profits.
But none of those matter if poor risk management removes you from the market.
Long-term success belongs to traders who protect their capital, accept uncertainty, and remain disciplined through both winning and losing periods.
Strategies may change.
Markets may evolve.
Volatility may increase or decrease.
But one principle remains constant:
The traders who survive the longest are usually the ones who manage risk the best.
Because in trading, longevity is not an accident.
It is the direct result of disciplined risk management.
 Education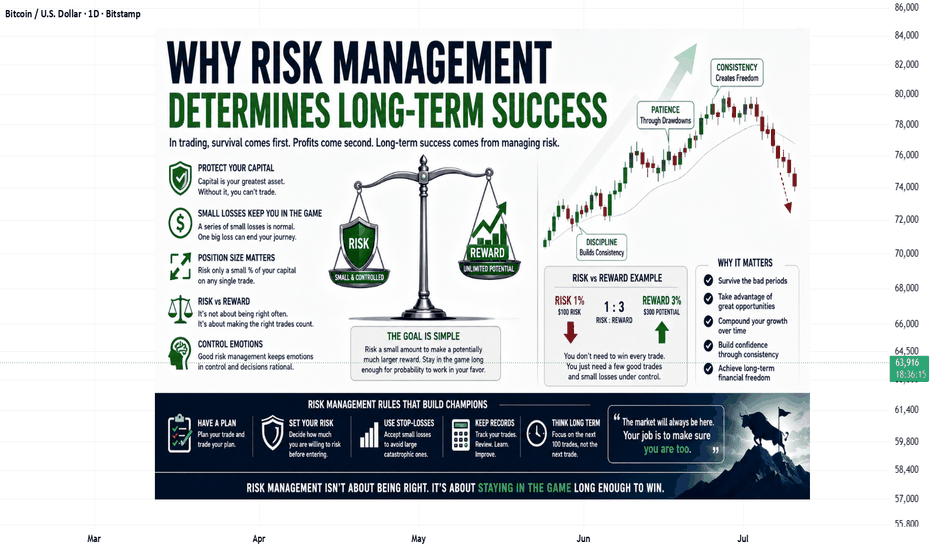
XAUUSD – Bearish Continuation Toward Fibonacci TargetXAUUSD is trading around 3,990 after failing to recover above the short-term downtrend structure. Price remains below the previous support area, and the current reaction still looks like a weak correction inside the bearish trend.
The priority view remains sell with the trend, especially if gold retests the 4,020–4,040 reaction zone and fails to break above the psychological sell order area.
Technical View
Gold is still moving under bearish pressure after the strong breakdown from the previous consolidation zone. The market failed to hold above the old support, and price is now trading below the short-term downtrend trendline.
The 4,020 area is the first reaction zone to watch. This level was marked on the chart as an important area for price reaction. If gold pulls back into this zone and shows rejection, it may confirm that buyers are still weak.
The 4,035–4,040 area is the main psychological sell order zone. This zone is important because it aligns with the Fibonacci reaction area and the previous breakdown structure. If price reaches this area and fails to continue higher, it may confirm another lower high before the next bearish leg.
The 3,969 support is the nearest downside level. If gold breaks below this area, the bearish structure may continue toward the Fibonacci 1.618 target around 3,945–3,950.
The main idea is simple: as long as gold stays below 4,020–4,040, the market remains under selling pressure, and recovery attempts should be treated as corrective.
Key Zones
Current price: 3,990
Price reaction zone: 4,020–4,025
Psychological sell order zone: 4,035–4,040
Downtrend resistance: 4,000–4,020
Nearest support: 3,969
Fibonacci 1.618 target: 3,945–3,950
Invalidation: above 4,045
Trading Plan
Sell Priority: 4,020–4,040
Condition: wait for bearish rejection, failed recovery above the downtrend trendline, or price staying below the psychological sell order zone.
SL: above 4,045
TP1: 3,969
TP2: 3,945–3,950
TP3: 3,920–3,930
Alternative Scenario
If gold breaks below 3,969 directly, wait for a retest of this level as resistance before looking for sell continuation toward the Fibonacci 1.618 target around 3,945–3,950.
Buy View
Buy is not the priority while price remains below the downtrend trendline and below the 4,020–4,040 resistance area. A short-term buy reaction may appear near 3,945–3,950, but it needs clear bullish confirmation first.
Final View
Overall, gold remains in a bearish continuation structure. The cleaner plan is to wait for price to retest the 4,020–4,040 sell zone and watch for rejection. As long as this area holds as resistance, the downside path toward 3,969 and the Fibonacci target around 3,945 remains in focus.
Will gold reject from the psychological sell zone first, or break below 3,969 directly toward the Fibonacci target?
Short 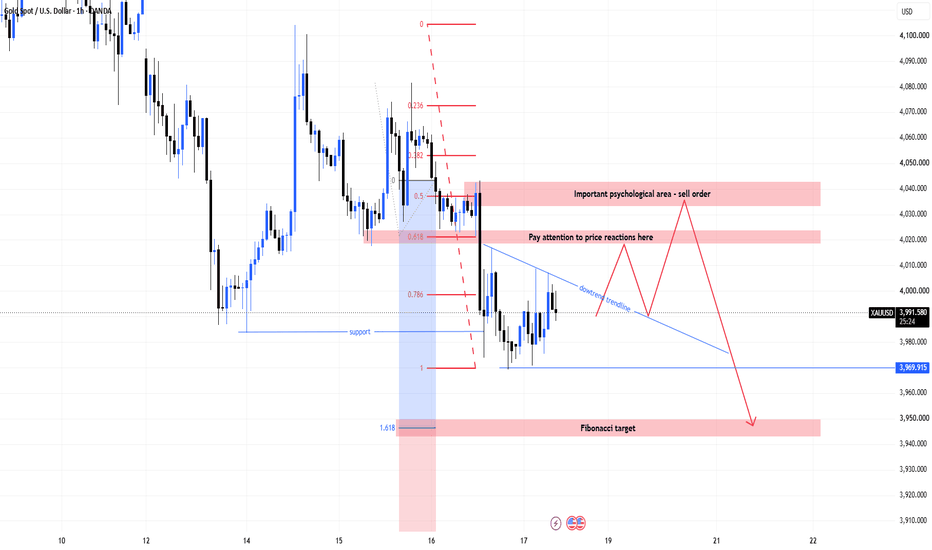
XAUUSD — Key Entry Zones Around OB and FVG
Gold is trading around $3,998 after recovering slightly from the lower Buy zone OB around $3,980–$3,985. The short-term reaction shows that buyers are trying to defend this demand area, but the overall structure is still not fully bullish because price remains below the upper OB and FVG supply zones.
From an SMC perspective, gold recently created bearish BOS and continued to trade below the previous structure. The current bounce from the lower OB looks more like a reaction from liquidity rather than a confirmed bullish reversal. This means the buy zone can be used for short-term reaction, but the stronger decision areas are still above, especially around $4,038–$4,041 and the FVG zone near $4,051–$4,058.
The main plan is to wait for price to react clearly around the marked zones. Buying near the lower OB is only valid with confirmation, while selling near the upper OB or FVG remains the cleaner setup if sellers defend those areas.
Buy scalping setup
Condition:
Gold holds the Buy zone OB around $3,980–$3,985 and forms bullish rejection with lower timeframe MSS / CHOCH.
Entry: $3,980–$3,985
SL: below $3,970
TP1: $4,000
TP2: $4,020
TP3: $4,038–$4,041
Sell setup 1
Condition:
Gold recovers into the OB sell zone around $4,038–$4,041 and forms bearish rejection.
Entry: $4,038–$4,041
SL: above $4,058
TP1: $4,020
TP2: $4,000
TP3: $3,980–$3,985
Sell setup 2
Condition:
If gold pushes higher into the FVG zone around $4,051–$4,058 and fails to break above it, this can create a stronger sell setup.
Entry: $4,051–$4,058 after rejection
SL: above $4,075
TP1: $4,038–$4,041
TP2: $4,000
TP3: $3,980–$3,985
TP4: $3,960
Sell setup 3
Condition:
If gold breaks cleanly below the Buy zone OB and retests it as resistance, bearish continuation becomes active.
Entry: below $3,980 after breakdown retest
SL: above $4,000
TP1: $3,970
TP2: $3,960
TP3: $3,942
Key levels
Current price area: $3,998
Buy zone OB: $3,980–$3,985
Short-term reaction area: $4,000–$4,020
OB sell zone: $4,038–$4,041
FVG sell zone: $4,051–$4,058
Bearish continuation level: below $3,980
Lower target: $3,960
Major lower liquidity: $3,942
Bullish scalp confirmation: clean reaction above $3,985
Sell confirmation: bearish rejection from $4,038–$4,058
Bearish invalidation: clean 2H close above $4,075
My current view is that gold can react from the lower Buy zone OB, but the main structure is still fragile. The Prime Gold plan is to avoid entering in the middle and only look for trades around the marked zones: short-term buy from $3,980–$3,985 if confirmed, or sell from $4,038–$4,041 and $4,051–$4,058 if sellers reject strongly. If gold loses $3,980 cleanly, the bearish path toward $3,960 and $3,942 becomes active again.
No confirmation, no trade.
Long 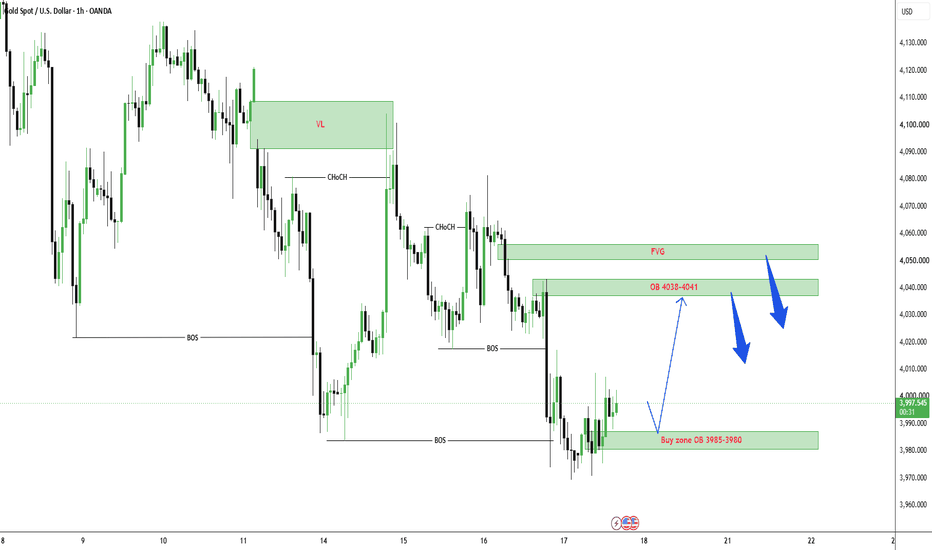
XAUUSD — Strong Support Tested, Recovery Setup
Fundamental Analysis
Gold remains sensitive to USD momentum, Treasury yields, and upcoming U.S. macro data. For now, short-term price action shows a possible technical recovery as buyers continue to defend the same support zone.
Technical Analysis
On the 1H chart, XAUUSD is trading around 3,995 after testing the strong support area near 3,960 - 3,970 multiple times. This repeated reaction shows that sellers are losing some pressure at the low. The first buy zone is around 3,983 - 3,987. If price holds this zone, gold may correct higher toward the liquidity level at 4,017, then the sell FVG area around 4,050 - 4,055. A stronger recovery may target the VL zone around 4,095 - 4,105.
Important Key Levels
Current price: 3,995
Strong support: 3,960 - 3,970
Main buy zone: 3,983 - 3,987
Liquidity level: 4,017
Sell FVG zone: 4,050 - 4,055
Main recovery target: 4,095 - 4,105
Invalidation: below 3,960
Trading Scenario
Main Buy Setup
Entry: 3,983 - 3,987
Stop Loss: 3,960
Take Profit 1: 4,017
Take Profit 2: 4,050 - 4,055
Take Profit 3: 4,095 - 4,105
Buy Condition
Wait for gold to hold the 3,983 - 3,987 buy zone and show bullish rejection. A clean reaction above this zone keeps the recovery setup valid. If price breaks above 4,017, the corrective move may extend toward 4,050 - 4,055. If price breaks and holds below 3,960, the buy setup is invalid.
Overall View
XAUUSD is still under broader downtrend pressure, but the repeated test of strong support suggests a possible short-term correction. The preferred plan is to wait for confirmation around 3,983 - 3,987, then look for recovery toward 4,017, 4,055, and 4,095 - 4,105.
Do you think gold can recover from this strong support zone, or will sellers break it on the next test?
Long 
NIFTY50 - Breakout Could Trigger the Next Rally upto 24400+Nifty is currently consolidating inside a rising support and falling resistance structure, indicating that the index is gradually building momentum for a potential breakout. Over the past few sessions, buyers have consistently defended the rising support trendline, while sellers have repeatedly rejected prices near the descending resistance. This tightening price action suggests that a decisive move may be approaching.
The chart also highlights multiple failed attempts by bears to push the index below support. Each pullback has resulted in a higher low, reflecting improving buying interest. As price compresses closer to the resistance trendline, the probability of a breakout increases if bullish momentum continues.
Bullish Outlook
A sustained move above the 24,160–24,200 resistance zone would confirm the breakout and could trigger a sharp upside rally. Based on the height of the current consolidation pattern, the projected move points toward 24,250 as the first target, followed by 24,400+ if buying momentum remains strong.
Technical Highlights
✅ Rising support continues to hold, indicating strong buyer participation.
✅ Multiple higher lows suggest accumulation rather than distribution.
✅ Price is compressing below resistance, often a precursor to an impulsive move.
✅ Pattern projection indicates a strong upside expansion after breakout confirmation.
Key Levels
Immediate Resistance: 24,160–24,200
Target 1: 24,250+
Target 2: 24,400+
Support Zone: 24,020–24,050
Nifty is approaching a crucial breakout zone. If bulls manage to push the index above the descending resistance with strong volume, the current consolidation could transform into a strong bullish impulse, opening the path toward 24,250 and eventually 24,400+ in the coming sessions. Long 
#NIFTY Intraday Support and Resistance Levels - 17/07/2026Nifty is expected to witness a flat opening with no significant change from yesterday's closing levels. The index is trading near the crucial 24050 support zone, making the initial one hour important for confirming the intraday trend. Traders should wait for a decisive breakout or breakdown before taking aggressive positions.
The immediate support is placed around 24050–24100. If Nifty holds above this zone and sustains buying momentum, traders can consider long positions with targets of 24150, 24200, and 24250. A sustained move above 24250 will further strengthen the bullish momentum and may trigger fresh upside buying.
On the downside, if Nifty fails to hold the psychological 24000 level, fresh selling pressure may emerge. Traders can consider short positions only below 24000, with downside targets of 23850, 23800, and 23750. As long as 24000 remains intact, avoid aggressive bearish positions since buyers may continue defending the support zone.
Overall, a flat opening is expected. The broader intraday bias remains positive while Nifty trades above 24050–24000. Traders should focus on buying near support with confirmation, while fresh short positions should only be considered after a confirmed breakdown below 24000. Maintain strict stop-losses and book profits gradually at the mentioned target levels. #BANKNIFTY Intraday PE & CE Levels(17/07/2026)Bank Nifty is expected to witness a flat opening with no major changes from yesterday's closing levels. The index continues to trade near the crucial 57550–57600 support zone, making this level important for today's intraday direction. Traders should avoid aggressive positions at the opening and wait for confirmation before initiating fresh trades.
The immediate support is placed at 57550–57600. If Bank Nifty sustains above this zone and attracts buying interest, traders can consider CE positions with targets of 57750, 57850, and 57950. A decisive breakout above 58050 will confirm stronger bullish momentum and may extend the rally towards 58250, 58350, and 58450.
On the downside, if Bank Nifty slips below 57950–57900 and faces rejection from higher levels, traders can consider PE positions with targets of 57750, 57650, and 57550. A sustained breakdown below 57450 will strengthen the bearish trend and may push the index towards 57250, 57150, and 57050.
Overall, a flat opening with no major changes from yesterday's levels is expected. As long as Bank Nifty holds above the 57550 support zone, buying on dips remains the preferred strategy. Fresh short positions should only be considered after a confirmed breakdown below 57450 or a rejection from the 57950–58000 resistance zone, with strict stop-losses and disciplined profit booking at each target level. Nifty 50 Trade Plan [17.06.2026: Friday]Probable Scenario Analysis and Trade Plan for the Nifty 50 Index NSE:NIFTY for the 17th of July, 2026. The day is Friday.
🟢 Bullish Scenario
There is no bullish setup observable in the present price action. Doubt every upmove. A strong resistance zone (SRZ) is formed at (24250 - 24150). It will be difficult for the price to break out above the SRZ. However, if the price sustains above 24250, then the probable bullish targets would be - 24300, 24350, and 24400.
🔴 Bearish Scenario
Presently, the price is in the bearish zone. However, in the past few days, the price action has formed a strong support zone (SSZ) at (24050 - 23950). An effective bearish trade is only possible if the price decisively breaks down below the SSZ. The probable bearish targets below the level of 23950 would be - 23900, 23850, 23800, and 23750.
🟡 No Trading Zone (NTZ): (24250 - 2950).
⏺ Range of Consolidation (ROC): (24250 - 24000).
Here, 24125 is the median of the ROC. The median works like an intraday sentiment evaluator. The price trading above the median would offer bullish sentiment, while the price trading below the median would trigger bearish sentiment within the ROC.
● Event
No high-impact event this week. No holidays this week. It is the last day of the week. Lastly, geopolitical issues are omnipresent.
● Intraday Bias
Establish intraday bias with respect to the opening price. If the price sustains above the opening price, then don't think of shorting. Look for bullish trades only. On the contrary, if the price sustains below the opening price, then don't think of going long. Look for bearish trades in that case.
● Disclaimer + End Note
- All the analyses would fail in the case of a major gap up, gap down, or price structure anomaly. Thus, practice PRAGMATISM in the live session.
- Trade only if there is a set-up. Remember, not trading is an extension of the trading activity.
- Mark your points. Trade your points. Price is GOD. Anything can happen in the markets. Thus, trade what you see, not what you believe.
- Always PRACTICE RISK MANAGEMENT. Always PROTECT YOUR CAPITAL. Be RESPONSIBLE.
- Be Strategic. Be Courageous. Be Patient. Be Wise.
- Every day is a new day. Thus, do not carry the baggage of past successes or failures. Leave the gardens of winning and losing. Establish yourself in equanimity. Always think from a new perspective.
- Let the joy of trading drive your effectiveness, not greed or fear. Believe in Possibilities.
Happy Trading! BTC Long Setup: High-Probability Dip Buy OpportunityBitcoin is showing signs of strength around the 65,000 support zone, making this an attractive area for a potential long entry.
Trade Plan:
Entry: Around 65,000
Add on Dip: 64,600
Stop Loss: 64,200
Target 1: 65,800–66,000
Target 2: 67,000
Target: Open beyond 67K if bullish momentum continues.
The 65K region is acting as a key support, and as long as price holds above the stop-loss level, the risk-to-reward remains favorable. Watch for increasing volume and bullish confirmation before adding aggressively.
Risk Management: Always manage your position size and stick to your stop-loss. This is a trade setup, not financial advice.
📌 Disclaimer:
This analysis is for educational purposes only and is not financial advice. Always manage risk and follow your trading plan.
Your feedback drives our content and keeps everyone trading smarter. Let’s make those pips together! 🚀
Happy Trading,
– The InvestPro Team Long 
SRF Ascending Triangle Breakout (Possible)________________________________________
📊 SRF: Daily Technical Snapshot – Ascending Triangle Breakout (Possible)
📊 STWP Technical Analysis
________________________________________
MARKET STRUCTURE SNAPSHOT | NSE: SRF | DAILY
Closing Price: ₹2,889.30 (+₹113.70 | +4.10%)
Core Trend: Strong Uptrend
Market State: Confirmed Breakout in Progress
Price Structure: Price has broken above an Ascending Triangle, supported by a strong bullish candle and exceptionally high trading volume. The breakout reflects increasing buying pressure following a period of consolidation.
________________________________________
OPERATIONAL PRICE GRID & KEY REFERENCE LEVELS
Model Reference Level: ₹2,916.00
Hard Invalidation Level: ₹2,606.80
Structural Risk: ₹309.20 (10.60%)
Resistance Levels: R1 ₹2,944.50 | R2 ₹2,999.70 | R3 ₹3,083.40
Support Levels: S1 ₹2,805.60 | S2 ₹2,721.90 | S3 ₹2,666.70
Range Structure: Low ₹2,606.80 | High ₹3,083.40
Higher Timeframe Observation Zones: ₹3,000 | ₹3,083 | ₹3,150
________________________________________
MOMENTUM, PARTICIPATION & CPR DATA
Volume Profile: 1.53 Million Shares
Volume Character: Extremely High Relative Participation
RSI: 63.62 (Strong Momentum Zone)
ADX: 10.48 (Early Trend Development)
ROC: +3.21%
MACD Status: Fresh Bullish Crossover
CCI: +198.29 (Strong Bullish Momentum)
Stochastic Reading: 90.01 (Extended Momentum Zone)
Current Bias: BUY ON PULLBACKS
CPR State: Bullish Zone | CPR Moving Up (Narrow)
Today's CPR: Pivot ₹2,777.55 | Top ₹2,776.55 | Base ₹2,778.50
Tomorrow's CPR (Projected): Pivot ₹2,860.80 | Top ₹2,875.05 | Base ₹2,846.55
________________________________________
📚 EDUCATIONAL OBSERVATION
SRF has confirmed a breakout from an Ascending Triangle, a bullish continuation pattern that often develops during an established uptrend. The pattern is characterised by a series of higher lows, indicating increasing buyer aggression, while repeated tests of a relatively flat resistance level gradually absorb selling pressure. The eventual breakout above resistance suggests that buyers have gained control and that the prior uptrend may be ready to resume.
The latest breakout is supported by a strong bullish candle, exceptionally high trading volume and expanding momentum, reflecting broad market participation. Increased volume during a triangle breakout generally strengthens the reliability of the move, as it indicates that the breakout is supported by genuine buying interest rather than low-volume price fluctuations.
Momentum indicators continue to remain constructive. The RSI at 63.62 reflects healthy bullish momentum without reaching extreme overbought territory. MACD has generated a fresh bullish crossover, signalling improving trend strength, while the ROC of +3.21% indicates continued upside acceleration. The CCI reading of +198.29 confirms strong buying momentum, and the Stochastic reading of 90.01 reflects sustained participation, although elevated momentum readings may occasionally lead to short-term consolidations.
The projected Central Pivot Range (CPR) for the next trading session has shifted higher, with the projected Pivot at ₹2,860.80. A rising CPR generally indicates improving market acceptance of higher prices and often supports trend continuation when accompanied by strong participation. The dashboard therefore continues to maintain a Buy on Pullbacks approach rather than chasing prices after a sharp advance.
The immediate technical focus remains on the resistance zone between ₹2,945 and ₹3,000. Sustained trading above this region could reinforce the breakout and bring the higher-timeframe observation zones near ₹3,083 and ₹3,150 into focus. On the downside, ₹2,806 remains the first important support, while the structural invalidation level is positioned near ₹2,607.
________________________________________
🏢 BUSINESS OVERVIEW
SRF Limited is a diversified chemicals and manufacturing company with businesses spanning specialty chemicals, fluorochemicals, packaging films and technical textiles. The company continues to benefit from increasing global demand for specialty chemicals, expanding export opportunities and ongoing capacity additions across its high-margin businesses. Its diversified product portfolio and focus on innovation provide a constructive long-term business outlook.
________________________________________
📖 Educational Note
Support and resistance levels should be treated as observation zones rather than predictive targets. Chart patterns, price action, volume analysis, momentum indicators and CPR are educational tools that help market participants understand evolving market structure within a disciplined risk-management framework.
________________________________________
⚠️ Disclaimer
This analysis is provided strictly for educational and informational purposes.
It does not constitute financial, investment or trading advice and should not be interpreted as a recommendation to buy or sell any security.
Investments in the stock market are subject to market risks, including the possible loss of capital.
Historical performance, chart patterns and technical indicators do not guarantee future results.
Please conduct your own research and consult a SEBI-registered investment adviser before making investment decisions.
STWP assumes no responsibility or liability for any financial loss arising directly or indirectly from the use of this analysis.
 Long
Long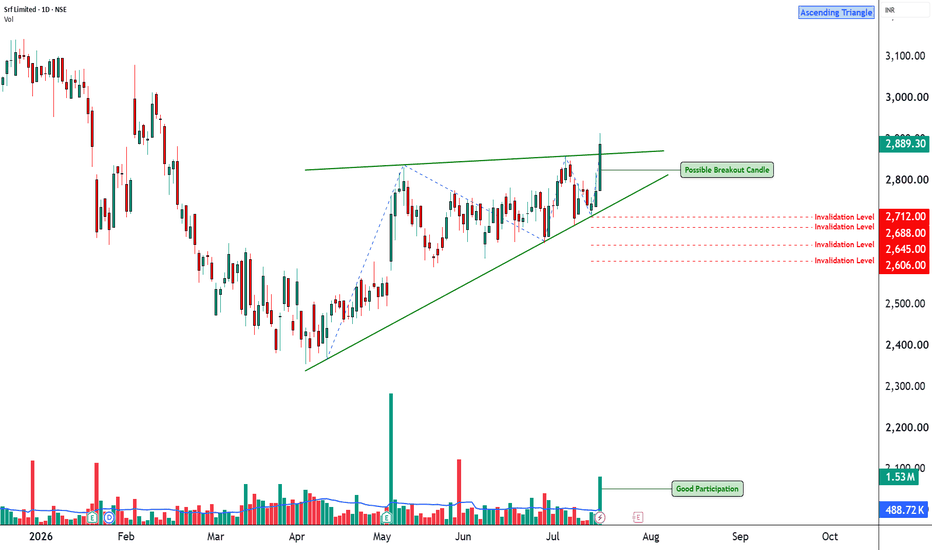
 Long
Long
XAUUSD — Bearish Structure Below Sell FVG
Gold is trading around $4,034 after failing to hold the short-term recovery from the weekly low area. Price is still moving below the recent supply structure, and the current reaction remains weak under the Sell FVG zone around $4,051–$4,058.
From an SMC perspective, gold has already shifted into a bearish structure after the previous BOS to the downside. The recovery from the liquidity zone did not create a strong bullish continuation. Instead, price formed a lower reaction, rejected below the upper liquidity levels, and is now consolidating under the key FVG sell area. This shows that sellers are still defending the short-term structure.
The main zone to watch is the Sell FVG around $4,051–$4,058. If gold pulls back into this zone and forms bearish rejection, the downside scenario remains valid. The next target would be the liquidity zone near $4,000–$3,990, then the weekly low around $3,984. If that low breaks cleanly, gold may continue deeper toward the lower liquidity area.
Sell setup 1
Condition:
Gold pulls back into the Sell FVG zone around $4,051–$4,058 and forms bearish rejection with lower timeframe MSS / CHOCH.
Entry: $4,051–$4,058
SL: above $4,082
TP1: $4,025
TP2: $4,000
TP3: $3,984
TP4: $3,960
Sell setup 2
Condition:
If gold breaks below the current short-term support and retests it as resistance, bearish continuation remains valid without waiting for a deeper pullback.
Entry: below $4,025 after breakdown retest
SL: above $4,051
TP1: $4,000
TP2: $3,984
TP3: $3,960
Sell setup 3
Condition:
If gold sweeps above the Sell FVG but fails to break above $4,082 buyside liquidity, this can create a stronger liquidity-trap sell setup.
Entry: after rejection below $4,082
SL: above $4,105
TP1: $4,051
TP2: $4,025
TP3: $3,984
Buy scalping setup
Condition:
Buying is not the main priority. A buy scalp is only valid if gold sweeps the weekly low around $3,984 and forms a strong bullish rejection.
Entry: $3,984 after bullish rejection
SL: below $3,960
TP1: $4,000
TP2: $4,025
TP3: $4,051–$4,058
Key levels
Current price area: $4,034
Sell FVG zone: $4,051–$4,058
Buyside liquidity: $4,082
Strong liquidity: $4,104
Short-term support: $4,025
Liquidity zone: $4,000–$3,990
Weekly low: $3,984
Lower bearish target: $3,960
Bearish continuation confirmation: clean break below $4,025
Stronger bearish confirmation: clean break below $3,984
Bearish invalidation: clean 2H close above $4,105
My current view is that gold remains in a bearish structure while price stays below the Sell FVG zone and the $4,082 liquidity level. The Prime Gold plan is to avoid buying too early in the middle of the range and wait for either a pullback into $4,051–$4,058 or a clean breakdown below $4,025 before looking for sell confirmation. If sellers continue to defend the FVG, gold may move lower toward $4,000, $3,984 and potentially $3,960.
No confirmation, no trade.
Short 

Trading AnalysisWhere is Nifty right now?
Nifty closed at 23,689 on Thursday May 14. After a brutal fall earlier this week (it touched ~23,300), it bounced back for 2 days in a row. So right now it's in a recovery mood — but it hasn't really "fixed" itself yet. Think of it like someone who had a fever, now feeling slightly better, but not fully healthy.
2 What's the wall above? (Resistance)
If Nifty tries to go up next week, it will hit a wall around 23,500–23,600 first. That's the first test. If it somehow crosses that, the BIGGER wall is at 23,900–24,000 — where all the major moving averages (50-day & 200-day) are sitting. Lots of sellers will be waiting there to book profits. So going above 24,000 next week? Unlikely unless something very positive happens.
3 What's the floor below? (Support)
If Nifty starts falling, the first safety net is around 23,300–23,150. This zone has held multiple times recently. If it breaks this level decisively (and stays below it), then the next stop could be 23,000 or even 22,900. That's the danger zone — but that's not the most likely scenario for next week.



Education