Short
Short
GOLD H1 - Institutional Relief Trap Before Final 3,900 Drop?⚖️ Macro Backdrop: Q3 Position Adjustments & Persistent Macro Weight
Gold markets open the first trading session of July 2026 under localized distribution pressure, hovering at the 3,972.185 handle. As global institutions initiate their Q3 portfolio rebalancing, market flows remain strictly dictated by macro yields and monetary policy expectations. The U.S. 10-Year Treasury yields and the Dollar Index (DXY) continue to maintain aggressive multi-month structural footing, choking out non-yielding bullion's long-term recovery attempts.
While temporary mid-week positioning creates localized intraday liquidity pockets, the overarching institutional order flow is fundamentally defensive. Today's price action represents a classic volume engineering phase; the smart money is utilizing pre-scheduled economic quiet windows to build high-premium sell positions before launching the next major structural markdown leg.
📉 Technical Narrative: Descending Wedge Squeeze & Two-Way Mitigation Playbook
The updated technical framework on the H1 chart delivers a pristine showcase of Smart Money Concepts (SMC) combined with structural trend confluences:
1. Bearish Order Flow Control: Price is heavily constrained within a large descending compression structure, capped by a dominant lower-timeframe primary descending trendline. The overall order flow is strictly bearish.
2. The Proposed Relief Trap (Black Path): Current price action is attempting to engineer a short-term corrective relief bounce. The immediate upside magnet is the unmitigated H1 Supply block (the gray box) resting around 4,010.000 - 4,020.000. This minor lift is a designed buy-side inducement to trap early breakout bulls.
3. The Trendline Intersection Rejection: Upon mitigating the gray supply ceiling, a sharp institutional rejection is projected to take place. The primary target is to break below the near-term ascending support trendline.
4. The Ultimate Target Pool (3,900 Area): Once the compression floor is dismantled, volume expansion will drive the market down into a multi-stage liquidation phase. The ultimate objective is a clean sweep of the Major Sell-Side Liquidity (SSL) Pool resting inside the deep HTF discount demand zone (blue box) around 3,900.000.
🔄 IF-THEN Playbook (Execution Scenarios):
• IF price executes the ziczac relief rally up to the 4,015 supply ceiling and prints a lower-timeframe structural failure (M5/M15 CHoCH Rejection) -> THEN trigger premium short positions targeting the break of 3,960, looking for an extended expansion down to the 3,900 ultimate floor.
• IF price breaks cleanly above the upper descending trendline with a solid H1 candle close above 4,040 -> THEN the immediate bearish expansion thesis is paused, and we must step aside.
🎯 Trading Metrics Summary:
• Current Floating Price: 3,972.185
• Premium Supply Entry Area: 4,010.000 - 4,020.000 (Waiting for LTF CHoCH)
• Compression Support Floor: 3,950.000 Area
• Ultimate Macro Target Floor: 3,900.000 Area (Major SSL Pool)
• Structure Invalidation Level: Decisive H1 candle close above 4,040.000
💡 Trader Question: Are you looking to scalp-long this minor corrective bounce back to the 4,015 gray box, or are you sitting tight waiting to short the premium rejection down to the 3,900 macro floor?
Let me know your playbook in the comments below!  Short
Short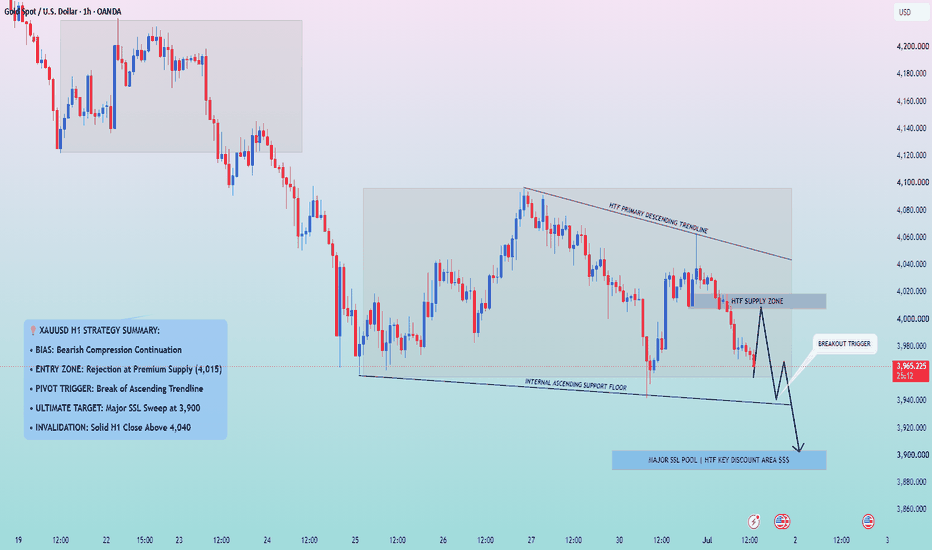
XAUUSD (Daily): Is $3,888 On The Cards As Warsh Speaks?Market Condition: High-Impact Central Bank Volatility / Macro Trend Analysis
Bias: Bearish Distribution
The Big Picture:
Welcome to Q3. Today marks the start of a new trading quarter, which means institutional funds are actively resetting their portfolios. This major structural pivot happens right as the new Fed Chair, Kevin Warsh, takes the stage at the ECB Sintra Forum. Given his hawkish stance on inflation, any strong commentary today will likely inject major volume into the market.
The Technical Setup:
The Macro Trend: Gold has been in a clear bearish distribution phase, making consistent lower highs and lower lows.
The $3,888 Liquidity Magnet: The long horizontal line at the bottom represents a massive pool of Sell-Side Liquidity (SSL) stretching back to late last year. The market algorithm's main objective right now is to clear out those old swing-long stop losses. Our ultimate macro target sits at $3,888.
Fundamentals Meet Technicals : A hawkish stance from Chair Warsh makes the US Dollar strong, which acts as a heavy weight on Gold. The chart gives us the technical target ($3,888), and the hawkish news provides the market with the delivery speed to get there.
Manage your risk and protect your profits.
Disclaimer: Educational purposes only. No tips or financial advice. Short 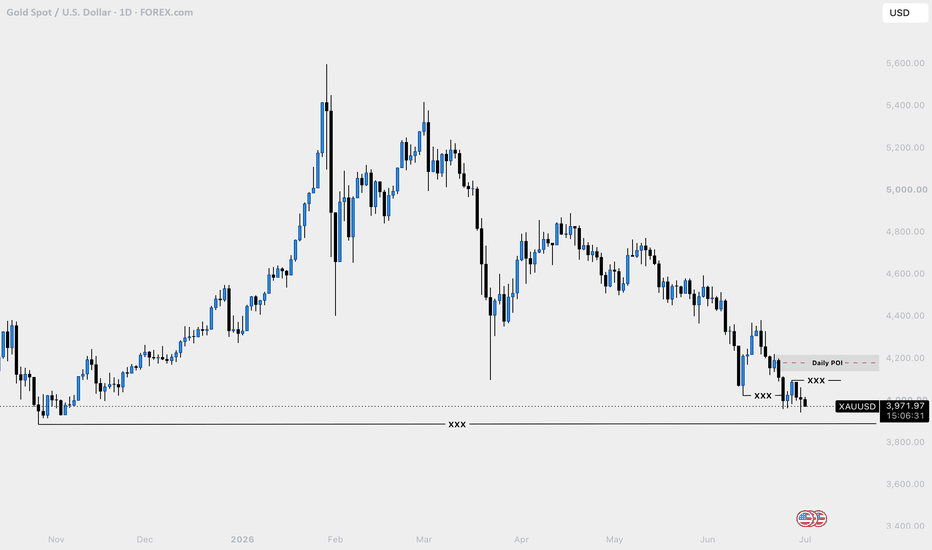
Nifty Broadening Wedge: Reversal Opportunity or Breakdown Risk?Nifty is currently trading inside a Broadening Wedge pattern on the 1-hour timeframe, a structure that often signals increasing volatility before a decisive move. Price has repeatedly respected both the rising resistance trendline and the declining support zone, making the current support area one of the most important levels for the coming sessions.
The chart shows multiple rejections from the upper resistance trendline around 24,200–24,300, indicating that sellers are still defending higher levels. On the downside, buyers have consistently stepped in near 23,750–23,800, preventing a deeper correction. This repeated interaction between support and resistance has created a clear broadening wedge, where the next breakout or breakdown could determine the short-term trend.
Bullish Scenario
If Nifty successfully defends the current support zone and forms a higher low, the index could witness another recovery toward the upper resistance trendline. A decisive breakout above 24,300–24,400 with strong momentum would invalidate the current bearish pressure and could trigger a fresh bullish rally.
Bearish Scenario
If the support trendline breaks decisively, the broadening wedge would fail. Such a breakdown may invite aggressive selling, with the index potentially slipping toward 23,600 initially, followed by a larger decline toward the 23,100 region as illustrated in the bearish projection.
Key Levels
Immediate Support: 23,750–23,800
Major Resistance: 24,250–24,400
Bullish Trigger: Sustained breakout above the resistance trendline
Bearish Trigger: Breakdown below the support trendline
Technical View
The overall structure remains neutral while price trades inside the wedge. Traders should avoid anticipating the move and instead wait for confirmation. A breakout above resistance would favor bullish continuation, whereas a breakdown below support could accelerate downside momentum. The current support zone is the key level that will likely decide Nifty's next major move. XAUUSD – Bearish Pressure Holds Below Ichimoku And TrendlineMASON XAUUSD – Bearish Pressure Holds Below Ichimoku And Trendline
XAUUSD is trading around 3,980 after failing to recover strongly from the recent support area. Price remains below the Ichimoku structure and under the descending trendline, so the main bias is still bearish.
The priority view is to look for sell confirmation on pullbacks, especially if gold retests the sell order zone.
Technical View
Gold is still moving under bearish pressure. The recent recovery attempt failed to break the descending trendline, showing that buyers have not taken control of the structure yet.
Price is also trading below the Ichimoku resistance area. This supports the bearish view because the cloud and Ichimoku lines are still acting as dynamic resistance above price. As long as gold stays below this structure, every rebound should be treated as a correction.
The trendline is important because it continues to cap the upside. If price pulls back into the 3,998–4,018 sell order zone and rejects, this may confirm another lower high inside the bearish trend.
The 3,943 support is the first downside area to watch. If gold breaks below this level, selling pressure may continue toward the Fibonacci 1.618 area near 3,910.
The deeper bearish target is the Fibonacci extension zone around 3,810–3,825. This area becomes more realistic if gold breaks support cleanly and fails to recover above the sell zone.
Key Zones
Current price: 3,980
Sell order zone: 3,998–4,018
Short-term resistance: 4,018
Upper liquidity area: 4,037–4,064
Nearest support: 3,943
Fibonacci 1.618 target: 3,910
Fibonacci extension target: 3,810–3,825
Invalidation: above 4,064
Trading Plan
Sell Priority: 3,998–4,018
Condition: wait for bearish rejection, failed breakout above 4,018, or lower high formation below the descending trendline.
SL: above 4,064
TP1: 3,943
TP2: 3,910
TP3: 3,810–3,825
Alternative Scenario
If gold breaks below 3,943 directly, wait for a retest of this level as resistance before looking for sell continuation toward 3,910 and the Fibonacci extension target.
Buy View
Buy is not the priority while price stays below the Ichimoku structure and descending trendline. A buy setup only becomes safer if gold breaks above 4,064 and holds above the liquidity area.
Final View
Overall, gold remains in a bearish structure. The cleaner plan is to wait for price to retest the sell order zone, then watch for rejection. As long as 4,018–4,064 holds as resistance, the downside path toward 3,943, 3,910, and 3,810–3,825 remains in focus.
Will gold reject from the sell order zone first, or break support directly toward the Fibonacci extension target?
Short 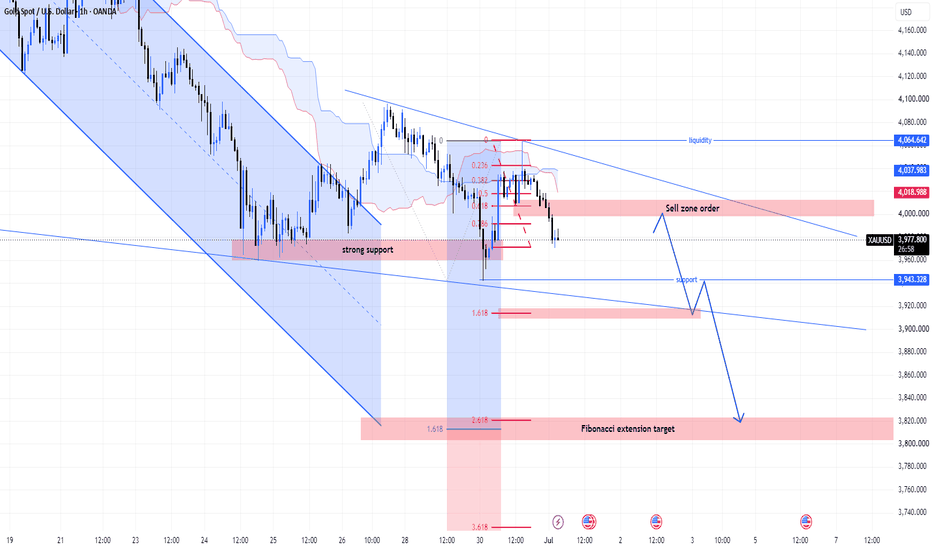
#NIFTY Intraday Support and Resistance Levels - 01/07/2026Nifty 50 is expected to open with a slight gap-up bias near the 23950 zone, with no major changes compared to the previous session. The index continues to trade within a consolidation range after witnessing sustained selling pressure from higher levels. As long as Nifty holds above the immediate support zone, the broader market structure remains stable, though traders should wait for a decisive breakout before taking aggressive positions.
For today's session, 24050–24100 remains the immediate buying zone. A sustained move above this range can trigger fresh buying momentum towards 24150, 24200, and 24250 levels. If Nifty manages to break and sustain above 24250, the rally may extend further towards higher resistance levels, indicating renewed bullish strength.
On the downside, 23950–23900 remains the key support zone for intraday traders. A decisive breakdown below this level may invite fresh selling pressure towards 23850, 23800, and 23750 levels. However, unless this support zone is breached convincingly, the index is likely to continue consolidating within the current range.
Overall, the market structure remains range-bound with a slight gap-up opening expected and no major changes from yesterday's levels. Traders should avoid aggressive trades inside the consolidation zone and wait for a confirmed breakout above 24050 for long opportunities or a breakdown below 23950 for short trades. Maintain strict stop-losses and consider partial profit booking at every target as intraday volatility may remain elevated. #BANKNIFTY Intraday PE & CE Levels(01/07/2026)Bank Nifty is expected to open with a slightly gap-up bias around the 57700–57750 zone after recovering from lower levels in the previous session. Although the index continues to trade below its immediate resistance, buying interest near support indicates that bulls are attempting to regain control. A sustained move above the key resistance levels will be crucial for confirming a fresh upside rally.
For today's session, 58050 remains the immediate breakout level to watch. A sustained move above this level can trigger fresh buying momentum towards 58250, 58350, and 58450+ levels. If Bank Nifty manages to cross and sustain above 58550, the bullish rally may extend further towards 58750, 58850, and 58950+ levels.
On the downside, 57950–57900 remains the key intraday resistance zone for fresh PE opportunities. Any rejection from this area may lead to profit booking towards 57750, 57650, and 57550 levels. If the index slips below 57450, selling pressure may intensify further, dragging Bank Nifty towards 57250, 57150, and 57050 levels.  Long
Long
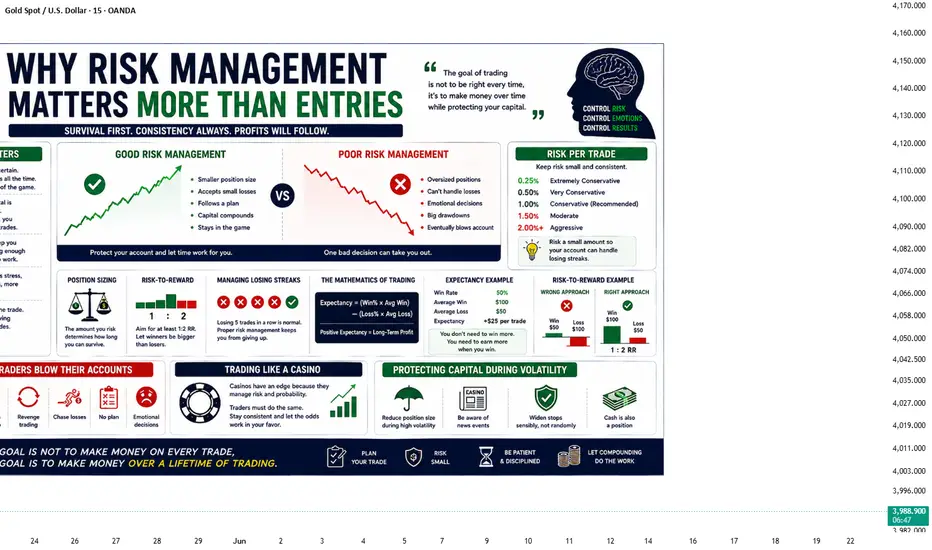
Risk Management Ask a group of traders what separates successful traders from unsuccessful ones, and many will mention strategy.
Some believe the answer is finding the perfect indicator.
Others search endlessly for the best chart pattern or the highest win-rate trading system.
While these things have value, they are not what determines long-term success.
The truth is much simpler.
A great entry cannot save poor risk management, but good risk management can survive imperfect entries.
This is one of the most important lessons every trader eventually learns.
Trading Is a Probability Game
No trader wins every trade.
Even the world's most experienced professionals experience losses.
Financial markets are uncertain by nature, which means every trade is simply a probability—not a guarantee.
The goal is not to avoid losing trades.
The goal is to ensure that no single trade has the power to seriously damage your account.
Professional traders understand this.
Instead of trying to predict every move correctly, they focus on managing uncertainty.
Why Great Entries Still Fail
Imagine identifying what appears to be the perfect setup.
The trend is strong.
Support is holding.
The candlestick confirmation looks ideal.
Everything points toward a winning trade.
Then, unexpected news is released.
The market reverses sharply.
Your analysis wasn't necessarily wrong.
The market simply changed.
This is why successful traders never assume that any setup is certain.
Every trade must include a plan for what happens if the market proves them wrong.
Protecting Capital Comes First
Your trading account is your most valuable asset.
Without capital, you cannot participate in future opportunities.
Many beginners become obsessed with making money quickly.
Professional traders think differently.
Their first priority is protecting what they already have.
Because opportunities appear every day.
Capital lost through poor risk management can take months—or even years—to recover.
Small Losses Are Part of the Business
Many new traders view losses as failure.
Experienced traders view them as business expenses.
Every profession has costs.
A restaurant pays rent.
A manufacturer buys raw materials.
A trader accepts occasional losses.
The difference is that professional traders keep those losses small.
A controlled loss is simply the cost of staying in the game.
The Power of Position Sizing
Risk management is not only about placing stop losses.
It also involves deciding how much capital to risk on each trade.
A trader risking 1% of their account on a losing trade remains financially and emotionally stable.
A trader risking 20% may struggle to recover after only a few losses.
Position sizing ensures that one mistake never becomes a disaster.
Consistency matters far more than aggression.
Risk-to-Reward Is More Important Than Win Rate
Many traders chase strategies with the highest possible win rate.
But a high win rate does not always produce consistent profits.
Imagine two traders.
The first wins 80% of the time but loses far more on losing trades than they gain on winners.
The second wins only 45% of the time but allows winning trades to be much larger than losing ones.
Over time, the second trader may outperform the first.
This is why professional traders pay close attention to risk-to-reward ratios instead of focusing only on how often they win.
Emotional Control Begins With Risk
Many trading mistakes begin before the trade even starts.
When too much money is at risk, emotions become stronger.
Fear causes traders to exit too early.
Greed encourages them to hold too long.
Hope prevents them from accepting small losses.
Proper risk management reduces emotional pressure.
When each trade risks only a small portion of your account, it becomes much easier to follow your trading plan objectively.
Long-Term Thinking Wins
Successful trading is not about one trade.
It is not about one week.
It is not even about one month.
It is about surviving long enough for your edge to play out over hundreds of trades.
The traders who stay in the market for years are rarely the ones taking the biggest risks.
They are the ones managing risk with discipline and consistency.
Final words:
Every trader wants better entries.
But better entries alone are never enough.
Markets are unpredictable, and losses are unavoidable.
Risk management is what allows traders to survive those losses and continue growing over time.
The most successful traders are not those who predict the market perfectly.
They are the ones who protect their capital, control their emotions, and remain consistent through both winning and losing periods.
Because in trading, survival comes first.
Profit is simply the reward for surviving long enough.
Education 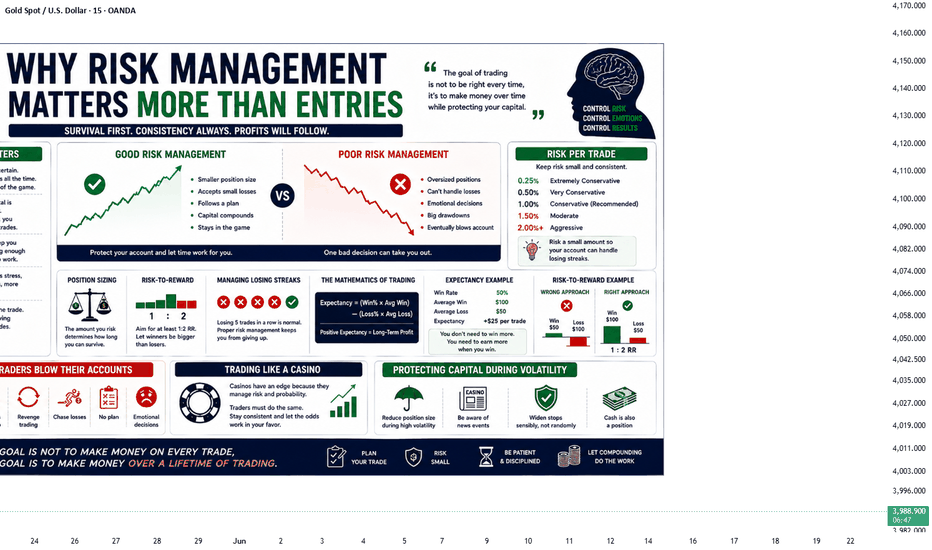
Technical AnalysisAsk two traders why they trust technical analysis, and you'll probably hear two different answers.
One might say it's because support and resistance work.
Another may point to moving averages, RSI, or chart patterns.
But beneath every indicator and every pattern lies one simple truth:
Technical analysis works because people behave in predictable ways.
Charts don't move because of lines, indicators, or mathematical formulas.
They move because millions of traders make decisions based on fear, greed, hope, confidence, and uncertainty.
Technical analysis is simply a way of studying those decisions.
Every Chart Is a Record of Human Behavior
A price chart is much more than candles moving up and down.
It is a visual history of every buying and selling decision made by market participants.
Every bullish candle reflects confidence.
Every bearish candle reflects caution or fear.
Every breakout shows increasing demand.
Every rejection reveals strong opposition from buyers or sellers.
Instead of thinking of charts as numbers, think of them as a record of crowd psychology.
Why History Often Repeats Itself
One of the basic ideas behind technical analysis is that history tends to repeat.
Not because markets are identical, but because human emotions rarely change.
Greed creates buying pressure.
Fear creates panic selling.
Hope encourages traders to hold losing positions.
Confidence attracts new buyers.
These emotional cycles have existed for decades, and they continue to shape today's markets just as they did years ago.
That is why similar price patterns continue to appear across different markets and timeframes.
Why Support and Resistance Matter
Support and resistance are not magical lines.
They are areas where traders previously made important decisions.
When price returns to those levels, many participants remember what happened before.
Some traders buy because price bounced there previously.
Others sell because they expect another rejection.
As more traders focus on the same levels, those areas naturally become zones of increased activity.
The chart reflects collective memory.
Chart Patterns Reflect Crowd Decisions
Patterns such as triangles, flags, double tops, and head and shoulders are not random formations.
Each one represents changing emotions among buyers and sellers.
A breakout often shows growing confidence.
A failed breakout may reveal hesitation.
A reversal pattern can signal that one side is losing control while the other is gaining strength.
Understanding the psychology behind a pattern is often more valuable than simply memorizing its shape.
Indicators Measure Behavior, Not the Future
Many beginners believe indicators predict market direction.
In reality, indicators measure what price has already done.
RSI measures momentum.
Moving averages smooth price trends.
MACD compares momentum over different periods.
Volume shows participation.
These tools do not create market movement.
They help traders understand the behavior already reflected in price.
Using them with market context is far more effective than relying on any single indicator.
Why No Tool Works All the Time
One of the biggest misconceptions in trading is the search for a perfect indicator.
No strategy wins every trade.
Markets constantly change because human behavior constantly changes.
News events, economic data, market sentiment, and liquidity all influence price.
Technical analysis provides probabilities, not certainty.
Successful traders understand this and focus on managing risk rather than predicting every move correctly.
The Importance of Confluence
Professional traders rarely base decisions on a single signal.
Instead, they look for confluence.
For example, imagine price reaches a major support level while:
RSI shows oversold conditions.
A bullish candlestick pattern appears.
Volume increases.
The trend remains intact.
Each piece of evidence supports the others.
This combination often creates stronger trading opportunities than relying on one indicator alone.
Final words:
Technical analysis is often misunderstood as a collection of lines, indicators, and patterns.
In reality, it is the study of human behavior displayed through price.
Every chart reflects emotion.
Every trend reflects changing confidence.
Every reversal reflects shifting expectations.
The traders who achieve long-term success are not those who memorize the most indicators.
They are the ones who understand the people behind every candle.
Because markets may evolve with technology, but human psychology remains remarkably consistent.
And that is why technical analysis continues to work generation after generation.
Ask two traders why they trust technical analysis, and you'll probably hear two different answers.
One might say it's because support and resistance work.
Another may point to moving averages, RSI, or chart patterns.
But beneath every indicator and every pattern lies one simple truth:
Technical analysis works because people behave in predictable ways.
Charts don't move because of lines, indicators, or mathematical formulas.
They move because millions of traders make decisions based on fear, greed, hope, confidence, and uncertainty.
Technical analysis is simply a way of studying those decisions.
Every Chart Is a Record of Human Behavior
A price chart is much more than candles moving up and down.
It is a visual history of every buying and selling decision made by market participants.
Every bullish candle reflects confidence.
Every bearish candle reflects caution or fear.
Every breakout shows increasing demand.
Every rejection reveals strong opposition from buyers or sellers.
Instead of thinking of charts as numbers, think of them as a record of crowd psychology.
Why History Often Repeats Itself
One of the basic ideas behind technical analysis is that history tends to repeat.
Not because markets are identical, but because human emotions rarely change.
Greed creates buying pressure.
Fear creates panic selling.
Hope encourages traders to hold losing positions.
Confidence attracts new buyers.
These emotional cycles have existed for decades, and they continue to shape today's markets just as they did years ago.
That is why similar price patterns continue to appear across different markets and timeframes.
Why Support and Resistance Matter
Support and resistance are not magical lines.
They are areas where traders previously made important decisions.
When price returns to those levels, many participants remember what happened before.
Some traders buy because price bounced there previously.
Others sell because they expect another rejection.
As more traders focus on the same levels, those areas naturally become zones of increased activity.
The chart reflects collective memory.
Chart Patterns Reflect Crowd Decisions
Patterns such as triangles, flags, double tops, and head and shoulders are not random formations.
Each one represents changing emotions among buyers and sellers.
A breakout often shows growing confidence.
A failed breakout may reveal hesitation.
A reversal pattern can signal that one side is losing control while the other is gaining strength.
Understanding the psychology behind a pattern is often more valuable than simply memorizing its shape.
Indicators Measure Behavior, Not the Future
Many beginners believe indicators predict market direction.
In reality, indicators measure what price has already done.
RSI measures momentum.
Moving averages smooth price trends.
MACD compares momentum over different periods.
Volume shows participation.
These tools do not create market movement.
They help traders understand the behavior already reflected in price.
Using them with market context is far more effective than relying on any single indicator.
Why No Tool Works All the Time
One of the biggest misconceptions in trading is the search for a perfect indicator.
No strategy wins every trade.
Markets constantly change because human behavior constantly changes.
News events, economic data, market sentiment, and liquidity all influence price.
Technical analysis provides probabilities, not certainty.
Successful traders understand this and focus on managing risk rather than predicting every move correctly.
The Importance of Confluence
Professional traders rarely base decisions on a single signal.
Instead, they look for confluence.
For example, imagine price reaches a major support level while:
RSI shows oversold conditions.
A bullish candlestick pattern appears.
Volume increases.
The trend remains intact.
Each piece of evidence supports the others.
This combination often creates stronger trading opportunities than relying on one indicator alone.
Final words:
Technical analysis is often misunderstood as a collection of lines, indicators, and patterns.
In reality, it is the study of human behavior displayed through price.
Every chart reflects emotion.
Every trend reflects changing confidence.
Every reversal reflects shifting expectations.
The traders who achieve long-term success are not those who memorize the most indicators.
They are the ones who understand the people behind every candle.
Because markets may evolve with technology, but human psychology remains remarkably consistent.
And that is why technical analysis continues to work generation after generation.
Education 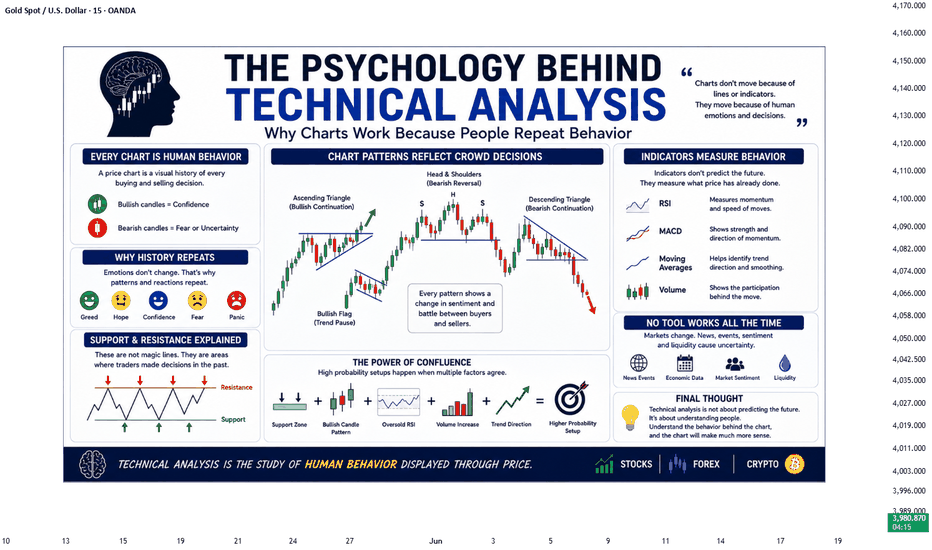
XAUUSD: The Quarterly Close Trap Is LIVE — Do NOT Fall For It!Market Condition : Extreme Institutional Volatility / Execution Requires Extreme Patience
Bias: Neutral-Bullish Trigger (Stay Sidelined for the Pullback)
We have a massive technical convergence playing out right now. Today, June 30th, we are witnessing a simultaneous Monthly and Quarterly candle close.
Days like today do not follow normal retail patterns. Large hedge funds, central banks, and institutional algorithms are actively engaged in "Window Dressing"—rebalancing their books and chasing liquidity to pin specific closing prices before the new quarter opens tomorrow.
Looking at the 4-hour chart uploaded here, let's break down the macro structure and how we plan to execute on the lower timeframes.
The Technical Picture:
On this 4H frame, Gold cleanly executed a major liquidity raid, aggressively flushing below the consolidation floor down to the $3,958.61 region to clean out retail stops. Immediately after catching those sell-stops, the market printed a sharp, aggressive V-shape recovery back up to $3,989.97.
While we are viewing the 4-hour layout here, dropping down to the 15-minute lower timeframe shows that this sudden upward displacement has given us an early Market Structure Shift (MSS). While this structurally opens the door for the highly anticipated higher-timeframe retracement toward our Daily POI (~$4,150–$4,200), we cannot blindly buy the top of this green leg.
The London & New York Game Plan:
Because of the heavy quarterly settlement manipulation, algorithms love to print massive fakeouts and volatile whipsaws. If the market builds genuine bullish momentum, the first draw on liquidity will be the minor internal high marked at $4,096—but chasing it right now is a major trap.
🚫 Do NOT Chase: If London continues to pump vertically without a rest, we stay completely sidelined. Chasing a premium on a quarterly close day is a fast track to getting stopped out.
📉 The Pullback Entry : We will keep our execution bias entirely neutral until London or New York provides a deep, corrective pullback. On our lower timeframes, we are looking for the price to mitigate a 15-minute Fair Value Gap (FVG) or demand zone around $3,960–$3,970.
⚡ The Confirmation: If that demand zone holds and prints clean lower-timeframe rejection candles, only then do we execute a low-risk buy targeting the higher-timeframe structural pullback.
Let the big funds fight it out during the session transitions and print their closing wicks today. Protect your capital, wait for the mitigation, and trade only with confirmed displacement!
How are you playing this 4-hour liquidity sweep? Letting it pull back to demand, or sitting today out entirely? Drop your plan below!
Manage your risk and protect your profits.
Disclaimer: Educational purposes only. No tips or financial advice. #NIFTY Intraday Support and Resistance Levels - 30/06/2026Nifty 50 is expected to open with a flat bias around the 23950–24000 zone after witnessing sustained selling pressure from higher levels in the previous session. The index has entered a consolidation phase near an important support area, indicating indecision between buyers and sellers. As long as Nifty holds above the immediate support zone, the broader market structure remains stable despite short-term weakness.
For today's session, 24050–24100 remains the immediate buying zone. A sustained move above this range can trigger fresh buying momentum towards 24150, 24200, and 24250 levels. If Nifty manages to break and sustain above 24250, the rally may extend further towards 24350, 24400, and 24450+ levels.
On the downside, 23950–23900 is the key support zone for intraday traders. A decisive breakdown below this level may invite fresh selling pressure towards 23850, 23800, and 23750 levels. However, unless this support zone is breached convincingly, the index is likely to remain in a consolidation range.
Overall, the market structure remains range-bound with a flat opening expected. Traders should avoid aggressive positions inside the consolidation zone and wait for a decisive breakout above 24050 for fresh long opportunities or a breakdown below 23950 for short trades. Maintain strict stop-losses and consider partial profit booking at every target as intraday volatility is expected to remain high.  Long
Long
 Long
Long
XAUUSD: 4,163 Retest Could Trigger Further DeclineXAUUSD continues to trade clearly within a downtrend channel that has persisted since early May. Notably, selling pressure emerges quickly whenever the price rallies to the channel's upper boundary, resulting in a series of lower highs. Currently, the price is hovering around the 4,060 level—situated within the bearish structure—with no signs yet that the bulls have regained control.
On the chart, the 4,163.6 level stands out as key resistance, representing the confluence of the downtrend channel's upper boundary and an overhead supply zone. If the price rallies to this area but fails to break through, the most likely scenario is a rejection followed by a resumption of the downward trend. Given the prevailing bearish trend, current short-term rallies are best viewed as technical corrections rather than genuine trend reversals.
Entry Focus: Prioritize SELL positions if the price rebounds to the 4,150–4,163 range and shows clear signs of rejection (e.g., a rejection candle).
Target: 3,885.0
Invalidation: The bearish scenario is invalidated if the price closes strongly above the 4,163–4,180 zone and decisively breaks out of the channel's upper boundary. Short 
#NIFTY Intraday Support and Resistance Levels - 29/06/2026Nifty 50 is expected to open with a flat bias around the 24050 zone after witnessing profit booking from higher levels in the previous session. The index has retraced towards its immediate support area and is currently trading near an important consolidation zone. As long as Nifty holds above the 24050 support region, the overall bullish structure remains intact despite short-term volatility.
For today's session, 24050–24100 remains the immediate buying zone. A sustained move from this support can push the index towards 24150, 24200, and 24250 levels. If Nifty manages to break and sustain above 24250, fresh buying momentum may emerge, driving the index towards 24350, 24400, and 24450+ levels.
On the downside, 23950–23900 is the key support zone for intraday traders. A decisive breakdown below this level may trigger fresh selling pressure towards 23850, 23800, and 23750 levels. However, unless this support is breached convincingly, the broader trend continues to favor the bulls. #BANKNIFTY Intraday PE & CE Levels(29/06/2026)Bank Nifty is expected to open with a flat bias around the 58150–58200 zone after witnessing profit booking from higher levels in the previous session. Despite the recent pullback, the index continues to trade above its crucial support zone, indicating that the broader trend remains positive while short-term consolidation is underway.
For today's session, 58050 remains the immediate resistance level to watch. A sustained move above 58050 can trigger fresh buying momentum towards 58250, 58350, and 58450+ levels. If Bank Nifty manages to cross and sustain above 58550, the rally may further extend towards 58750, 58850, and 58950+ levels.
On the downside, 58450–58400 acts as the first intraday resistance zone for fresh PE opportunities, with downside targets placed at 58250, 58150, and 58050 levels. If selling pressure intensifies and the index slips below 57950, further weakness may drag Bank Nifty towards 57750, 57650, and 57550 levels. XAUUSD — Medium-Term Bearish Shift Below EMA Structure
Fundamental Analysis
Gold remains under pressure as the market continues to watch USD momentum, Treasury yields, and upcoming U.S. macro data.
For now, the medium-term structure is weakening. As long as gold trades below the main EMA area, recovery attempts should be treated as technical pullbacks rather than a full bullish reversal.
Technical Analysis
On the daily chart, XAUUSD is showing a clear medium-term bearish shift. After failing to hold the higher structure near the previous swing high, price started to move lower and is now trading below the EMA 34, EMA 89, and EMA 200 area.
The EMA structure is beginning to converge and turn downward. This is important because it suggests that the previous bullish momentum is losing control, while sellers are gradually taking over the medium-term direction.
Price is currently around 4,088 after reacting from the strong liquidity zone near 4,000. However, the bounce remains below the EMA resistance area, so the main plan is still to wait for a recovery into the value zone before looking for sell confirmation.
The key sell swing zone is around 4,307 - 4,352. This area aligns with the Fibonacci retracement zone, EMA resistance, broken trendline pressure, and previous market structure. If gold reaches this zone and rejects, the bearish continuation scenario becomes stronger.
The medium-term downside target remains the Fibonacci extension and liquidity zone around 3,481 - 3,462.
Important Key Levels
Current price area: 4,088
Strong liquidity zone: 3,980 - 4,000
Main sell swing zone: 4,307 - 4,352
EMA resistance area: 4,307 - 4,497
Key bearish invalidation: above 4,497
First downside target: 3,980 - 4,000
Medium-term target: 3,481 - 3,462
Trading Scenario
Main Sell Scenario
Entry: 4,307 - 4,352
Stop Loss: 4,497
Take Profit 1: 4,000
Take Profit 2: 3,800
Take Profit 3: 3,481 - 3,462
Sell Condition
The preferred setup is to wait for gold to recover into the 4,307 - 4,352 sell swing zone. This area is important because it combines EMA resistance, Fibonacci retracement, and the broken structure from the previous bearish move.
A sell setup becomes more valid if price forms bearish rejection from this zone, such as a long upper wick, bearish engulfing candle, failed breakout, or lower high below the EMA structure.
If price rejects from the sell zone and breaks back below 4,000, the medium-term bearish view becomes stronger. The next major downside focus would be the Fibonacci extension target around 3,481 - 3,462.
Entry Conditions
Wait for price to recover into 4,307 - 4,352.
Look for bearish rejection before entering sell.
Do not sell aggressively at the low without a pullback.
A break below 4,000 confirms stronger bearish pressure.
If price breaks and holds above 4,497, the sell setup is invalid.
Overall, the main view remains bearish while XAUUSD trades below the converging EMA structure. The preferred plan is to wait for a pullback into the EMA and Fibonacci value zone, then look for sell confirmation toward 4,000 and the medium-term target around 3,481 - 3,462.
Do you share the same medium-term bearish view on gold, or are you waiting for a cleaner rejection from the EMA value zone first?
Short 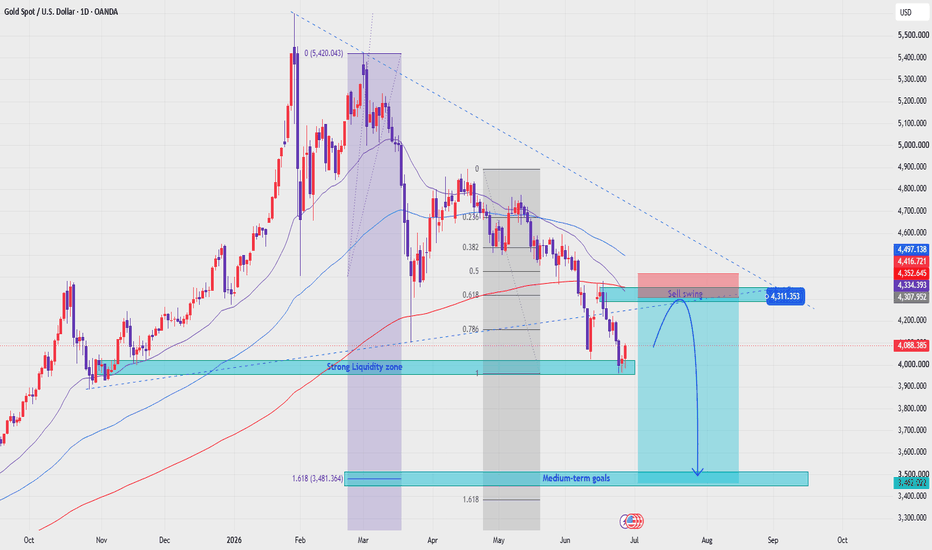
Short 
10 Must-Read Books That Can Transform Your Trading JourneyEvery successful trader has one thing in common: they never stop learning.
Markets evolve, technology changes, and strategies come and go, but the principles of discipline, risk management, and psychology remain timeless. Reading the right books won't make you profitable overnight, but they can save you years of costly mistakes and accelerate your growth.
Whether you're trading stocks, forex, crypto, commodities, or options, these ten books deserve a place in your library.
1. Trading in the Zone - Mark Douglas
Many traders spend years searching for the perfect strategy, only to realize their biggest obstacle is themselves.
Mark Douglas explains why consistency comes from mastering your mindset rather than constantly changing indicators or systems. He teaches traders how to think in probabilities, control emotions, and execute trades without fear or hesitation.
Why Read It?
Build confidence in your trading plan
Overcome fear and greed
Learn to accept losses without emotional damage
Develop a professional trading mindset
2. Market Wizards - Jack D. Schwager
Instead of teaching one trading method, this classic lets some of the world's greatest traders tell their own stories. Each interview reveals different strategies, personalities, and market approaches, proving there isn't a single path to success. The common themes are discipline, patience, and excellent risk management.
Why Read It?
Learn directly from legendary traders
Discover multiple trading styles
Understand what separates professionals from amateurs
3. Technical Analysis of the Financial Markets - John J. Murphy
If technical analysis had an encyclopedia, this would be it. Murphy covers everything from trend analysis and chart patterns to indicators, volume, market cycles, and intermarket relationships. It's one of the most complete technical analysis books ever written.
Why Read It?
Learn technical analysis from the ground up
Improve chart-reading skills
Build a solid analytical foundation
4. Reminiscences of a Stock Operator - Edwin Lefèvre
Despite being written nearly 100 years ago, this book remains surprisingly relevant.
Based on the life of legendary trader Jesse Livermore, it demonstrates how markets are driven by human behavior. The technology has changed, but emotions haven't. The lessons on patience, timing, and capital preservation are just as valuable today as they were a century ago.
Why Read It?
Learn timeless market wisdom
Understand trader psychology
Appreciate the importance of patience
5. The Daily Trading Coach - Brett N. Steenbarger
Improving as a trader requires more than studying charts: it requires developing better habits. This book provides over 100 practical exercises designed to improve discipline, emotional control, decision-making, and daily performance.
Why Read It?
Create productive trading routines
Improve consistency
Develop long-term trading habits
6. Japanese Candlestick Charting Techniques - Steve Nison
Candlestick patterns are one of the most widely used tools in technical analysis today, thanks largely to Steve Nison. This book explains how price action reflects market sentiment and how traders can use candlestick formations to improve timing and identify reversals.
Why Read It?
Master candlestick analysis
Improve trade entries and exits
Understand market psychology through price action
7. The Intelligent Investor - Benjamin Graham
Not every trader focuses on long-term investing, but every market participant can benefit from Graham's principles. This classic introduces concepts like intrinsic value, margin of safety, and emotional discipline: ideas that continue to influence investors worldwide.
Why Read It?
Learn timeless investing principles
Improve capital preservation
Develop long-term market perspective
8. The Psychology of Trading - Brett N. Steenbarger
Success in trading depends as much on personal development as market knowledge. Steenbarger blends psychology, coaching, and performance science to help traders understand their habits, improve focus, and consistently perform at a higher level.
Why Read It?
Strengthen emotional resilience
Eliminate destructive habits
Build peak trading performance
9. The Disciplined Trader - Mark Douglas
Before Trading in the Zone, Douglas wrote this influential book exploring why traders often sabotage themselves. He explains how beliefs, emotions, and mental conditioning affect every trading decision and provides a framework for developing consistency.
Why Read It?
Understand trading psychology
Improve discipline
Build confidence in your trading system
10. The New Market Wizards - Jack D. Schwager
This follow-up to Market Wizards introduces another generation of exceptional traders. Their stories reinforce a powerful lesson: there is no universal strategy. Success comes from finding an approach that matches your personality and executing it with discipline.
Why Read It?
Learn modern trading perspectives
Explore diverse trading methodologies
Gain inspiration from real-world success stories
My Thoughts:
The best traders never stop being students. These books won't hand you a winning strategy, but they'll teach you how successful traders think, manage risk, and stay disciplined through every market condition. If you're serious about becoming consistently profitable, start with one book, apply its lessons, and then move to the next. Knowledge compounds, just like great investments.
By @BrightRally_Research  Education