Rishabh Instruments Ltd - Breakout Setup, Move is ON...#RISHABH trading above Resistance of 769
Next Resistance is at 1137
Support is at 601
Here are previous charts:
This weekly chart for Rishabh Instruments Limited displays a strong bullish breakout from a consolidation pattern, supported by significant volume and structural trendline context.
Chart Overview
Timeframe & Asset: Rishabh Instruments Limited (1-Week Chart, NSE).
Current Price: 829.60 INR (+12.34% change shown on the chart header).
Key Technical Observations
Horizontal & Channel Breakout: The stock consolidated within a downward-sloping mini-channel (white lines) and horizontal range before breaking out above 295.00 INR, marked by the yellow Breakout arrow.
Volume Expansion: The blue arrows highlight substantial surges in trading volume during the initial breakout phase and the subsequent upside continuation, confirming strong institutional buying conviction.
Support Levels:
295.00 INR (Yellow Line): The horizontal level corresponding to the initial breakout point and dynamic base support.
491.00 INR (Green Line): An earlier structural resistance level that previously defined Resistance 1 before converting into intermediate support.
601.00 INR (Red Line): A major horizontal level (marked with a red arrow) that previously acted as resistance before flipping to become the primary structural support level on recent pullbacks.
Resistance Levels:
Resistance 1 (491.00 INR): An earlier structural resistance level that has since been surpassed and converted into support.
Resistance 2 (769.00 INR): A structural resistance level (green line) that the current price candle has tested and breached to trade at 829.60 INR.
Resistance 3 (1,137.00 INR): The long-term upside projection level marked near the top green line.
Long-Term Trend Lines: The solid white lines form a multi-month falling channel from which the stock staged a structural reversal, with price action now accelerating into a strong macro expansion.
Conclusion & Current Price Action
The current price action reflects strong bullish momentum following the volume-backed breakout above 295.00 INR and a successful retest of the 601.00 INR support zone. The stock has recently cleared its immediate hurdle at Resistance 2 (769.00 INR).
A sustained weekly close above this Resistance 2 zone indicates room for extended upside toward the long-term upside projection level of 1,137.00 INR (Resistance 3). On any potential pullbacks, the 601.00 INR level will serve as the primary line of defense for buyers to keep the structural uptrend intact.
A parallel channel (also known as an ascending, descending, or horizontal channel) is a technical analysis pattern bounded by two parallel trendlines that encompass a security’s price action over time.
Structure & Mechanics
Main Components:
Trendline / Base Line: Connects a series of prominent reaction lows (in an uptrend) or reaction highs (in a downtrend).
Channel Line: Drawn parallel to the trendline, connecting the peaks (top boundary) or troughs (bottom boundary).
Price Movement: Price oscillates between the upper boundary (which acts as dynamic resistance) and the lower boundary (which acts as dynamic support).
Types of Channels
Ascending Channel (Bullish): Characterized by higher highs and higher lows. Indicates a steady uptrend where buying pressure dominates.
Descending Channel (Bearish): Characterized by lower highs and lower lows. Represents a controlled downtrend or corrective pullback.
Horizontal Channel (Consolidation): Moving sideways between static support and resistance lines, signaling market indecision or range-bound trading.
How Traders Use Parallel Channels
Trading Within the Range: Buying near the channel's lower boundary (support) and selling or shorting near the upper boundary (resistance).
Breakout Trading: A strong, high-volume candle breaking outside either boundary signals potential trend acceleration or continuation in the direction of the breakout (as seen in the charts provided previously).
Midline (50% Line): Often, a dashed line is drawn down the middle of the channel. Price reacting to this midline can confirm the channel's validity and act as interim support or resistance.
Disclaimer: This is for demonstration and educational purpose only. This is not buying or selling recommendations. I am not SEBI registered financial advisor. Please consult your financial advisor before taking any trade.  Long
Long
SLL Sweep Before Recovery
Fundamental Analysis
Gold remains sensitive to a firm U.S. dollar, high Treasury yields and inflation expectations. U.S. CPI is now the key catalyst and could create strong volatility around Fed rate expectations.
Technical Analysis
On H1, Gold remains in a bearish structure after the recent CHoCH and BOS, with price now trading near 4,334.
The main downside focus is the 4,280–4,290 SLL, where the current bearish wave may complete.
If price sweeps this liquidity and buyers confirm a reaction, a corrective recovery could develop toward the 4,362–4,380 Fibo Zone + VAL, followed by the 4,388–4,400 POC.
Important Key Levels
4,430–4,440 — OB + Support / Major Resistance
4,388–4,400 — POC
4,362–4,380 — Fibo Zone + VAL
4,280–4,290 — SLL / Main Liquidity
Trading Scenario
Buy priority comes only after a sweep into 4,280–4,290 followed by bullish H1 confirmation.
Target: 4,362–4,380 first, then 4,388–4,400.
Invalidation: H1 acceptance below 4,280.
Overall View
The H1 structure is still bearish, so buying early is less attractive. The cleaner setup is to wait for the lower liquidity sweep and then watch for a confirmed recovery wave.
Will Gold sweep 4,290 before rebounding toward the Fibo Zone?  Long
Long
 Long
Long
 Long
Long
 Long
Long
XAUUSD — Medium-Term Bearish Wave Toward 3,836
Gold is showing a medium-term bearish Elliott Wave structure after failing to recover above the descending channel resistance. From Kelly’s view, the chart suggests that XAUUSD is still moving inside a broader downside trend, and the current rebound may only be a correction before the next bearish wave continues.
The key idea is simple: gold may retest support first, then create a short recovery, but as long as price stays below the descending trendline and resistance structure, the priority scenario remains bearish for next week.
⟡ Market structure
Gold is currently trading around 4,349, still below the main descending channel. The previous bullish trendline has already been weakened, and price is now moving under bearish pressure.
The first important level to watch is the 4,282–4,300 strong support area. If gold breaks below this zone, the next downside path may open toward 4,230, then the 4,090–4,110 Buy zone wave 4.
For the medium-term structure, if sellers continue to control the market, gold may extend lower toward the final Done wave 5 area near 3,836–3,850.
➤ Key levels
◌ Current price area: 4,349
◌ Short-term resistance: 4,360–4,390
◌ Strong support: 4,282–4,300
◌ Next downside level: 4,230
◌ Buy zone wave 4: 4,090–4,110
◌ Main bearish target: 3,836–3,850
◌ Bearish invalidation: above 4,430–4,450
⌁ Elliott Wave view
The chart is showing a possible bearish continuation structure.
Wave (1) started after price rejected from the upper zone.
Wave (2) created a corrective rebound but failed below the descending resistance.
Wave (3) may now continue lower toward 4,230 and 4,096.
Wave (4) could later create a short recovery from the lower buy zone.
Wave (5) may complete the larger bearish cycle near 3,836–3,850.
This is why Kelly does not treat the current bounce as a confirmed bullish reversal. The recovery is still under resistance, and the market needs a strong breakout above the trendline before the bearish wave count becomes weaker.
▸ Trading scenario
Preferred bearish scenario
Entry: Sell on rejection around 4,360–4,390, or after price breaks below 4,282 and retests weakly
Stop Loss: Above 4,450
Take Profit 1: 4,282–4,300
Take Profit 2: 4,230
Take Profit 3: 4,090–4,110
Take Profit 4: 3,836–3,850
Alternative scenario
If gold breaks above 4,430–4,450 and holds above the descending trendline, the bearish setup becomes weaker. In that case, price may attempt a stronger recovery before the next sell setup appears.
◌ Invalidation
The bearish view becomes weaker if gold reclaims 4,430–4,450 with strong bullish momentum. A clean hold above this zone would suggest that the current downside wave is losing strength.
⌁ Kelly’s view
Kelly’s main view for next week remains bearish while gold stays below the descending channel resistance. The structure still favors selling rebounds rather than chasing buys.
If sellers break 4,282–4,300, gold may continue toward 4,230, then 4,090–4,110. The larger Elliott Wave target remains near 3,836–3,850 if bearish momentum extends.
Do you think gold will break strong support next week, or create one more rebound before wave (5) continues lower? Short 
XAUUSD — Sell the Fibonacci Liquidity RetestMarket Pulse
Gold remains under macro pressure after U.S. August PPI rose 0.4% MoM and 5.4% YoY, keeping inflation concerns high. Markets are now pricing roughly a 70% chance of a Fed rate hike next week, while the U.S. 10-year yield is trading close to 5%.
Attention now turns to U.S. CPI later today. Oil has eased from its recent highs, giving Gold some support, but a hotter CPI could quickly bring the dollar and yields back into focus.
What the Chart Says
XAUUSD remains bearish on H1.
Price is still moving below the previous bearish structure after falling from the 4,425–4,436 OB + rejection zone.
The rebound from the 4,300–4,305 support area has now started to lose momentum. Price reached around 4,355 before sellers returned, which keeps the recovery looking corrective rather than a real trend change.
The key area above is 4,360–4,370, where liquidity meets the 0.50 Fibonacci retracement near 4,369.
A slightly deeper recovery could reach the 0.618 Fibonacci near 4,385, but this would still remain inside the bearish retracement structure.
If sellers continue to defend this area, price could rotate back toward 4,320 and later retest the major support around 4,295–4,305.
Levels That Matter
4,425–4,436 — OB + major rejection
4,405–4,410 — Liquidity
4,360–4,370 — Liquidity + 0.50 Fibonacci
4,384–4,390 — 0.618 Fibonacci resistance
4,295–4,305 — Main support
My Main Plan
The main plan remains bearish.
I prefer waiting for a rebound toward 4,360–4,370. If price rejects this area and sellers return with confirmation, Gold could move back toward 4,320 first.
A clean continuation lower may then bring 4,295–4,305 back into focus.
What I Need to See
I want the recovery to stay below the Fibonacci resistance and form another lower high.
A sustained H1 move above 4,390 would weaken the immediate bearish setup. A stronger recovery above 4,410 would suggest that buyers are gaining more control.
Final Read
The H1 trend still favors sellers. The current bounce looks more like a retracement than a confirmed reversal.
For now, I prefer selling the rebound rather than chasing price near support, especially with U.S. CPI likely to bring higher volatility later today. Short 
XAUUSD — Sell the H1 Fibonacci RetestFundamental Analysis
Gold remains under macro pressure after U.S. August PPI rose 0.4% MoM and 5.4% YoY, reinforcing concerns that energy-driven inflation is becoming more persistent. Markets are now pricing roughly a 70% probability of a 25 bp Fed hike next week.
Attention now turns to U.S. CPI later today. Brent has eased toward $105 after briefly approaching $110, while the U.S. 10-year yield remains close to 5%. A hotter CPI could strengthen the dollar and yields further, while softer inflation may trigger a stronger gold rebound.
Technical Analysis
On H1, XAUUSD is trading near 4,345 after recovering from the 4,300.80 low. However, the broader structure remains bearish beneath the descending resistance trendline.
The key decision area is 4,348–4,376, where Fibonacci 0.618–1.0, previous structure, and the marked sell zone overlap. A corrective recovery into this region followed by rejection would favor another bearish leg.
If sellers regain control, downside targets sit near 4,330, 4,318, and ultimately the 4,300–4,305 liquidity low.
A stronger recovery could first test the upper 4,395–4,405 FVG, but acceptance above this area would weaken the immediate bearish thesis.
Important Key Levels
4,395–4,405 — Upper FVG
4,360–4,376 — Main sell zone
4,347–4,350 — Fib 0.618 / pivot
4,329–4,330 — First support
4,318–4,320 — Secondary support
4,300–4,305 — Main downside target
Trading Scenario
Main Sell Setup
Entry: 4,360–4,376
Stop Loss: 4,392
Take Profit 1: 4,330
Take Profit 2: 4,318
Take Profit 3: 4,300–4,305
Sell Condition
Wait for bearish confirmation inside the sell zone. A rejection wick, bearish engulfing candle, failed reclaim above 4,376, or H1 close back below 4,348 could confirm renewed seller pressure. A sustained break above 4,395–4,405 would invalidate the immediate sell setup.
Overall View
The H1 bias remains bearish while XAUUSD stays below 4,376 and the descending trendline. The preferred plan is to avoid chasing shorts around current price and wait for a corrective rebound into 4,360–4,376. If sellers defend this area, gold could rotate back toward 4,330 → 4,318 → 4,300.
Will CPI trigger the retest into 4,360–4,376 before sellers attack 4,300 again? Short 
ETN: Decisive Structural Breakout from Multi-Month RangeThe Setup (Bias): I am taking a LONG bias on Eaton Corporation, PLC (ETN) on the weekly timeframe.
The "Why" (Technical Reasons): 1. Major Resistance Breakout: The price has powerfully broken out of a wide, multi-month consolidation range, decisively clearing the heavy historical resistance at $394.28.
2. Extreme Bullish Momentum: The breakout is driven by a massive, full-bodied green weekly candle closing near its absolute high. This indicates immense institutional buyer demand and a complete lack of selling pressure at these new levels.
Trade Plan (Entry & Exits): * Entry: Momentum traders can look for entries near the current market price of $423.92 to ride the aggressive wave. A safer, more conservative approach would be placing limit orders to catch a potential pullback or retest of the $394.28 to $400.00 zone, looking for old resistance to flip into new support.
Take Profit (Target): With the stock entering price discovery and showing extreme momentum, the next major psychological targets are $450.00, followed by $475.00.
Stop Loss: Placed safely below the lower support boundary of the recent swing, around $370.00. A weekly close below this level would indicate a false breakout and invalidate the bullish thesis.
Duration: Because this analysis is built on a 1-Week chart, this is a longer-term swing trade designed to play out over the coming weeks to months.  Long
Long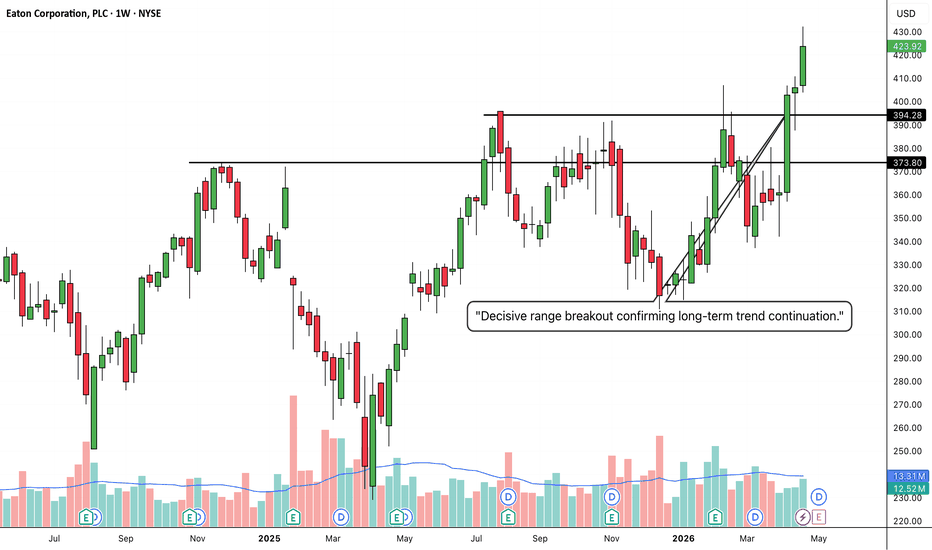
VTL: Explosive Macro Breakout From Multi-Year BaseThe Setup (Bias): I am taking a LONG bias on Vardhman Textiles Limited (VTL) on the macro monthly (1M) timeframe.
The "Why" (Technical Reasons): 1. Historic Structural Breakout: The price has forcefully broken out of a massive, multi-year consolidation phase (resembling a large cup and handle pattern). It has decisively cleared the heavy historical resistance ceiling at the 553.30 level, a supply zone that has capped the stock since late 2021.
2. Extreme Bullish Momentum: The breakout is confirmed by an explosive, nearly full-bodied green monthly candle pushing aggressively into new territory. This type of impulsive price action on a monthly chart indicates immense, sustained institutional buying pressure and a complete structural shift to the upside.
Trade Plan (Entry & Exits): * Entry: Momentum and position traders can look for entries near the current market price of 597.60 to capture the immediate phase transition. A safer, lower-risk approach would be scaling in on a potential monthly pullback to retest the 553.30 to 560.00 breakout zone, letting that old historical ceiling prove itself as a new support floor.
Take Profit (Target): With the stock breaking out of a massive multi-year base into blue skies, the momentum can carry it significantly higher. The next major psychological targets are the 650.00 milestone, followed by 750.00.
Stop Loss: Placed safely below the recent consolidation block prior to the breakout, around the 450.00 to 475.00 level. A monthly close back below the 553.30 structural level would be an early warning sign of a failed macro breakout.
Duration: Because this analysis is built on a massive 1-Month chart capturing a multi-year breakout, this is a long-term position trade designed to play out over the coming months to years.  Long
Long
EWBC: Textbook Break & Retest with Bollinger Band ConfluenceThe Setup (Bias): I am taking a LONG bias on East West Bancorp, Inc. (EWBC) on the weekly timeframe.
The "Why" (Technical Reasons): 1. Perfect Structural Retest: After a massive rally that broke through the major structural ceiling at 110.22, the price naturally exhausted and pulled back. Instead of failing, it perfectly retested this exact 110.22 level, proving that this historical resistance has officially flipped into a rock-solid support floor.
2. Indicator Confluence: By applying Bollinger Bands, we can see a beautiful alignment. The pullback didn't just test horizontal support; it perfectly tapped the middle Bollinger Band (the 20 SMA mean). The fact that buyers aggressively stepped in right at this dual-support zone confirms a highly robust, sustainable macro uptrend.
Trade Plan (Entry & Exits): * Entry: Momentum traders can look for entries near the current market price of 124.92 to capture the confirmed continuation bounce. A safer approach would be placing limit orders to catch any minor daily pullbacks toward the 115.00 to 120.00 zone.
Take Profit (Target): With the structure confirmed and the stock pushing back toward the upper band, the immediate target is the recent swing high around 130.00. Once cleared, the stock enters fresh territory with major psychological targets at 140.00 and 150.00.
Stop Loss: Placed safely below the recent retest candle's wick and the middle Bollinger Band, around the 105.00 level. A weekly close back below the 110.22 structural level would indicate a failed retest and invalidate the immediate bullish setup.
Duration: Because this analysis is built on a 1-Week chart capturing a continuation setup, this is a medium-to-longer-term swing trade designed to play out over the coming weeks to months.  Long
Long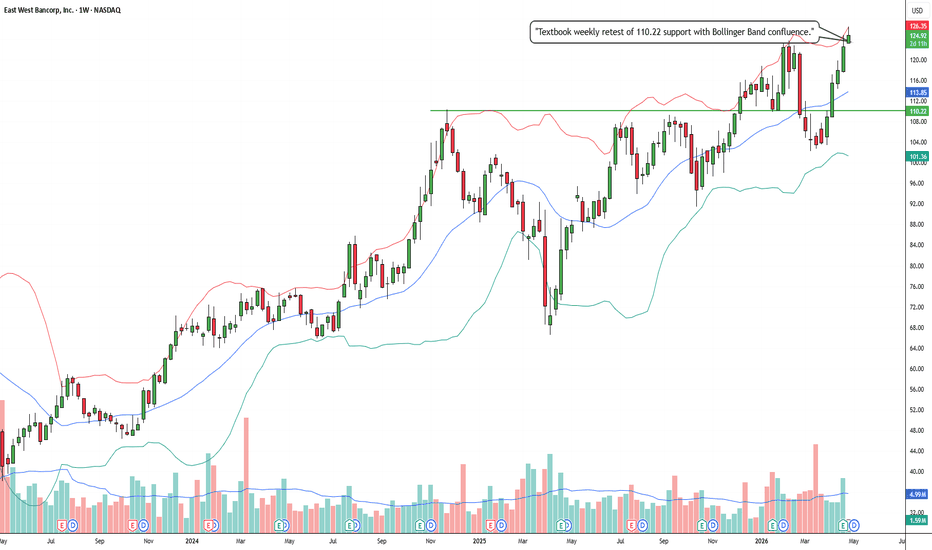
RPRX: Explosive Macro Breakout and Multi-Year ReversalThe Setup (Bias): I am taking a LONG bias on Royalty Pharma plc (RPRX) on the macro monthly (1M) timeframe.
The "Why" (Technical Reasons): 1. Historic Structural Reversal: Zooming out to the monthly timeframe reveals the true magnitude of this turnaround. After a prolonged downtrend into a clearly defined accumulation box at the lows, the price has mounted a massive V-shaped/rounding recovery. It has now forcefully broken out, cleanly slicing through the heavy macro resistance ceiling at 46.71.
2. Volatility Expansion: By applying Bollinger Bands, we can see a beautiful volatility expansion. The upper band is opening up rapidly as the price rides it higher, confirming that this breakout is backed by extreme momentum and aggressive institutional buying pressure. Sellers have been completely absorbed.
Trade Plan (Entry & Exits): * Entry: Momentum and position traders can look for entries near the current extended market price of 49.54 to capture the aggressive phase transition. A safer, lower-risk approach would be waiting for the momentum to cool and placing limit orders to catch a potential monthly pullback to retest the 46.71 breakout zone, letting that old macro ceiling prove itself as a new floor.
Take Profit (Target): With the stock breaking out into fresh territory with this much monthly momentum, the trend can carry it significantly higher. The next major psychological milestones are the 55.00 level, followed by 60.00.
Stop Loss: Placed safely below the middle of the recent monthly structural climb, around the 38.00 to 40.00 level. A monthly close back below the 46.71 structural level would be an early warning sign of a failed macro breakout.
Duration: Because this analysis is built on a massive 1-Month chart capturing a macro trend reversal and continuation, this is a long-term position trade designed to play out over the coming months to years.  Long
Long
UNP: Massive Macro Breakout From Multi-Year Ascending TriangleThe Setup (Bias): I am taking a LONG bias on Union Pacific Corporation (UNP) on the macro monthly (1M) timeframe.
The "Why" (Technical Reasons): 1. Ascending Triangle Breakout: The price has powerfully broken out of a massive, multi-year ascending triangle pattern. After years of buyers continually stepping in at higher prices (indicated by the rising lower trendline), they have finally overwhelmed the sellers and cleared the flat-top historical resistance at $252.27.
2. Macro Bullish Momentum: The breakout is confirmed by a strong, full-bodied monthly green candle. Breaking out of a structural pattern of this size on a monthly chart indicates a high probability of a sustained, long-term trend continuation.
Trade Plan (Entry & Exits): * Entry: Momentum and position traders can look for entries near the current market price of $268.70. A more conservative, lower-risk approach would be scaling in on a potential monthly pullback to retest the $252.27 breakout line, letting that old historic ceiling prove itself as a new floor.
Take Profit (Target): Based on the measured move of a triangle this large, the momentum can carry it significantly higher. The next major psychological target is the $300.00 milestone, followed by $320.00.
Stop Loss: Placed safely below the breakout line and the rising trendline support, around $230.00. A monthly close below this level would invalidate the ascending triangle structure.
Duration: Because this analysis is built on a massive 1-Month chart, this is a long-term position trade designed to play out over the coming months to years.  Long
Long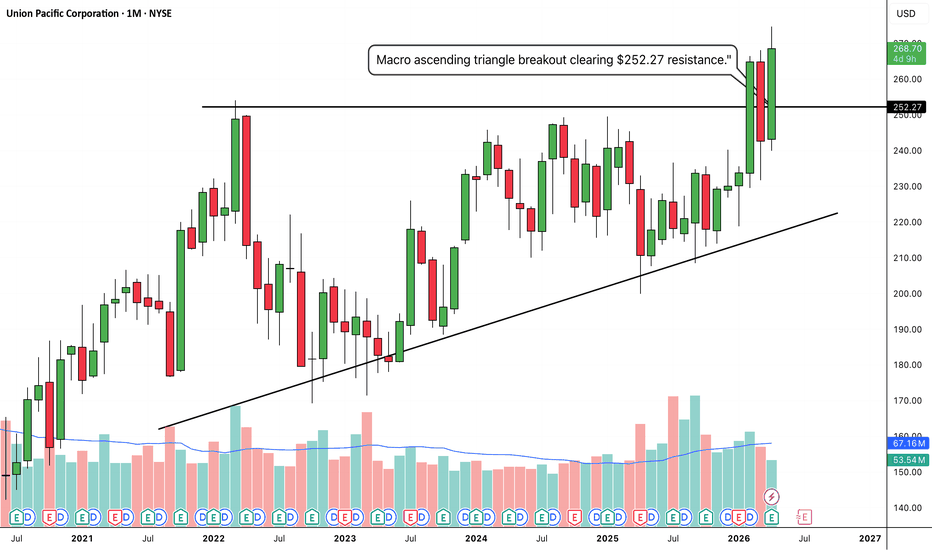
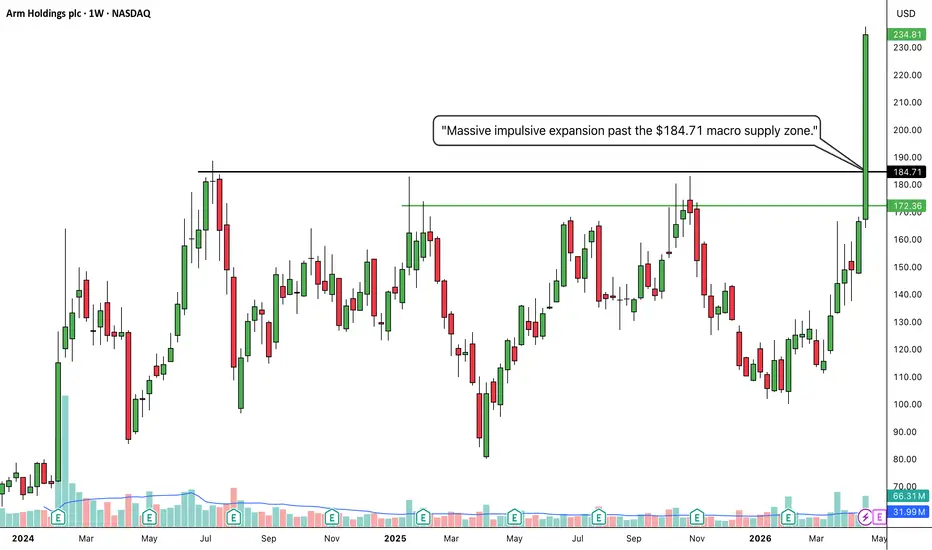
ARM: Explosive Structural Breakout From Multi-Month RangeThe Setup (Bias): I am taking a LONG bias on Arm Holdings plc (ARM) on the weekly timeframe.
The "Why" (Technical Reasons): 1. Major Range Breakout: After a massive, choppy consolidation period spanning back to mid-2024, the price has forcefully broken out of its range. It sliced cleanly through the heavy historical resistance ceiling at $184.71.
2. Extreme Bullish Momentum: The breakout is driven by a gigantic, full-bodied green weekly candle closing near its absolute highs. This type of impulsive, vertical price action indicates aggressive institutional buying and a complete absorption of any overhead supply.
Trade Plan (Entry & Exits): * Entry: Momentum traders can look for entries near the current extended market price of $234.81 to capture the aggressive surge. A safer, lower-risk approach would be waiting for the momentum to eventually cool off and placing limit orders to catch a potential pullback or retest of the $195.00 to $184.71 zone, letting the old ceiling prove itself as a new floor.
Take Profit (Target): With the stock breaking out into fresh blue skies with this much momentum, the next major psychological targets are $250.00, followed by $275.00.
Stop Loss: Placed safely below the green intermediate support line and the breakout origin, around $165.00. A weekly close back below the $184.71 structural level would be an early warning sign of a failed breakout.
Duration: Because this analysis is built on a 1-Week chart, this is a longer-term swing trade designed to play out over the coming weeks to months.  Long
Long
 Long
Long
AMAT: Bullish Continuation and Decisive Breakout Above Key ResisThe Setup (Bias): I am taking a LONG bias on Applied Materials, Inc. (AMAT) on the weekly timeframe.
The "Why" (Technical Reasons): 1. Major Resistance Breakout: The price has forcefully broken out above the recent swing high, cleanly slicing through the established resistance level at $375.15 with a strong, full-bodied green weekly candle.
2. Textbook Stair-Step Trend: This breakout confirms a highly robust macro uptrend. Looking historically, the chart demonstrates a perfect pattern of breaking resistance levels and flipping them into solid support floors (as seen clearly at the $270.29 and $334.74 levels). This structural behavior indicates buyers are consistently in control.
Trade Plan (Entry & Exits): * Entry: Momentum traders can look for entries near the current market price of $417.04 to ride the immediate upside. A more conservative, lower-risk entry would involve placing limit orders to catch a potential pullback/retest of the $375.15 to $385.00 zone, waiting for that old ceiling to prove itself as a new floor.
Take Profit (Target): With the stock entering fresh price discovery and showing excellent relative strength, the next major psychological targets are $450.00, followed by the $500.00 milestone.
Stop Loss: Placed safely below the previous structural support step, around $325.00. A weekly close below the $334.74 base would indicate a breakdown in the current stair-step structure and invalidate the immediate bullish thesis.
Duration: Because this analysis is built on a 1-Week chart, this is a medium-to-longer-term swing trade designed to play out over the coming weeks to months.  Long
Long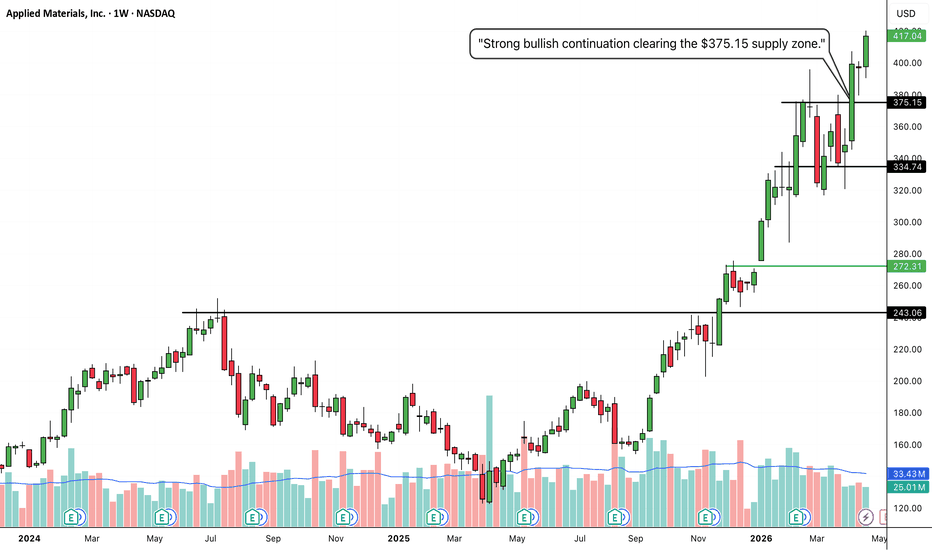
 Long
Long
NUE: Explosive Macro Breakout and Volatility ExpansionThe Setup (Bias): I am taking a LONG bias on Nucor Corporation (NUE) on the macro monthly (1M) timeframe.
The "Why" (Technical Reasons): 1. Historic Structural Breakout: Zooming out to the monthly timeframe reveals the true magnitude of this move. The price has forcefully broken out of a massive, multi-year consolidation base, cleanly slicing through the heavy macro resistance ceiling at 195.07 that has capped the stock for years.
2. Volatility Expansion: By applying Bollinger Bands, we can see a textbook volatility squeeze and subsequent expansion. The bands are opening up rapidly as the price rides the upper band, confirming that this breakout is backed by extreme momentum and aggressive institutional buying pressure.
Trade Plan (Entry & Exits): * Entry: Momentum and position traders can look for entries near the current extended market price of 225.11 to capture the aggressive phase transition. A safer, lower-risk approach would be waiting for the momentum to cool and placing limit orders to catch a potential monthly pullback to retest the 195.00 to 200.00 breakout zone, letting that old macro ceiling prove itself as a new floor.
Take Profit (Target): With the stock breaking out into fresh territory with this much monthly momentum, the trend can carry it significantly higher. The next major psychological targets are the 250.00 milestone, followed by 300.00.
Stop Loss: Placed safely below the middle of the recent monthly consolidation block, around the 160.00 level. A monthly close back below the 195.07 structural level would be an early warning sign of a failed macro breakout.
Duration: Because this analysis is built on a massive 1-Month chart capturing a macro trend continuation, this is a long-term position trade designed to play out over the coming months to years.  Long
Long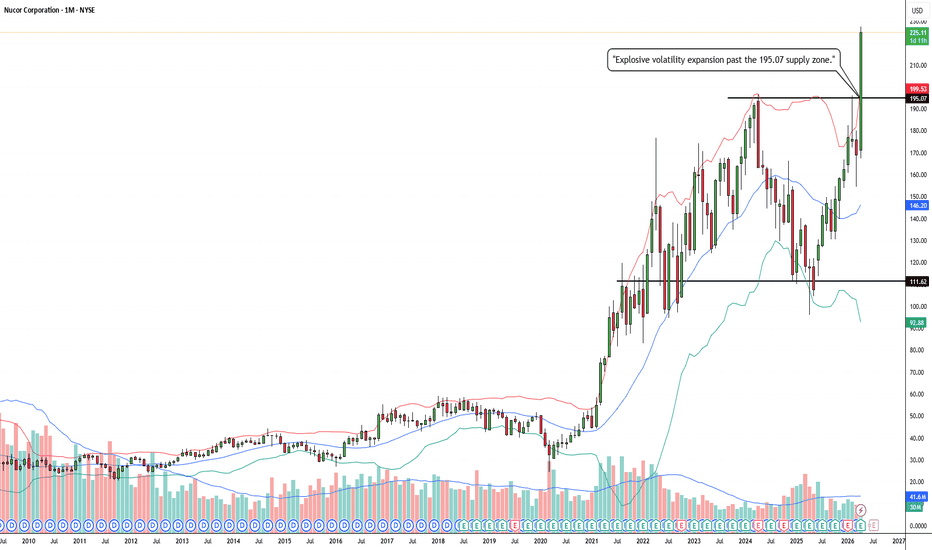
 Long
Long
 Long
Long
DLR: Impulsive Structural Breakout from Long-Term ConsolidationThe Setup (Bias): I am taking a LONG bias on Digital Realty Trust, Inc. (DLR) on the weekly timeframe.
The "Why" (Technical Reasons): 1. Major Range Breakout: After months of choppy consolidation, the price has forcefully broken out of its trading range, slicing through the heavy structural resistance at $187.77.
2. Extreme Bullish Momentum: The breakout candle is a massive, full-bodied weekly green candle closing near its absolute high. This indicates immense buyer demand and a complete lack of selling pressure at these new levels.
Trade Plan (Entry & Exits): 1. Entry: Momentum traders can enter near the current market price of $199.98. A more conservative, lower-risk entry would be placing limit orders to catch a potential retest of the $187.77 level, looking for that old resistance to act as new support.
2. Take Profit (Target): With the stock breaking into fresh territory, the next logical psychological targets are $220.00, followed by $230.00.
3. Stop Loss: Placed safely below the intermediate support level and breakout origin, around $175.00. A weekly close below this level would indicate a false breakout and invalidate the setup.
Duration: Because this analysis is built on a 1-Week chart, this is a longer-term swing trade designed to play out over the coming weeks to months.  Long
Long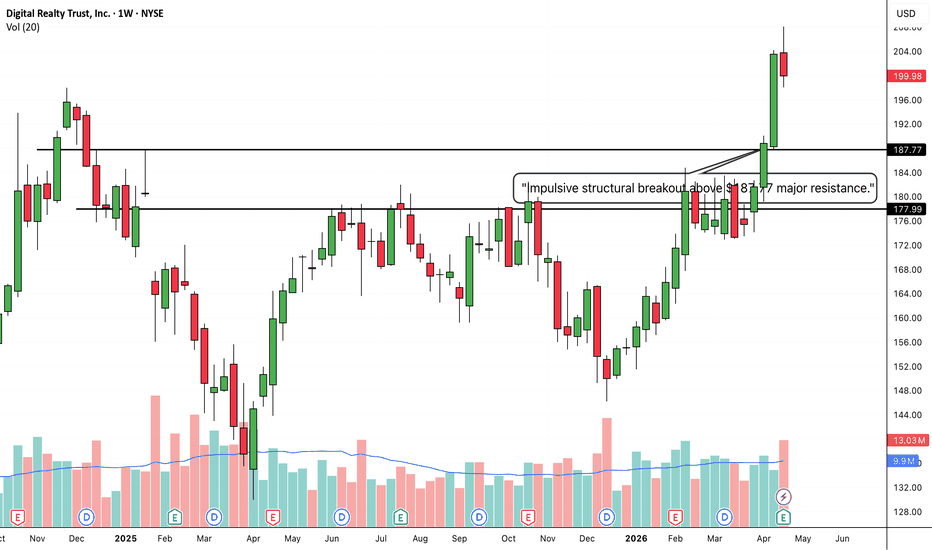
CSX: Stepping Up – Major Resistance Cleared for Trend ContinuatiThe Setup (Bias): I am taking a LONG bias on CSX Corporation (CSX) on the weekly timeframe.
The "Why" (Technical Reasons): 1. Secondary Breakout: The price has cleanly broken through the recent swing-high resistance at $43.11 with a strong, full-bodied weekly candle, indicating aggressive buyer momentum.
2. Textbook S/R Flip: Before this latest push, we saw the price break above the long-term historical resistance at $38.15, pull back to retest it, and bounce perfectly. That prior ceiling is now a confirmed floor, validating the structural strength of this uptrend.
Trade Plan (Entry & Exits): * Entry: Entering near the current market price of $45.41. A more conservative entry would be waiting for a minor daily pullback to retest the $43.11 level as new support.
Take Profit (Target): Riding the momentum into new territory, the next logical psychological targets are $50.00, followed by $55.00.
Stop Loss: Placed below the recent swing low and the previous breakout zone, around $39.50. If the price breaks back below the $40 psychological level, the current upward structure is broken.
Duration: Because this analysis is built on a 1-Week chart, this is a longer-term swing trade designed to play out over the coming weeks to a few months.  Long
Long
 Long
Long