Education
 Short
Short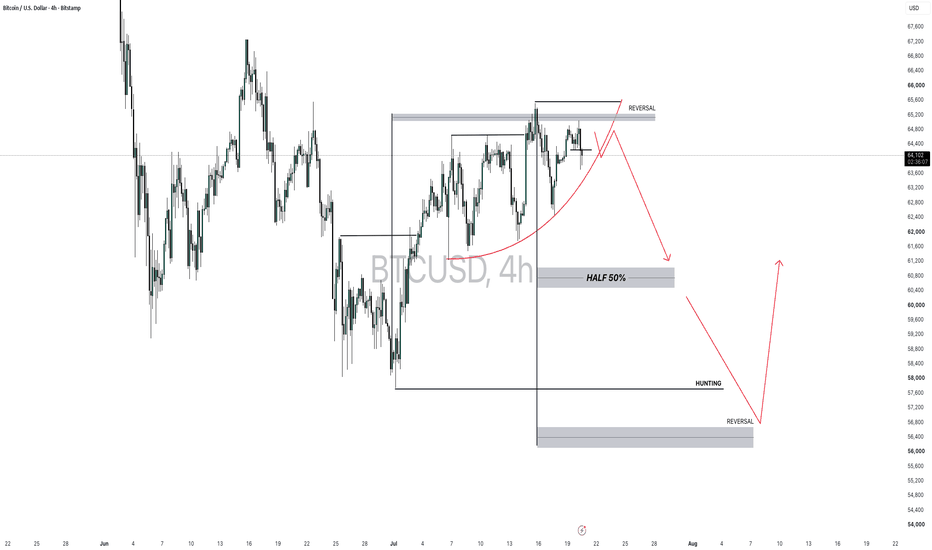
 Long
Long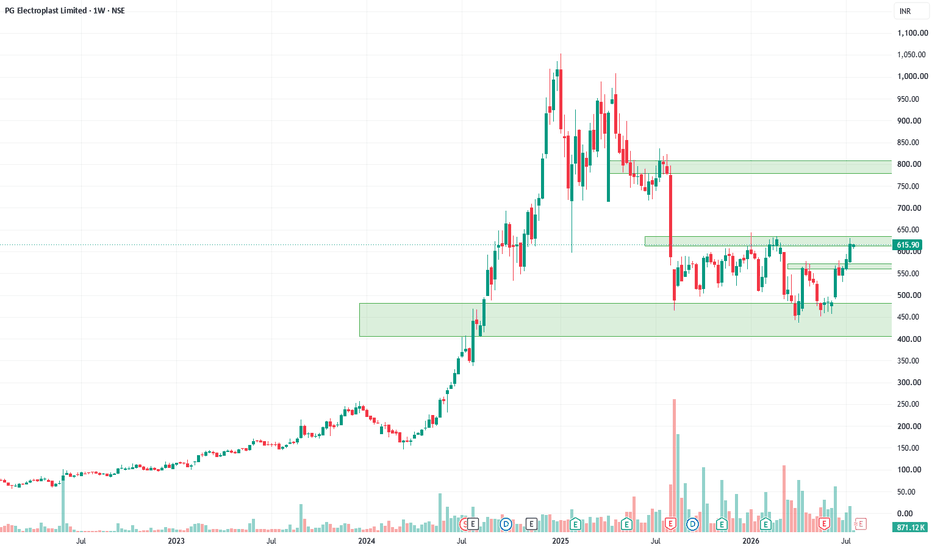
Long 
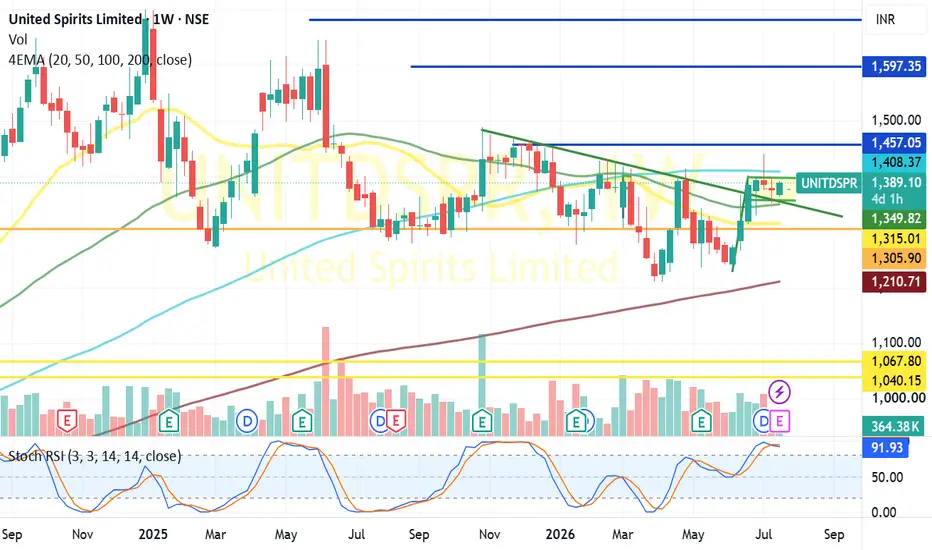
UNITED SPIRIT:Likely Falling Channel Breakout is on the cards?United Spirits:
Trading above all critical moving avaerages in daily chart and even in weekly chart looks stronger.
Possibility for inverse Head & Shoulders developing beneath a multi-month descending trendline, with a confluence of resistance around ₹1,410.
Bullish Trigger
A weekly close above ₹1,410–1,415.
That would:
-complete the inverse Head & Shoulders,
-confirm the trendline breakout,
-move price above the 100-week EMA.
Expected Targets After Confirmation
Target 1: ₹1,455–1,460
Target 2: ₹1,520
Target 3: ₹1,580–1,600(For educational purpose only)  Long
Long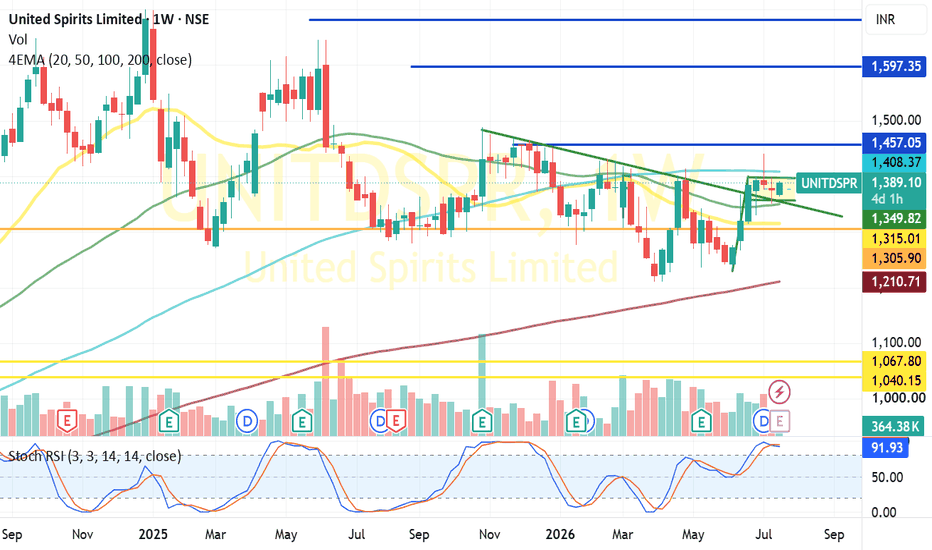
 Long
Long
 Long
Long
BRIAN XAUUSD – GOLD REBOUNDS, BUT SELLERS STILL CONTROL HIGHER BRIAN XAUUSD – GOLD REBOUNDS, BUT SELLERS STILL CONTROL HIGHER VALUE
Gold is recovering slightly from the monthly low area, but this bounce is not strong enough to confirm a bullish reversal.
The market is still trading under pressure as US-Iran tensions and energy-driven inflation concerns keep the USD supported. With the Fed narrative turning more hawkish again, gold remains vulnerable whenever price moves back into higher supply.
This is why I do not see the current rebound as a clean buy trend. It looks more like a value rotation before sellers test the market again.
Volume Profile structure
On the 2H chart, gold has reacted from the Buy Reaction Base around 3,995 - 4,000 and is now moving towards the POC Reclaim Zone near 4,028 - 4,035.
This zone is important because it represents the next value test. If price cannot reclaim and hold above it, the rebound becomes weak and sellers may return from this area.
The Upper Value Target around 4,075 - 4,080 remains the higher liquidity zone. Gold can still reach it if buyers build acceptance above the POC Reclaim Zone, but without that confirmation, the upside remains limited.
Important zones
Buy Reaction Base: 3,995 - 4,000
Lower value support where buyers reacted from the recent low.
POC Reclaim Zone: 4,028 - 4,035
Main decision zone and preferred sell-reaction area.
Upper Value Target: 4,075 - 4,080
Higher resistance if gold reclaims value strongly.
Highest peak of gold: 4,103
Major upside reference if momentum expands.
Trading scenario
Sell reaction from POC Reclaim Zone 4,028 - 4,035
Entry:
Look for sell positions only if price rebounds into 4,028 - 4,035 and shows clear rejection.
Stop Loss:
Above the POC Reclaim Zone or above the local rejection high.
Take Profit:
TP1: 4,000
TP2: 3,980 - 3,985
TP3: Trail lower only if sellers break the lower value base
This setup is based on the idea that gold is rebounding into value resistance, not building a confirmed bullish trend yet.
Final view
Gold can still bounce from the low, but sellers remain active at higher prices.
The key area is 4,028 - 4,035. If gold fails there, the current recovery may turn into another sell opportunity.
If buyers reclaim this zone with strength, then the next target becomes 4,075 - 4,080.
For now, I prefer waiting for price to test the POC Reclaim Zone and react.
Is this rebound real strength, or just another move into supply?
 Long
Long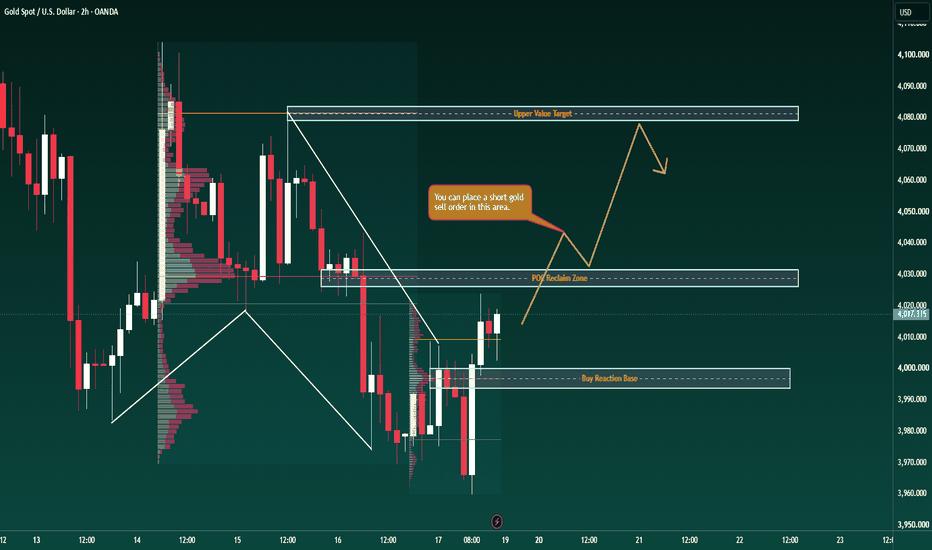
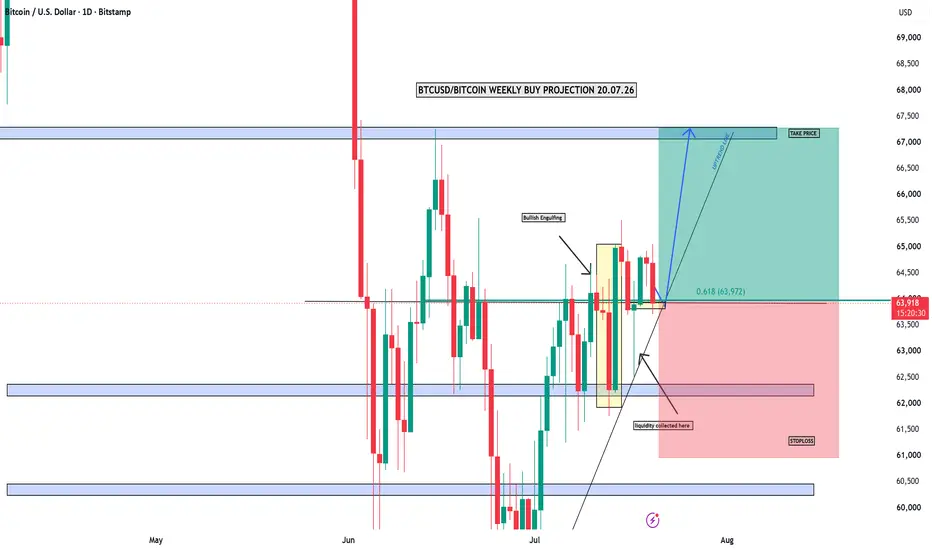
BTCUSD/BITCOIN WEEKLY BUY PROJECTION 20.07.26BTCUSD / Bitcoin Weekly Buy Projection – 20.07.26
Bitcoin is trading near $63,947, where several bullish confirmations are meeting:
The 0.618 Fibonacci retracement level is around $63,972.
Price is respecting the ascending trendline.
A previous downside move collected liquidity near the $62,000–$62,400 support zone.
After the liquidity sweep, a bullish engulfing candle formed, indicating strong buyer reaction.
Trading Projection
Buy Zone: $63,800–$64,000
Take-Profit Zone: $67,000–$67,300
Stop-Loss: Below $60,900
The bullish projection remains valid while price holds above the trendline and the major support zone. A strong breakout above $65,000 could provide additional confirmation for a move toward $67,000+. Long 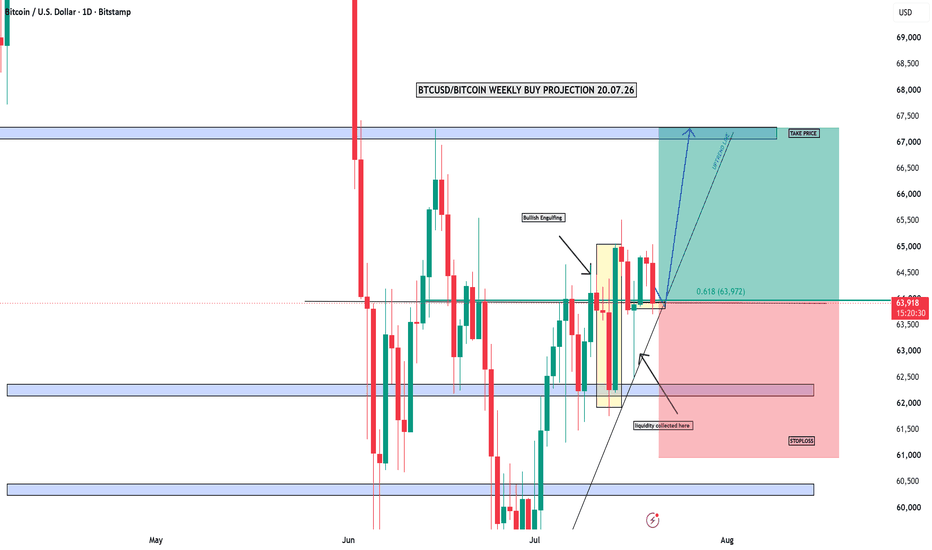
 Short
Short
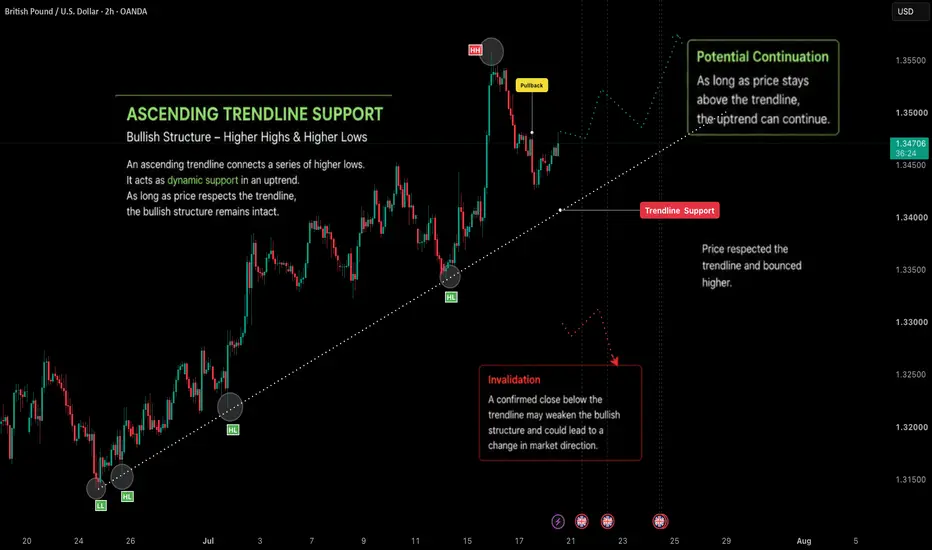
Ascending Trendline Support📌 Overview
An Ascending Trendline is a technical analysis tool used to identify a series of higher lows during an uptrend. In this chart, price has respected the trendline multiple times, indicating that buyers have continued to defend the rising support area. The latest bounce from the trendline suggests that the current bullish structure remains intact while price stays above this dynamic support.
___________________________________________________________
📘 Definition
An Ascending Trendline is created by connecting two or more higher lows during an uptrend. It acts as dynamic support and helps visualize the direction of the prevailing trend.
• Higher Lows – Each higher low indicates that buyers are stepping in at progressively higher prices.
• Trendline Support – The ascending trendline connects these higher lows and represents a dynamic support level.
• Pullback – Temporary declines toward the trendline are common during an uptrend and may offer insight into market strength.
• Bullish Bounce – A positive reaction from the trendline suggests that buyers continue defending the support zone.
• Higher High – After a successful bounce, price may continue creating higher highs, maintaining the bullish structure.
• Invalidation – A confirmed close below the trendline may weaken the current trend structure and indicate that buying momentum is decreasing.
___________________________________________________________
📌 Key Points
• The trendline connects multiple higher lows.
• Price has respected the trendline on several occasions.
• The latest pullback found support near the trendline.
• As long as price remains above the trendline, the bullish structure remains intact.
• A confirmed break below the trendline may indicate a potential change in market structure.
___________________________________________________________
📊 Chart Explanation
• The chart begins with a series of higher lows, establishing an ascending trendline.
• Price continues making higher highs while respecting the rising support.
• After reaching a new high, price experiences a normal pullback toward the trendline.
• The latest bounce from the trendline demonstrates that buyers continue defending the dynamic support area.
• The projected path illustrates one possible continuation scenario if price continues respecting the trendline. This projection is for educational purposes only and does not predict future market movement.
___________________________________________________________
📉 Summary
This chart demonstrates how an Ascending Trendline can help visualize an uptrend by connecting higher lows. The repeated respect of the trendline highlights continued buying interest, while future price action will determine whether the bullish structure continues or becomes invalidated.
___________________________________________________________
💡 Why It Matters
• Helps identify the direction of the prevailing trend.
• Highlights dynamic support levels during an uptrend.
• Encourages traders to wait for price confirmation rather than anticipating moves.
• Can be combined with price action, support and resistance, and other technical tools for additional market context.
___________________________________________________________
📌 Conclusion
Ascending Trendlines provide a simple way to understand market structure and trend direction. Like any technical analysis tool, they are most effective when combined with confirmation and sound risk management rather than being used in isolation.
___________________________________________________________
⚠️ Disclaimer
📘 For educational purposes only.
🙅 Not SEBI registered.
❌ Not a buy/sell recommendation.
🧠 Purely a learning resource.
📊 Not Financial Advice XAUUSD (M30) | Will Gold Sweep Demand Before the Next Expansion?Gold remains trapped beneath a well-respected descending trendline, keeping the broader intraday order flow tilted to the downside. Despite the recent recovery, price has yet to reclaim the previous swing high, suggesting buyers are still struggling to regain control.
From an ICT / Smart Money perspective, price is currently reacting around a bullish Order Block near 4,000-4,005, while a stronger First Demand rests around 3,985-3,990. A liquidity sweep into these zones would be consistent with institutional accumulation before any meaningful expansion.
Overhead, the Premium FVG around 4,030-4,035 aligns with the descending trendline and remains the primary supply area. Unless this confluence is decisively broken, rallies may continue to serve as liquidity collection rather than confirmed bullish continuation.
Trading Scenarios
Bullish: A sweep into 4,000-3,990, followed by a strong MSS/CHOCH, could open the path toward 4,030, then 4,060.
Bearish: Failure to defend the Order Block would expose the deeper demand below 3,990, extending the corrective decline.
With a relatively light U.S. economic calendar today, price action may remain technically driven. Watch for liquidity grabs around the marked institutional zones rather than chasing impulsive moves.
Key Levels
🟢 Demand: 4,000-4,005
🟢 Major Demand: 3,985-3,990
🔴 Premium FVG: 4,030-4,035
📉 Bias: Neutral-to-Bullish above demand, bearish below 3,985.
This analysis is for educational purposes only and reflects an ICT/Smart Money framework, not financial advice. Long 
Long 
XAUUSD — 4,035 Is the Reload Zone XAUUSD — 4,035 Is the Reload Zone
Gold is starting the week with that heavy feeling still sitting on the chart, almost like every bounce is being used to ask the same question: are buyers strong enough, or are they just giving sellers a better price?
Price is holding around the 4,000 area after a weak recovery from 3,982.995, but the bounce has not changed the bigger structure yet. The chart is still printing lower reactions, and the move into the Fibo zone around 4,020 - 4,040 looks more like a retracement than a real reversal. For newer traders, this is the part to slow down: when price drops hard, then climbs back into a 0.5 - 0.618 area without breaking structure, that zone can become a reload area for sellers.
That is why my main view is bearish while gold stays below 4,054.121. The wider pressure also supports that idea, with USD demand still firm as geopolitical tension keeps the market defensive. Gold may still bounce in small waves, but unless it can reclaim 4,054.121 and then push toward 4,072.676, the recovery looks limited.
The main smart money thesis here is simple: price may be breathing into the Fibo zone before hunting lower liquidity again. If sellers reject 4,020 - 4,040 and gold breaks below 3,982.995, the next downside magnet becomes 3,927.583.
This bearish idea becomes weak only if gold reclaims 4,054.121 cleanly and holds above it. A stronger invalidation would be price moving back into the order block and liquidity zone around 4,080 - 4,100.
Key price zones to watch
Current reaction area: 4,000 - 4,020
Main supply / Fibo reload zone: 4,020 - 4,040
Bearish confirmation zone: clean break below 3,982.995
First downside liquidity target: 3,960
Main downside target: 3,927.583
Upper resistance if sellers weaken: 4,054.121
Major order block + liquidity zone: 4,080 - 4,100
Invalidation: clean reclaim above 4,054.121, stronger above 4,100
Do you see this bounce as a real recovery attempt, or just a Fibo pullback before gold hunts 3,927?
Short 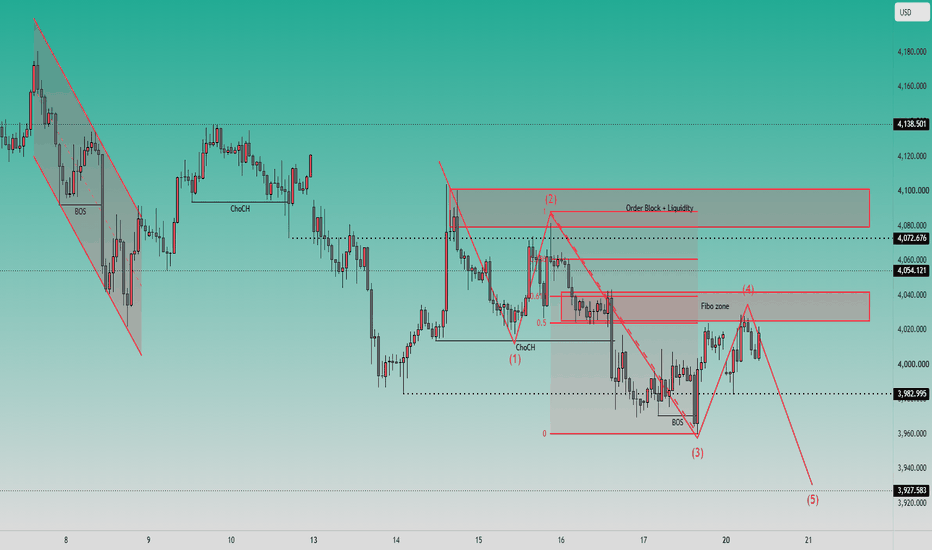
XAUUSD — Sell the 4,020–4,030 RetestFundamental Analysis
Gold remains sensitive to USD momentum, Treasury yields, and shifts in Fed rate expectations. Softer U.S. data could support a short-term recovery, but renewed dollar strength may keep the broader pressure tilted to the downside.
Technical Analysis
On the 1H chart, XAUUSD is trading near 4,004.55 below the marked 4,020–4,030 resistance zone. This area previously acted as support and may now become a sell zone after the breakdown. If price recovers into this region and fails to reclaim it, bearish continuation could target the strong support at 3,982.80 before extending toward the descending trendline near 3,925–3,930.
Important Key Levels
Current price: 4,004.55
Main sell zone: 4,020–4,030
Short-term support: 3,982.80
Short-term resistance: 4,020–4,030
Liquidity area: 4,090–4,108
Main target: 3,925–3,930
Invalidation: above 4,044.50
Trading Scenario
Main Sell Setup
Entry: 4,020–4,030
Stop Loss: 4,044.50
Take Profit 1: 3,982.80
Take Profit 2: 3,960
Take Profit 3: 3,925.80
Sell Condition
Wait for price to retest the 4,020–4,030 zone and show bearish rejection. A long upper wick, bearish engulfing candle, failed reclaim, or 1H close back below the zone may confirm seller pressure. If price breaks and holds above 4,044.50, the sell setup is no longer valid.
Overall View
The main bias remains bearish while XAUUSD stays below the former support zone and continues to respect the broader descending structure. The preferred plan is to wait for a recovery into 4,020–4,030 rather than chase price near current levels, with 3,982.80 as the first reaction area and 3,925.80 as the main downside target.
Do you also see 4,020–4,030 as the key sell zone, or are you waiting for a deeper liquidity sweep first? Short 
 Long
Long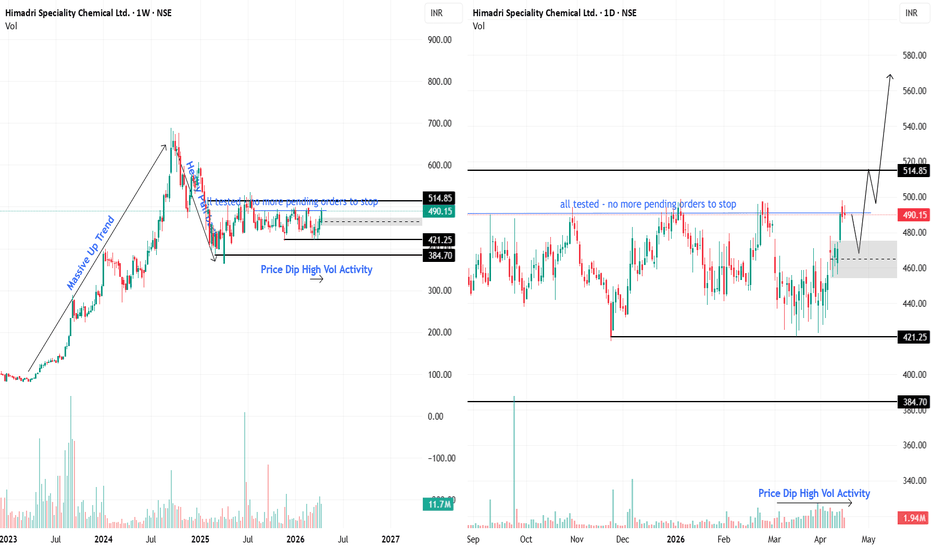
Mahindra & Mahindra
R1: ₹3,180–3,200
R2: ₹3,280
R3: ₹3,350
Major Resistance: ₹3,450–3,500
Support Levels
S1: ₹3,120
S2: ₹3,060
S3: ₹3,000
Major Support: ₹2,900
Trading Setup
Bullish
Above ₹3,200 → Target ₹3,280
Above ₹3,280 → Target ₹3,350
Above ₹3,350 → Target ₹3,450–3,500
Bearish
Below ₹3,120 → Target ₹3,060
Below ₹3,060 → Target ₹3,000
Below ₹3,000 → Target ₹2,900
Key Level to Watch
₹3,200 is the immediate breakout level. A strong hourly close above it can trigger fresh upside momentum. Until then, expect consolidation between ₹3,120–3,200.  Long
Long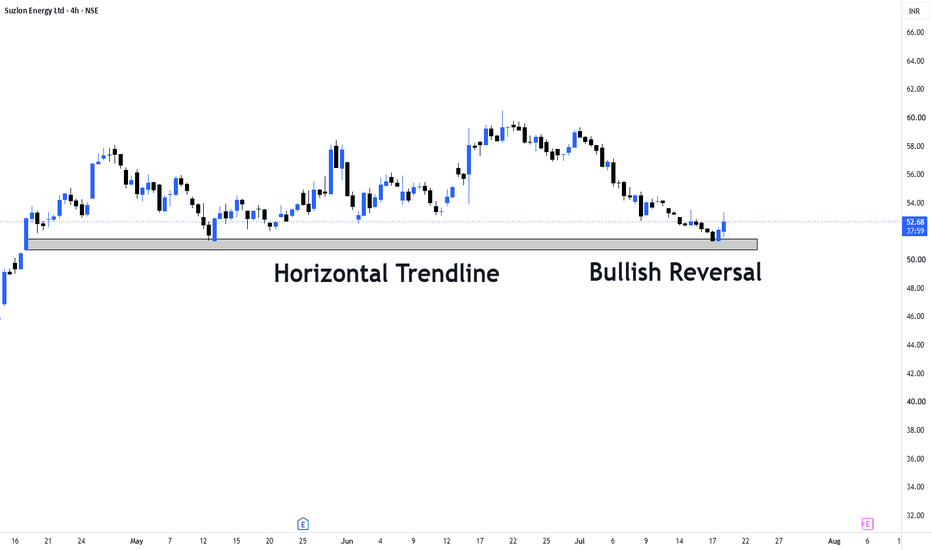
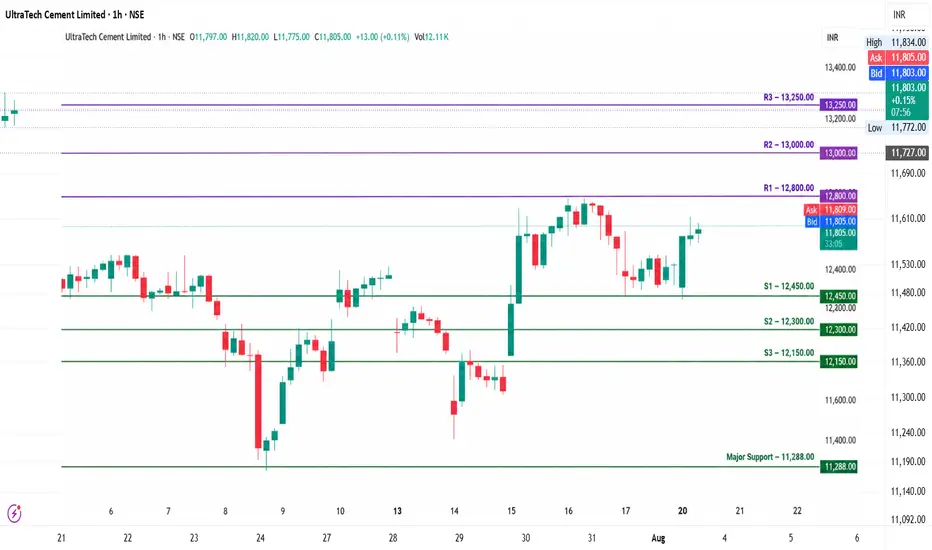
ULTRACEMCOKey Support Levels
S1: ₹12,450–12,500
S2: ₹12,300–12,350
S3: ₹12,100–12,150 (strong demand zone)
Key Resistance Levels
R1: ₹12,780–12,820
R2: ₹12,950–13,000
R3: ₹13,100–13,250 (major breakout zone)
Trading Plan
Bullish Scenario
Buy only after a strong daily close above ₹12,800 with good volume.
Targets:
🎯 T1: ₹12,950
🎯 T2: ₹13,100
🎯 T3: ₹13,300
Bearish Scenario
If price breaks below ₹12,450, expect profit booking toward:
₹12,300
₹12,150
₹12,000
Swing Trading View
Bias: Bullish above ₹12,450
Stop Loss: Below ₹12,300 (for swing traders)
Watch for volume expansion on a breakout above ₹12,800. A weak breakout without volume has a higher chance of failing.