Nifty 500 at a Critical Juncture — Oversold, But We Wait for ConDear Investors and Traders
The current correction in the market is testing the patience of investors—but this is exactly where discipline and a well-defined system matter the most.
The Nifty 500 is now near the lower end of its rising channel, while RSI has fallen below 20 and is approaching levels seen during the COVID correction.
At the same time, Nifty 500 X% breadth has fallen to 14.40. Historically, when this breadth indicator has moved below 10, the market has entered a zone that has often been associated with a subsequent bottoming process. In the historical observations we are tracking, the average 20-day forward return from such instances has been around 5%.
But oversold does not automatically mean bottom.
What are we watching now?
Along with oversold RSI and breadth, we want to see a daily reversal pattern before concluding that the market is actually bottoming.
Some patterns we are watching:
🟢 Bullish Engulfing
⭐ Morning Star
🔨 Hammer
📈 Piercing Line
Until such confirmation appears, patience remains important.
What about Smallcap & Microcap?
The sharp correction witnessed yesterday in Smallcap and Microcap, which had been among the stronger segments since April, can be viewed as a phase of mean reversion.
Markets and market-cap segments do not move in a straight line.
A segment can lead for months, enter an extended phase, experience mean reversion, consolidate, and eventually regain strength.
This is why rotation is an essential part of systematic investing.
And this is where SSSS stays focused.
At SSSS, we are focused on the SYSTEM.
We take our entries and exits based on the concepts and rules we have developed, rather than reacting to short-term market noise.
If a stock or segment loses its strength, the system tells us what to do.
If another segment starts showing strength, the system helps us identify where the opportunity is emerging.
The objective is not to predict every market top or bottom.
The objective is to participate in trends while managing the phases when trends temporarily weaken.
Corrections like the current one are part of the market cycle.
If you are following a system, follow it as it is designed.
Don't change the rules because of a few difficult days.
Don't expect Midcap, Smallcap or Microcap to keep outperforming forever.
Every sector. Every market-cap segment. Every stock goes through phases.
Our job is to rotate according to the system—not according to our emotions.
Discipline creates wealth, not predictions.
Stay patient. Stay systematic.
The next opportunity will come from strength—not from guessing the bottom.
Regards,
Nishesh Jani,CFTe
#SSSS #Nifty500 #MarketUpdate #technicalAnalysis #oversold #breadthanalysis #tradingDiscipline #FollowTheSystem #stockMarketIndia #investingindia #riskManagement NSE:NIFTY 500 OLAELEC: Daily Cup & Handle Breakout1. The Macro Perspective: The Massive Cup Formation
I am taking a LONG bias on Ola Electric Mobility Limited (OLAELEC) on the daily (1D) timeframe
When analyzing pure market structure on an EV sector momentum stock, extended accumulation patterns like the classical Cup and Handle are essential to absorb supply and build kinetic energy. Following a steep vertical flagpole rally from the mid-20s up to the 42.00 region in early April, the stock underwent a necessary rounding correction, carving out the massive "Cup" structure visible on the chart. This multi-week digestion phase allowed institutional capital to systematically accumulate shares at lower valuations near the 34.00 structural floor. Documenting these classical accumulation bases makes the charting workflow highly repeatable and easy to understand for new trainees joining the research desk. Fundamentally, this fierce technical momentum aligns seamlessly with the continued acceleration and capital inflows within the electric vehicle space.
2. The Educational Setup: The Handle and Resistance
To understand the technical validity behind this macro launch, look closely at how the price structure interacted with its core boundaries:
The 42.00 Resistance Ceiling: The definitive line in the sand for a bullish structural breakout was the dotted black horizontal resistance line drawn at 42.00. This level marked the absolute lip of the cup formation, acting as a heavy supply zone that rejected the initial breakout attempt in late May.
The Handle Formation: Following that initial rejection at the 42.00 ceiling, the price experienced a healthy, localized rounding pullback down toward the 39.00 level. This tight, shallow correction formed the "Handle" of the pattern, squeezing volatility and acting as a dynamic launchpad.
3. Current Price Action: Breakout and Volatility Expansion
Look at the massive daily candle on the far right of the chart. The structural pressure cooker has officially exploded. Institutional buyers have stepped in with undeniable conviction, backed by a massive volume expansion. The stock printed a towering, full-bodied green expansion candle that has vertically surged to close at 43.74 (+9.82% on the session). This explosive thrust has decisively obliterated the 42.00 macro ceiling. The stock has officially transitioned out of accumulation and into a highly explosive markup trend into fresh territory.
Note: Always ensure the exchange's End of Day (EOD) data files have fully synchronized before confirming the final daily close shape. It is best practice to wait until after 9:00 PM to account for any delayed Indian market data synchronization, ensuring there are no visual discrepancies or data glitches before finalizing the workflow.
4. The Trade Plan: Entries, Targets, and Risk Management
Entry Strategy: Momentum is exceptionally strong with the stock trading vertically out in the open above the breakout line. Chasing an extended daily breakout candle carries a minor risk of a short-term mean-reversion pullback. The highest-probability entry strategy involves waiting for the initial vertical excitement to cool off. Look to scale into long positions on a potential structural pullback that perfectly retests the broken 41.50 to 42.50 prior resistance zone. Letting old historical resistance prove itself as a concrete new support floor provides an unmatched risk-to-reward ratio.
Take Profit (Targets): We use a classical measured move strategy based on the structural depth of the cup pattern. By taking the depth of the cup (roughly 8 points from the structural floor near 34.00 up to the 42.00 ceiling) and projecting it upward from the breakout point, our primary structural macro target sits comfortably in the 49.00 to 51.00 zone over the coming weeks.
Invalidation (Stop Loss): An explosive breakout thesis is completely invalidated if the price fails to hold its newly claimed structural floor and collapses back inside the core of the handle boundary. A hard stop loss should be placed safely below the recent handle swing low, specifically around the 38.00 to 39.00 level. A definitive daily close completely back below 38.00 would act as a severe warning sign of a failed macro breakout and a major bull trap.
5. Time Horizon:
Because this technical setup is built on a 1-Day chart capturing a clear structural phase transition and a textbook cup and handle breakout, this is a high-alpha swing trade designed to capture a rapid momentum markup phase over the coming weeks. Let the trend run!  Long
Long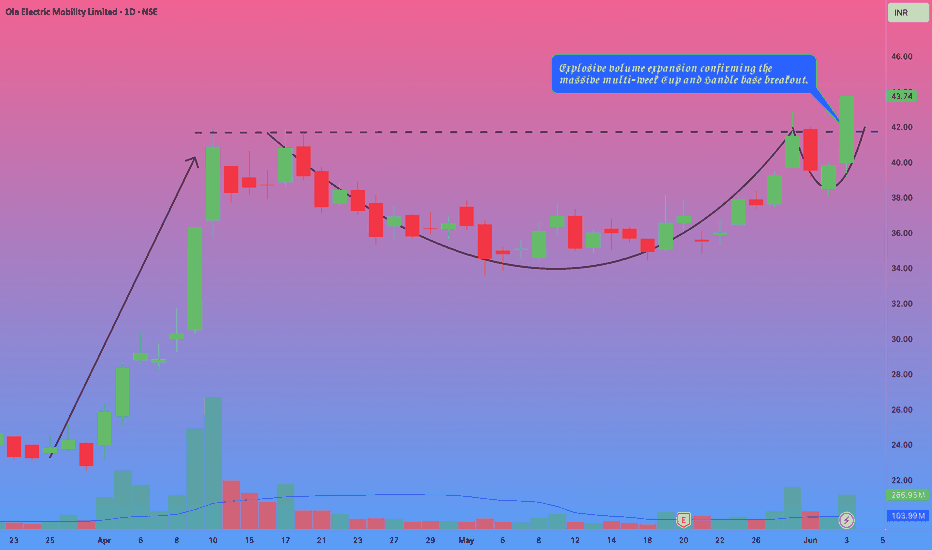
RRKABEL: Monthly Macro Range Breakout1. The Macro Perspective: The Multi-Year Accumulation Base
I am taking a LONG bias on RR Kabel Ltd. (RRKABEL) on the macro monthly (1M) timeframe
When analyzing pure market structure on a high-timeframe chart, extended accumulation bases are critical for initiating the next leg of a secular markup. Following its previous peak in late 2023, the stock entered a massive, prolonged structural consolidation phase spanning well over two years. This massive "U-shaped" rounding base effectively absorbed overhead supply, allowing institutional capital to quietly accumulate shares at steady valuations near the 1,100.00 structural floor. Documenting these classical macro accumulation bases makes the charting workflow highly repeatable for anyone analyzing long-term momentum shifts.
2. The Educational Setup: Horizontal Resistance & Structural Floor
To understand the technical validity behind this macro launch, look closely at how the price structure interacted with its core boundaries prior to breaking out:
The 1,799.25 Resistance Ceiling: The definitive line in the sand for a bullish structural shift was the solid white horizontal resistance line drawn exactly at 1,799.25. This level established a massive supply zone that systematically capped upward momentum and rejected multiple attempts to reclaim all-time highs.
The Accumulation Floor: During the multi-year consolidation, buyers heavily defended the lower bounds near the 1,100.00 area. This persistent defense established a concrete structural floor, flushing out weak hands and building immense kinetic energy for the eventual breakout.
3. Current Price Action: Breakout and Volatility Expansion
Look at the most recent monthly candle on the far right of the chart. The structural pressure cooker has officially exploded. Institutional buyers have stepped in with undeniable conviction. The stock printed a towering, full-bodied green expansion candle that has decisively obliterated the 1,799.25 multi-year ceiling, currently trading incredibly strong near 2,155.90. The stock has officially transitioned out of macro accumulation and into a highly explosive markup trend into fresh blue-sky territory.
Note: Because this is a monthly timeframe, the final shape of the breakout candle is subject to the monthly close. Ensure all end-of-month data has fully synchronized before officially confirming the breakout structure.
4. The Trade Plan: Entries, Targets, and Risk Management
Entry Strategy: Macro momentum is exceptionally strong with the stock trading vertically out in the open above the pivotal breakout line. Chasing an extended monthly breakout candle carries a minor risk of a lower-timeframe mean-reversion pullback. The highest-probability, lowest-risk entry strategy involves stepping down to the weekly or daily timeframe and waiting for the initial vertical excitement to cool off. Look to scale into long positions on a potential structural pullback to perfectly retest the broken 1,750.00 to 1,820.00 prior resistance zone. Letting old historical resistance prove itself as a concrete new support floor provides an unmatched risk-to-reward ratio.
Take Profit (Targets): By utilizing a classical measured move strategy based on the structural depth of the accumulation base, we can project upside targets. Taking the approximate depth of the macro base (roughly 700 points from the 1,100.00 floor up to the 1,799.25 ceiling) and projecting it upward from the breakout point, our primary structural macro target sits comfortably in the 2,450.00 to 2,550.00 zone over the coming quarters.
Invalidation (Stop Loss): An explosive macro breakout thesis is completely invalidated if the price fails to hold its newly claimed structural floor and collapses back inside the core of the base boundaries. A hard stop loss should be placed safely below the breakout candle's origin and recent lower-timeframe swing lows, specifically around the 1,450.00 to 1,500.00 level. A definitive monthly close completely back below 1,450.00 would act as a severe warning sign of a failed macro breakout and a major bull trap.
5. Time Horizon:
Because this technical setup captures a clear structural phase transition and a major horizontal breakout on the 1-Month chart, this is a long-term position trade designed to capture a sustained secular markup phase over the coming months and quarters. Let the macro trend run!  Long
Long
 Long
Long
SOLARINDS: Explosive ATH Breakout & Volatility Expansion [1W]1. The Macro Perspective: The Secular Trend and The Deep Washout
I am taking a LONG bias on Solar Industries India Limited (SOLARINDS) on the weekly (1W) timeframe.
When analyzing pure market structure, the most sustainable and explosive long-term trends require periods of deep digestion. Look at the staggering structural development on this chart. The stock has been in an undeniable, roaring secular bull market. After a massive vertical run that topped out in mid-2025, the stock naturally became overextended. Amateurs panic during these corrections, but institutional capital uses them to reload. The stock suffered a deep, agonizing washout down toward the 11,500–12,000 level, successfully shaking out weak retail hands. Heavy institutional buyers then stepped in, establishing a concrete floor and systematically marching the price right back up to challenge historical supply.
2. The Educational Setup: Reclaiming the Trend and The Launchpad
To understand the sheer power behind the current move, we have to look closely at the mechanics of the recovery:
The 20 SMA Reclaim: During the correction, the stock temporarily lost the weekly 20 SMA (the middle blue line of your Bollinger Bands). However, look at the price action over the last few months. Buyers aggressively reclaimed that moving average, flipping it from dynamic resistance back into dynamic support.
The Structural Pivot: Before launching to new highs, the stock paused and consolidated around the dashed 15,832.55 macro pivot line. By absorbing overhead supply at this critical mid-level stepping stone and letting the 20 SMA catch up, the stock created a perfect structural launchpad.
3. Current Price Action: Entering Pure Price Discovery
Look at the most recent weekly candle on the far right. The pressure cooker has completely blown its lid off. Buyers have stepped in with immense, undeniable force, printing an absolute powerhouse of a green weekly expansion candle. This single vertical thrust has completely obliterated all historical consolidation, surging straight past the old swing highs to trade up near 18,392.00. Furthermore, the price has violently pierced and is riding entirely outside the upper Bollinger Band, snapping the bands wide open. By decisively clearing this massive accumulation block, SOLARINDS has officially entered "Blue Sky Territory" (pure price discovery) where there is absolutely zero historical overhead supply left to stop the trend.
4. The Trade Plan: Entries, Targets, and Risk Management
Entry Strategy: Momentum is exceptionally strong right now. Chasing a massive vertical expansion candle closing entirely outside the weekly upper Bollinger Band carries a severe risk of an agonizing short-term mean-reversion pullback as the stock naturally breathes. The highest-probability, lowest-risk entry involves letting the immediate excitement cool down. Look to step down to a daily timeframe and place limit orders to catch a potential structural pullback to retest the 16,000.00 to 17,200.00 prior breakout zone. Letting old historical resistance prove itself as a concrete new support floor offers a phenomenal risk-to-reward ratio.
Take Profit (Targets): Because the stock is breaking out into unchartered sky territory, we use measured moves based on the depth of the macro base. By taking the depth of the deep correction (roughly 5,900 points from the ~11,500 floor up to the ~17,400 previous peak) and projecting it upward, our primary structural macro target sits comfortably in the 23,000.00 to 23,500.00 zone. The massive 20,000.00 psychological round number will act as the immediate magnet.
Invalidation (Stop Loss): An explosive breakout thesis is completely invalidated if the stock falls back deep into the old consolidation cluster. A hard stop loss should be placed safely below the 15,832.55 pivot line and the rising weekly 20 SMA, around the 13,500.00 to 14,000.00 level. A definitive weekly close completely back below the moving average would act as a massive warning sign of a failed structural breakout and a severe bull trap.
5. Time Horizon:
Because this technical setup is built on a 1-Week chart capturing a massive structural phase transition and a fresh All-Time High breakout, this is a medium-to-longer-term position trade designed to capture a secular markup phase over the coming months. Let the macro trend run!  Long
Long
JINDALSAW: Daily Flag & Pole Breakout1. The Macro Perspective: The Flag and Pole Formation
I am taking a LONG bias on Jindal Saw Limited (JINDALSAW) on the daily (1D) timeframe,
When analyzing pure market structure on an industrial metals stock, extended vertical rallies must eventually be digested. Following a powerful vertical surge from the 165.00 region in March forming the "Pole," the stock entered a necessary cooling-off period. Instead of a deep structural correction, the asset demonstrated immense relative strength by consolidating sideways, carving out a textbook rectangular "Flag" formation throughout April and May. This multi-week digestion phase effectively absorbed profit-taking and allowed institutional capital to systematically accumulate shares at elevated valuations. Documenting these classical continuation bases makes the charting workflow highly repeatable .
2. The Educational Setup: The Flag Boundaries
To understand the technical validity behind this macro launch, look closely at how the price structure interacted with its core boundaries:
The 245.09 Flag Resistance: The definitive line in the sand for a bullish structural breakout was the top of the flag boundary drawn at 245.09. This level acted as a heavy supply zone that systematically capped momentum over several weeks.
The 217.33 Flag Support: During the sideways consolidation, buyers heavily defended the lower boundary of the flag near 217.33. The price action ping-ponged between these two clearly defined levels, squeezing volatility directly beneath the breakout zone and building immense kinetic energy.
3. Current Price Action: Breakout and Volatility Expansion
Look at the massive daily candle on the far right of the chart. The structural pressure cooker has officially exploded. Institutional buyers have stepped in with undeniable conviction. The stock printed a towering, full-bodied green candle that has vertically surged to close at 250.85 (+4.04% on the session). This explosive thrust has decisively obliterated the 245.09 flag ceiling. The stock has officially transitioned out of its accumulation base and back into a highly explosive markup trend into fresh price discovery territory.
Note: Always ensure the exchange's End of Day (EOD) data files have fully synchronized before confirming the final daily close shape. It is best practice to wait until after 9:00 PM to account for any delayed Indian market data synchronization, ensuring there are no visual discrepancies or data glitches before submitting final updates for management review.
4. The Trade Plan: Entries, Targets, and Risk Management
Entry Strategy: Momentum is exceptionally strong with the stock trading vertically out in the open above the breakout line. Chasing an extended daily breakout candle completely outside the flag carries a minor risk of a short-term mean-reversion pullback. The highest-probability entry strategy involves waiting for the initial vertical excitement to cool off. Look to scale into long positions on a potential structural pullback that perfectly retests the broken 240.00 to 245.00 prior resistance zone. Letting old historical resistance prove itself as a concrete new support floor provides an unmatched risk-to-reward ratio.
Take Profit (Targets): By utilizing a classical measured move strategy specific to Flag and Pole patterns, we project the depth of the initial flagpole. Taking the depth of the preceding pole (roughly 80 points from the 165.00 launch to the 245.00 high) and projecting it upward from the breakout point, our primary structural target sits comfortably in the 320.00 to 330.00 zone over the coming weeks.
Invalidation (Stop Loss): An explosive breakout thesis is completely invalidated if the price fails to hold its newly claimed structural floor and collapses back inside the core of the flag boundary. A hard stop loss should be placed safely below the mid-line of the consolidation flag, specifically around the 225.00 to 230.00 level. A definitive daily close completely back below 225.00 would act as a severe warning sign of a failed continuation breakout and a bull trap.
5. Time Horizon:
Because this technical setup is built on a 1-Day chart capturing a clear structural phase transition and a textbook flag and pole breakout, this is a high-alpha swing trade designed to capture a rapid momentum markup phase over the coming weeks. Let the trend run!  Long
Long
AIAENG: Daily Earnings Breakout & Continuation1. The Macro Perspective: The High-Level Accumulation Box
I am taking a LONG bias on AIA Engineering Limited (AIAENG) on the daily (1D) timeframe.
When analyzing pure market structure on a leading industrial manufacturer, periods of sideways digestion are essential to build kinetic energy for a major thrust. Following its previous markup, the stock entered a tight horizontal accumulation block. This structure successfully absorbed profit-taking and allowed institutional capital to quietly accumulate shares. Fundamentally, this massive technical momentum aligns perfectly with AIA Engineering's highly robust Q4 FY26 earnings report. The company reported a consolidated net profit of ₹393 crore, marking a substantial 37.9% year-on-year increase from ₹285 crore in the same period last year. This strong performance was driven by high volume growth in the mining segment and improved operational efficiencies. Additionally, the Board has recommended a final dividend of ₹16 per equity share for FY26.
2. The Educational Setup: Horizontal Boundary Defense
To understand the absolute technical validity behind this launch, look closely at how the price structure interacted with its core boundaries right before breaking out:
The 4,147.45 Supply Ceiling: The definitive line in the sand for a bullish continuation was the solid black horizontal resistance line drawn at 4,147.45. As the price tested this upper boundary multiple times, it established a supply zone that systematically rejected upward expansion.
The 3,777.10 Structural Floor: During the consolidation block, sellers repeatedly tried to push the price lower but were aggressively halted at the structural support near 3,777.10. This created a robust accumulation floor where institutional buyers stepped in, preparing for an explosive launch while the moving averages caught up.
3. Current Price Action: Breakout and Volatility Expansion
Look at the massive daily candles on the far right of the chart. The structural pressure cooker has officially exploded. Following the stellar earnings report and strong dividend announcement, institutional buyers stepped in with undeniable conviction. The stock printed towering, full-bodied green expansion candles that vertically surged to 4,503.60 (+1.71% on the session). This explosive thrust has decisively obliterated the 4,147.45 multi-week ceiling on a massive volume surge. The stock has officially transitioned out of low-volatility accumulation and into a highly explosive markup trend.
4. The Trade Plan: Entries, Targets, and Risk Management
Entry Strategy: Momentum is exceptionally strong with the stock trading vertically out in the open above the breakout line. Chasing an extended daily breakout candle carries a minor risk of a short-term, lower-timeframe mean-reversion pullback. The highest-probability, lowest-risk entry strategy involves waiting for the initial vertical excitement to cool off. Look to scale into long positions on a potential structural pullback that perfectly retests the broken 4,100.00 to 4,150.00 prior resistance zone. Letting old historical resistance prove itself as a concrete new support floor provides an unmatched risk-to-reward ratio.
Take Profit (Targets): We use a classical measured move strategy based on the structural depth of the accumulation pattern. By taking the depth of the range (roughly 370 points from the 3,777.10 floor up to the 4,147.45 ceiling) and projecting it upward from the breakout point, our primary structural target sits comfortably in the 4,500.00 to 4,550.00 zone over the coming weeks, which the price is actively testing right now. Further continuation could push into the 4,800.00+ territory as price discovery continues.
Invalidation (Stop Loss): An explosive breakout thesis is completely invalidated if the price fails to hold its newly claimed structural floor and collapses back inside the core of the base boundaries. A hard stop loss should be placed safely below the daily moving average cushion and the mid-level of the base, specifically around the 3,900.00 to 3,950.00 level. A definitive daily close completely back below 3,900.00 would act as a severe warning sign of a failed breakout and a major bull trap.
5. Time Horizon:
Because this technical setup is built on a 1-Day chart capturing a clear structural phase transition and a major horizontal earnings breakout, this is a high-alpha swing trade designed to capture a rapid momentum markup phase over the coming weeks. Let the trend run!  Long
Long
 Long
Long
OFSS: Weekly Macro Reversal & Breakout1. The Macro Perspective: The Deep Washout and Reversal
I am taking a LONG bias on Oracle Financial Services Software Limited (OFSS) on the macro weekly (1W) timeframe.
When analyzing pure market structure on a high-dividend IT heavyweight, deep structural corrections often present the most lucrative asymmetrical risk-to-reward setups. Following a massive peak near the red 11,944.35 level in early 2025, the stock underwent a brutal, prolonged markdown phase, cascading down into a deep washout zone below the 6,500.00 level in early 2026. This painful correction successfully flushed out weak retail hands. Instead of consolidating at the lows, heavy institutional capital aggressively stepped in, carving out a massive, V-shaped rounding bottom reversal. Fundamentally, this fierce technical momentum aligns with the company's strong positioning in the global banking software market, driven by robust license fee realizations and expanding operating margins as financial institutions accelerate their digital transformation spending.
2. The Educational Setup: The 9,189.70 Resistance Clearance
To understand the technical validity behind this macro launch, look closely at how the price structure interacted with its core boundaries during the recovery phase:
The 9,189.70 Pivot Ceiling: The definitive line in the sand for a bullish structural shift was the solid black horizontal resistance line drawn at 9,189.70. This level marked a major lower high during the 2025 downtrend. Clearing it on a closing basis was absolutely essential to officially break the sequence of lower highs and confirm a macro trend reversal.
The Retest and Launchpad: Notice the beautiful price action following the initial thrust above the black line in early May. The stock pulled back to perfectly retest the broken 9,189.70 level, transforming old historical resistance into a concrete new support floor. This successful retest washed out late breakout buyers and built the necessary kinetic energy before resuming the upward trajectory.
3. Current Price Action: Momentum Expansion
Look at the most recent weekly candles on the far right of the chart. The structural reversal has been thoroughly validated. Institutional buyers have seized total control of the tape, printing a powerful sequence of green expansion candles on massive, towering volume bars. The stock is currently trading strong near 9,964.00, confirming that the asset has officially transitioned out of the markdown phase and into a highly explosive, high-volatility secular markup trend.
4. The Trade Plan: Entries, Targets, and Risk Management
Entry Strategy: Momentum is exceptionally strong with the stock trading firmly out in the open above the pivotal breakout line. Chasing an extended weekly move carries a minor risk of a short-term, lower-timeframe mean-reversion pullback. The highest-probability, lowest-risk entry strategy involves stepping down to the daily timeframe and looking to scale into long positions on any minor structural cooling-off period that revisits the 9,400.00 to 9,600.00 zone.
Take Profit (Targets): Because the stock has confirmed a major structural reversal out of a massive depression, the primary objective is to target the origin of the previous markdown phase. Our primary structural macro target is a full retracement back to the all-time high red resistance line sitting comfortably at the 11,944.35 level over the coming quarters.
Invalidation (Stop Loss): A structural reversal thesis is completely invalidated if the price fails to hold its newly claimed structural floor and collapses back into the downtrend structure. A hard stop loss should be placed safely below the recent retest swing low, specifically around the 8,750.00 to 8,850.00 level. A definitive weekly close completely back below 8,700.00 would act as a severe warning sign of a failed macro reversal and a major bull trap.
5. Time Horizon:
Because this technical setup is built on a 1-Week chart capturing a massive structural phase transition and a major pivot breakout, this is a longer-term position trade designed to capture a secular markup phase over the coming months and quarters. Let the macro trend run!  Long
Long
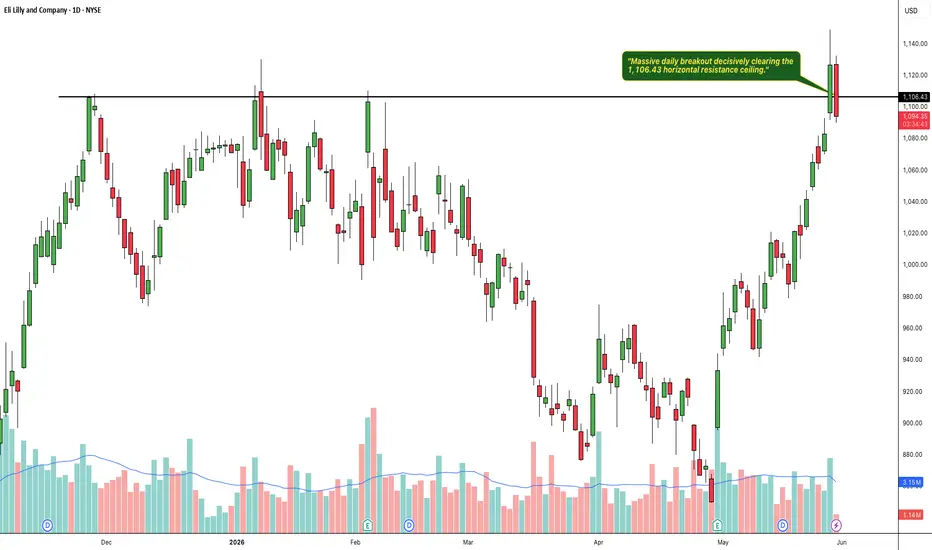
LLY: Daily Accumulation Breakout1. The Macro Perspective: The Multi-Month Accumulation Base
I am taking a LONG bias on Eli Lilly and Company (LLY) on the daily (1D) timeframe.
When analyzing pure market structure on a mega-cap pharmaceutical leader, prolonged consolidation periods are necessary to build kinetic energy for the next major thrust. Following its previous rally, the stock entered a massive horizontal digestion cycle spanning several months. This structure successfully absorbed profit-taking and allowed institutional capital to quietly accumulate shares. Fundamentally, this technical momentum aligns perfectly with the company's blockbuster Q1 2026 earnings report, where revenue came in at $19.8 billion, easily beating the $17.8 billion consensus estimate. Furthermore, non-GAAP EPS of $8.55 topped the $6.79 consensus by nearly 26%. The company also provided a strong FY 2026 guidance range of 35.50-37.00 EPS. Adding to the bullish fundamental backdrop, on May 26, 2026, Eli Lilly announced deals worth up to nearly $4 billion to acquire three vaccine developers—Curevo, LimmaTech Biologics, and Vaccine Co.—expanding its pipeline into infectious disease prevention.
2. The Educational Setup: Horizontal Boundary Defense
To understand the absolute technical validity behind this launch, look closely at how the price structure interacted with its core boundaries right before breaking out:
The 1,106.43 Supply Ceiling: The definitive line in the sand for a bullish continuation was the solid black horizontal resistance line drawn at 1,106.43. As the price tested this upper boundary multiple times over the past months, it established a massive supply zone that systematically rejected upward expansion.
The Dynamic Launchpad: During the consolidation block, deep pullbacks were repeatedly defended by institutional buyers, allowing the stock to carve out a series of higher lows. This sequence steadily squeezed volatility directly beneath the breakout zone, building immense structural pressure.
3. Current Price Action: Breakout and Volatility Expansion
Look at the massive daily candles on the far right of the chart. The structural pressure cooker has officially exploded. Driven by strong fundamental catalysts—including an additional $4.5 billion investment in Indiana manufacturing to meet the surging demand for its weight-loss portfolio—institutional buyers stepped in with undeniable conviction. The stock printed a powerful green expansion candle that has decisively obliterated the 1,106.43 multi-month ceiling. The stock has officially transitioned out of low-volatility accumulation and into a highly explosive markup trend into blue-sky territory.
4. The Trade Plan: Entries, Targets, and Risk Management
Entry Strategy: Momentum is exceptionally strong with the stock trading vertically out in the open above the pivotal breakout line. Chasing an extended daily breakout candle carries a minor risk of a short-term, lower-timeframe mean-reversion pullback. The highest-probability, lowest-risk entry strategy involves waiting for the initial vertical excitement to cool off. Look to scale into long positions on a potential structural pullback that perfectly retests the broken 1,090.00 to 1,106.00 prior resistance zone. Letting old historical resistance prove itself as a concrete new support floor provides an unmatched risk-to-reward ratio.
Take Profit (Targets): We use a classical measured move strategy based on the structural depth of the accumulation pattern. By taking the depth of the major range and projecting it upward from the breakout point, our primary structural target sits comfortably in the 1,250.00 to 1,280.00 zone over the coming weeks as price discovery continues. This trajectory aligns with recent analyst sentiment, where The Goldman Sachs Group raised its price target on Eli Lilly to $1,283.
Invalidation (Stop Loss): An explosive breakout thesis is completely invalidated if the price fails to hold its newly claimed structural floor and collapses back inside the core of the base boundaries. A hard stop loss should be placed safely below the recent swing lows and the mid-level of the base, specifically around the 1,020.00 to 1,040.00 level. A definitive daily close completely back below 1,020.00 would act as a severe warning sign of a failed breakout and a major bull trap.
5. Time Horizon:
Because this technical setup is built on a 1-Day chart capturing a clear structural phase transition and an all-time high horizontal breakout, this is a high-alpha swing trade designed to capture a rapid momentum markup phase over the coming weeks. Let the trend run!  Long
Long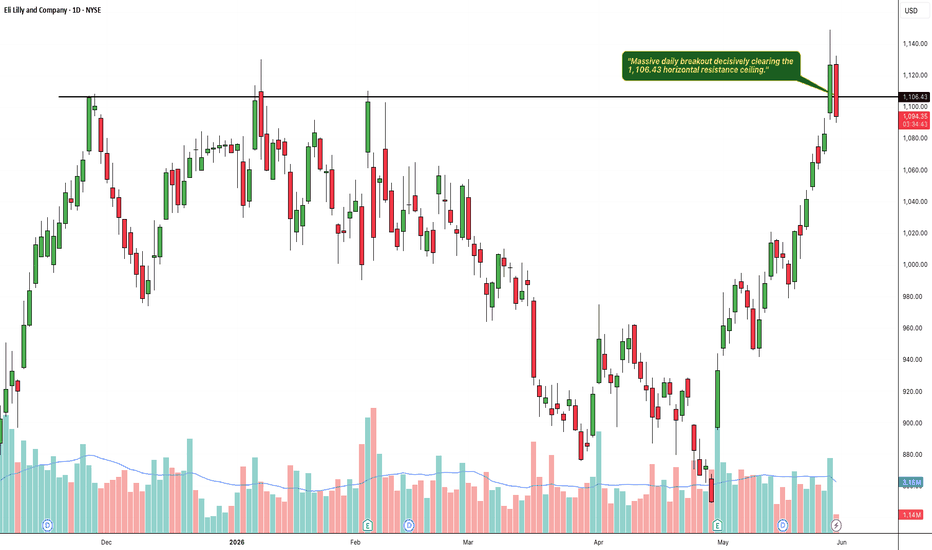
MAR: Daily Ascending Triangle Breakout & Retest1. The Macro Perspective: The Ascending Triangle Base
I am taking a LONG bias on Marriott International (MAR) on the daily (1D) timeframe.
When analyzing pure market structure on a global hospitality leader, prolonged consolidation patterns are necessary to build kinetic energy for the next major thrust. Following its steady rally throughout late 2025 and early 2026, the stock entered a massive ascending triangle formation. This structure was characterized by a flat overhead resistance ceiling and a rising sequence of higher lows along a dynamic trendline. This pattern successfully absorbed profit-taking and allowed institutional capital to quietly accumulate shares. Fundamentally, this technical momentum aligns perfectly with the company's strong Q1 2026 earnings report, where adjusted diluted EPS came in at $2.72, easily surpassing consensus estimates of $2.58. Furthermore, total revenues reached $6.65 billion, reflecting a 6% year-over-year increase. The company also reported a 4.2% increase in global RevPAR, exceeding expectations driven by strong travel demand.
2. The Educational Setup: Horizontal Resistance and Dynamic Support
To understand the absolute technical validity behind this setup, look closely at how the price structure interacted with its core boundaries right before breaking out:
The 378.05 Resistance Ceiling: The definitive line in the sand for a bullish continuation was the solid black horizontal resistance line drawn at 378.05. As the price tested this upper boundary multiple times over the past month, it established a massive supply zone that systematically rejected upward expansion until the recent catalyst.
The Ascending Trendline: During the consolidation block, every deep pullback was heavily defended by institutional buyers at progressively higher levels, forming the solid black diagonal support line. This sequence steadily squeezed volatility directly beneath the breakout zone, building immense structural pressure.
3. Current Price Action: Breakout and Structural Retest
Look at the most recent daily candles on the far right of the chart. The structural pressure cooker exploded. Driven by strong fundamental catalysts, institutional buyers stepped in with undeniable conviction, printing a powerful green expansion candle that decisively obliterated the 378.05 ceiling and pushed the stock to fresh all-time highs near 386.88. The most recent daily candle is a healthy red pullback closing at 376.84, acting as a textbook retest of the breakout zone. The stock is officially attempting to transition out of accumulation and into a highly explosive markup trend into blue-sky territory.
4. The Trade Plan: Entries, Targets, and Risk Management
Entry Strategy: Momentum remains strong despite the recent intraday pullback. The highest-probability, lowest-risk entry strategy involves utilizing this exact current structural retest. Look to scale into long positions right here in the 375.00 to 378.00 zone. Letting old historical resistance prove itself as a concrete new support floor provides an unmatched risk-to-reward ratio before the next leg up.
Take Profit (Targets): We use a classical measured move strategy based on the structural depth of the ascending triangle. By taking the depth of the major range (roughly 30 points from the 348.00 swing low up to the 378.05 ceiling) and projecting it upward from the breakout point, our primary structural target sits comfortably in the 405.00 to 410.00 zone over the coming weeks as pure price discovery continues.
Invalidation (Stop Loss): An ascending triangle breakout thesis is completely invalidated if the price fails to hold its newly claimed structural floor and collapses back inside the core of the base boundaries. A hard stop loss should be placed safely below the diagonal trendline and the recent higher lows, specifically around the 355.00 to 360.00 level. A definitive daily close completely back below 355.00 would act as a severe warning sign of a failed breakout and a major bull trap.
5. Time Horizon:
Because this technical setup is built on a 1-Day chart capturing a clear structural phase transition and an all-time high horizontal breakout, this is a high-alpha swing trade designed to capture a rapid momentum markup phase over the coming weeks. Let the trend run!  Long
Long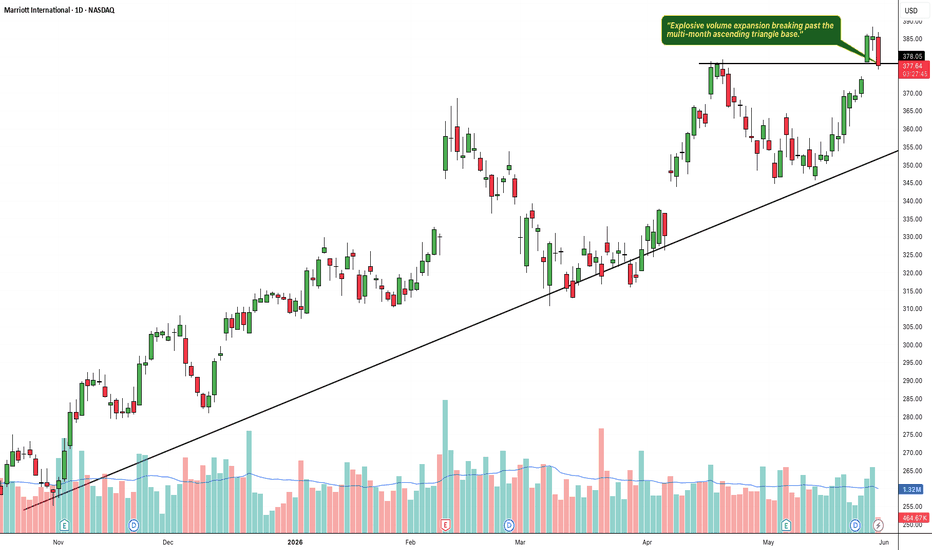
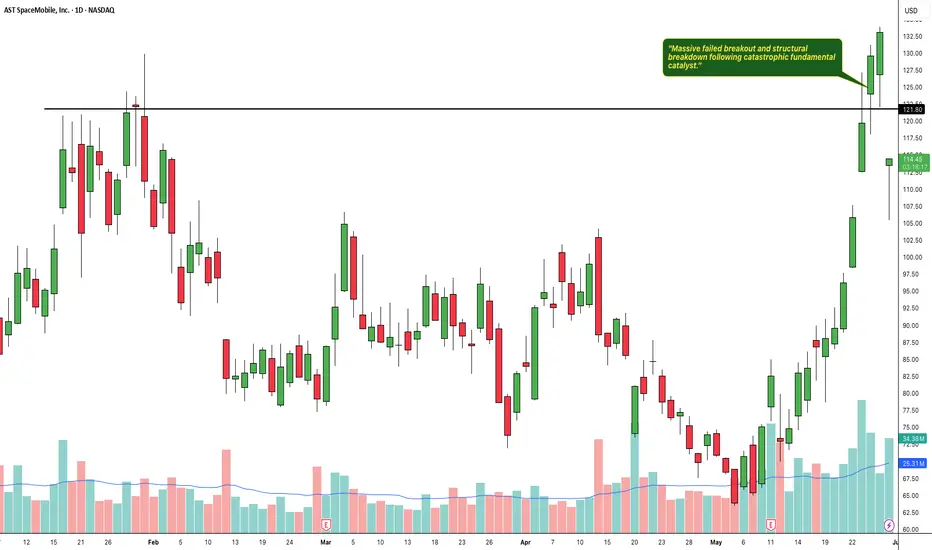
ASTS: Failed Breakout & Structural Invalidation1. The Macro Perspective: The V-Shaped Recovery and Failure
I am taking a BEARISH / CAUTIONARY bias on AST SpaceMobile, Inc. (ASTS) on the daily (1D) timeframe.
When analyzing pure market structure on an aggressive growth stock, vertical, V-shaped recoveries often lack the necessary structural digestion required to sustain a true breakout. Following a steep markdown into early May, the stock initiated a massive, high-velocity vertical squeeze back toward its historical highs. Fundamentally, this aggressive technical momentum was built on the anticipation of rapid satellite constellation deployment to enable commercial space-based cellular broadband. However, this entire fundamental thesis suffered a massive structural blow today. A catastrophic incident occurred at Cape Canaveral where a Blue Origin New Glenn rocket exploded during an engine test, severely damaging the launch complex. Analysts note this will cause significant delays for AST SpaceMobile, jeopardizing their timeline to get 45 satellites into orbit this year, which is required to begin commercial direct-to-cell service.
2. The Educational Setup: Horizontal Boundary Rejection
To understand the absolute technical failure behind this setup, look closely at how the price structure interacted with its core boundary right at the critical moment:
The 121.80 Pivot Ceiling: The definitive line in the sand for a bullish continuation was the solid black horizontal resistance line drawn at 121.80. While the price recently managed to push above this line, the vertical nature of the ascent meant there was zero structural support built beneath it. Buyers were entirely overextended.
3. Current Price Action: Failed Breakout and Bull Trap
Look at the most recent daily candle on the far right of the chart. The structural reality has violently snapped back. Following the devastating fundamental catalyst regarding the launchpad explosion, institutional buyers instantly pulled their bids. The stock printed a massive, full-bodied red expansion candle, gapping down and actively collapsing over 15% on the session. This explosive downside thrust has decisively obliterated the 121.80 level, pulling the price all the way down to the 112.80 zone. This price action confirms a textbook failed breakout and a massive bull trap. The stock has officially transitioned out of the markup phase and into a highly volatile downside correction.
4. The Trade Plan: Entries, Targets, and Risk Management
Entry Strategy: The bullish thesis is completely dead. For traders looking to capitalize on the downside momentum, the highest-probability entry strategy involves waiting for a dead-cat bounce or a minor intraday relief rally that retests the underside of the broken 118.00 to 121.00 zone, which should now act as a heavy new resistance ceiling.
Take Profit (Targets): Downside momentum is exceptionally strong, compounded by a major analyst downgrade from a global investment bank to a "Hold" rating with a lowered price target. By utilizing the depth of the recent structural swings, primary downside targets sit comfortably in the 95.00 to 100.00 zone, with further capitulation potentially revisiting the 80.00 to 85.00 structural base if panic selling accelerates.
Invalidation (Stop Loss): A bearish continuation thesis is invalidated if the market completely absorbs the fundamental shock and violently reclaims the structural high. A hard stop loss for short positions should be placed safely above the recent rejection wick and the 121.80 pivot, specifically around the 125.00 to 127.00 level.
5. Time Horizon:
Because this technical setup captures a massive structural phase transition and a violent failed breakout on the 1-Day chart, this is a high-volatility momentum setup designed to capture rapid downside expansion over the coming weeks. Respect the structural break!  Long
Long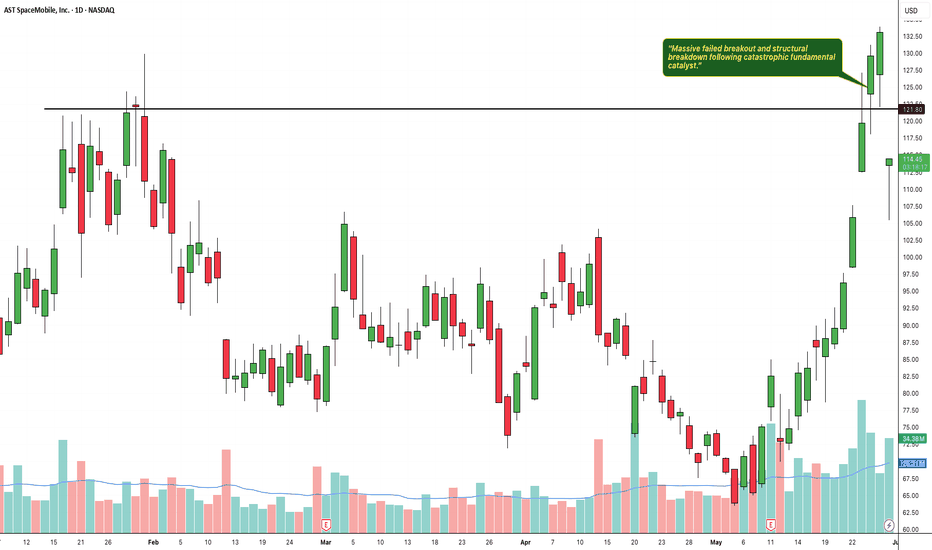
ILMN: Weekly Ascending Triangle Breakout1. The Macro Perspective: The Multi-Month Accumulation Base
I am taking a LONG bias on Illumina, Inc. (ILMN) on the macro weekly (1W) timeframe.
When analyzing pure market structure on a biotechnology leader, prolonged consolidation patterns are necessary to build kinetic energy for the next major thrust. Following a severe markdown phase throughout 2025, the stock carved out a massive structural bottom and entered a prolonged accumulation phase. This ascending triangle formation successfully absorbed overhead supply while institutional capital quietly accumulated shares at progressively higher levels. Fundamentally, this technical momentum is strongly supported by the company's recent Q1 2026 earnings report. Illumina delivered strong revenue of $1.09 billion, representing a 4.8% year-over-year increase, and reported a non-GAAP EPS of $1.15. Based on robust clinical demand, management even raised their full-year revenue guidance to roughly $4.57 billion. Furthermore, on May 28, 2026, the company announced the launch of an innovative whole-genome sequencing solution aimed at advancing molecular residual disease (MRD) research for cancer, providing a significant fundamental catalyst for future growth.
2. The Educational Setup: Horizontal Resistance and Ascending Support
To understand the absolute technical validity behind this launch, look closely at how the price structure interacted with its core boundaries prior to breaking out:
The 152.34 Resistance Ceiling: The definitive line in the sand for a macro trend reversal was the solid black horizontal resistance line drawn at 152.34. This level acted as a heavy supply zone over the past year, systematically capping upward momentum and rejecting breakout attempts.
The Ascending Trendline: Notice how every deep structural pullback since early 2025 was heavily defended by buyers at progressively higher levels, forming the solid black diagonal support line. This sequence of higher lows steadily squeezed volatility directly beneath the breakout zone, building immense structural pressure.
3. Current Price Action: Breakout and Volatility Expansion
Look at the most recent weekly candle on the far right of the chart. The structural pressure cooker has officially exploded. Driven by the strong earnings and new product pipeline, institutional buyers stepped in with undeniable conviction. The stock printed a massive, full-bodied green expansion candle that decisively obliterated the 152.34 ceiling, currently trading strong near 164.28. This explosive thrust confirms that the asset has officially transitioned out of the accumulation phase and into a highly explosive secular markup trend into fresh territory.
4. The Trade Plan: Entries, Targets, and Risk Management
Entry Strategy: Momentum is exceptionally strong with the stock trading vertically out in the open above the pivotal breakout line. Chasing an extended weekly breakout candle carries a minor risk of a short-term, lower-timeframe mean-reversion pullback. The highest-probability, lowest-risk entry strategy involves stepping down to the daily timeframe and looking to scale into long positions on a potential structural pullback that perfectly retests the broken 148.00 to 153.00 prior resistance zone. Letting old historical resistance prove itself as a concrete new support floor provides an unmatched risk-to-reward ratio.
Take Profit (Targets): By utilizing a classical measured move strategy based on the structural depth of the ascending triangle pattern, we can project upside targets. Taking the approximate depth of the range (roughly 70 points from the structural floor near 80.00 up to the 152.34 ceiling) and projecting it upward from the breakout point, our primary structural macro target sits comfortably in the 215.00 to 225.00 zone over the coming quarters as price discovery continues.
Invalidation (Stop Loss): An explosive breakout thesis is completely invalidated if the price fails to hold its newly claimed structural floor and collapses back inside the core of the base boundaries. A hard stop loss should be placed safely below the diagonal trendline and the recent weekly higher lows, specifically around the 130.00 to 135.00 level. A definitive weekly close completely back below 130.00 would act as a severe warning sign of a failed macro breakout and a major bull trap.
5. Time Horizon:
Because this technical setup is built on a 1-Week chart capturing a clear structural phase transition and a major horizontal breakout, this is a longer-term position trade designed to capture a rapid momentum markup phase over the coming months. Let the macro trend run!  Long
Long
LSTR: Weekly Macro Reversal & Breakout1. The Macro Perspective: The Deep Washout and Reversal
I am taking a LONG bias on Landstar System, Inc. (LSTR) on the macro weekly (1W) timeframe.
When analyzing pure market structure on a logistics and transportation leader, deep structural corrections often present highly lucrative asymmetrical risk-to-reward setups. Following a prolonged markdown phase throughout late 2024 and early 2025, the stock cascaded down into a deep washout zone. This painful correction successfully flushed out weak hands. Instead of consolidating at the absolute lows, heavy institutional capital aggressively stepped in, carving out a massive, V-shaped rounding bottom reversal over the past year. Fundamentally, this fierce technical momentum aligns with the company's robust Q1 2026 financial results. The transportation provider reported earnings per share of $1.16, surpassing consensus estimates, while revenue grew to $1.17 billion. Most impressively, the company achieved substantial margin expansion across key profitability metrics, signaling a successful navigation through the broader freight market downturn.
2. The Educational Setup: The 191.19 Resistance Clearance
To understand the technical validity behind this macro launch, look closely at how the price structure interacted with its core boundaries during the recovery phase:
The 191.19 Pivot Ceiling: The definitive line in the sand for a bullish structural shift was the solid black horizontal resistance line drawn at 191.19. This level marked a major structural high from the prior consolidation block before the capitulation. Clearing this level on a closing basis was essential to officially break out of the multi-year range and confirm a secular macro trend reversal.
The Dynamic Recovery: Notice the beautiful price action forming the right side of the rounding bottom throughout early 2026. The stock printed a relentless sequence of higher lows and expansion candles, systematically grinding back up toward the structural ceiling and building immense kinetic energy.
3. Current Price Action: Breakout and Volatility Expansion
Look at the most recent weekly candles on the far right of the chart. The structural reversal has been thoroughly validated. Institutional buyers have seized total control of the tape, printing a powerful sequence of towering green expansion candles on massive volume bars. The stock has decisively obliterated the 191.19 ceiling and is currently trading incredibly strong near the 207.44 level. This explosive thrust confirms that the asset has officially transitioned out of the markdown phase and into a highly explosive, high-volatility secular markup trend.
4. The Trade Plan: Entries, Targets, and Risk Management
Entry Strategy: Momentum is exceptionally strong with the stock trading firmly out in the open above the pivotal breakout line. Chasing an extended, vertical weekly move carries a minor risk of a short-term, lower-timeframe mean-reversion pullback. The highest-probability, lowest-risk entry strategy involves stepping down to the daily timeframe and looking to scale into long positions on any minor structural cooling-off period that revisits the 191.00 to 195.00 zone. Letting old historical resistance prove itself as a concrete new support floor provides an unmatched risk-to-reward ratio.
Take Profit (Targets): Because the stock is clearing a major multi-year structure to launch into pure price discovery, we use a measured move strategy based on the depth of the rounding bottom. By projecting the depth of the macro range upward from the breakout point, our primary structural target sits comfortably in the 235.00 to 245.00 zone over the coming quarters.
Invalidation (Stop Loss): A structural reversal thesis is completely invalidated if the price fails to hold its newly claimed structural floor and collapses back into the core of the rounding bottom structure. A hard stop loss should be placed safely below the breakout zone and recent lower-timeframe swing lows, specifically around the 175.00 to 180.00 level. A definitive weekly close completely back below 175.00 would act as a severe warning sign of a failed macro reversal and a major bull trap.
5. Time Horizon:
Because this technical setup is built on a 1-Week chart capturing a massive structural phase transition and a major pivot breakout, this is a longer-term position trade designed to capture a secular markup phase over the coming months and quarters. Let the macro trend run!  Long
Long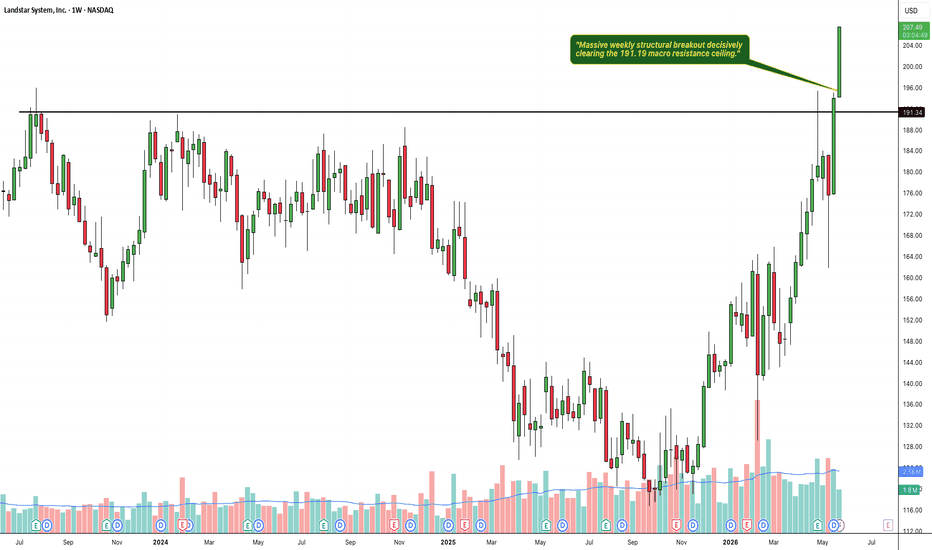
NETWEB: Daily Cup and Handle Breakout1. The Macro Perspective: The Massive Cup Formation
I am taking a LONG bias on Netweb Technologies India Limited (NETWEB) on the daily (1D) timeframe.
When analyzing pure market structure on a high-growth technology stock, extended accumulation patterns like the classical Cup and Handle are essential to absorb supply and build kinetic energy. Following its previous peak in late 2025, the stock underwent a prolonged rounding correction, carving out the massive "Cup" structure visible on the chart. This multi-month digestion phase allowed institutional capital to systematically accumulate shares at lower valuations. Fundamentally, this fierce technical momentum aligns perfectly with the company's stellar Q4 FY26 financial results. Netweb reported Q4 FY26 operating income of ₹7,737 million, registering a massive year-on-year growth of 86.6%. Furthermore, profit after tax (PAT) rose by 65.7% YoY to ₹705.9 million for the quarter, bringing the full-year PAT to ₹2,058.2 million (an 80.9% increase). The ultimate catalyst driving this accumulation is the exponential growth in their AI systems segment, which surged by 459.6% YoY and now contributes 43.4% to total operating revenue.
2. The Educational Setup: The Handle and Resistance
To understand the technical validity behind this macro launch, look closely at how the price structure interacted with its core boundaries:
The 4,465.20 Resistance Ceiling: The definitive line in the sand for a bullish structural breakout was the dashed black horizontal resistance line drawn at 4,465.20. This level marked the absolute lip of the cup formation, acting as a heavy supply zone.
The Handle Formation: Following the initial test of the 4,465.20 ceiling in early May, the price experienced a healthy, localized pullback. This tight, shallow correction formed the "Handle" of the pattern, squeezing volatility and allowing the daily moving averages to catch up to act as a dynamic launchpad.
3. Current Price Action: Breakout and Volatility Expansion
Look at the massive daily candle on the far right of the chart. The structural pressure cooker has officially exploded. Driven by the blowout earnings and massive AI segment growth, institutional buyers have stepped in with undeniable conviction. The stock printed a towering, full-bodied green expansion candle that has vertically surged to close at 4,670.70 (+14.70% on the session). This explosive thrust has decisively obliterated the 4,465.20 macro ceiling on a significant volume expansion. The stock has officially transitioned out of accumulation and into a highly explosive markup trend into pure blue-sky territory.
4. The Trade Plan: Entries, Targets, and Risk Management
Entry Strategy: Momentum is exceptionally strong with the stock trading vertically out in the open above the breakout line. Chasing an extended daily breakout candle completely outside the Bollinger Bands carries a minor risk of a short-term mean-reversion pullback. The highest-probability entry strategy involves waiting for the initial vertical excitement to cool off. Look to scale into long positions on a potential structural pullback that perfectly retests the broken 4,400.00 to 4,465.00 prior resistance zone. Letting old historical resistance prove itself as a concrete new support floor provides an unmatched risk-to-reward ratio.
Take Profit (Targets): We use a classical measured move strategy based on the structural depth of the cup pattern. By taking the depth of the cup (roughly 1,465 points from the absolute structural floor near 3,000.00 up to the 4,465.20 ceiling) and projecting it upward from the breakout point, our primary structural macro target sits comfortably in the 5,800.00 to 5,900.00 zone over the coming weeks and months.
Invalidation (Stop Loss): An explosive breakout thesis is completely invalidated if the price fails to hold its newly claimed structural floor and collapses back inside the core of the handle boundary. A hard stop loss should be placed safely below the recent handle swing low and moving average cushion, specifically around the 3,800.00 to 3,850.00 level. A definitive daily close completely back below 3,800.00 would act as a severe warning sign of a failed macro breakout and a major bull trap.
5. Time Horizon:
Because this technical setup is built on a 1-Day chart capturing a clear structural phase transition and an all-time high cup and handle breakout, this is a high-alpha swing trade designed to capture a rapid momentum markup phase over the coming weeks. Let the trend run!  Long
Long
GRWRHITECH: Multi-Stage Accumulation and Explosive Vertical Brea1. The Macro Perspective: The Deep Washout and Bottom Accumulation
I am taking a LONG bias on Garware Hi-Tech Films Limited (GRWRHITECH) on the daily (1D) timeframe.
When analyzing pure market structure, patience reveals the absolute highest probability setups. Look at the massive structural development on this chart. After a deep, brutal markdown phase that successfully washed out all the weak hands, the price was dragged all the way down to establish an absolute concrete floor at the bottom green 2,602.05 line. However, instead of bleeding into a secular bear market, the stock found its footing and initiated a methodical, multi-month process of bottom accumulation, allowing institutional buyers to quietly absorb shares at a massive discount.
2. The Educational Setup: Conquering the Stepping Stones
To understand the sheer strength of this current breakout, look at how the price systematically dismantled historical resistance on the right side of the curve by building a "Staircase":
The Structural Checkpoints: The stock didn't just V-shape recover; it methodically climbed. Notice how it used the green horizontal lines at 3,560.20 and 4,219.50 as structural stepping stones. It broke through them, chopped sideways to digest the gains, and established higher floors.
The Pressure Cooker: Before the final launch, the stock spent months consolidating in a wide, highly volatile range, using the dashed 4,061.90 line as a mid-level pivot. This high-level chop directly beneath the ultimate macro ceiling acts like a pressure cooker, shaking out impatient retail traders and storing immense kinetic energy for the next leg higher.
3. Current Price Action: Blue Sky Territory
Look at the most recent daily candles on the far right, accompanied by a massive surge in buying volume (visible on the bottom panel). The pressure cooker has absolutely exploded. In a violent, near-vertical display of momentum, buyers have effortlessly shattered the ultimate solid black 5,213.90 macro ceiling. By clearing this final historical accumulation zone with such velocity, GRWRHITECH has officially entered "Blue Sky Territory" (pure price discovery). There is absolutely zero historical overhead supply left to act as natural resistance.
4. The Trade Plan: Entries, Targets, and Risk Management
Entry Strategy: Momentum is exceptionally strong right now near 5,290.30. Chasing massive, vertical daily expansion candles always carries a higher risk of an immediate intraday drawdown. The highest-probability, lowest-risk entry involves placing limit orders to catch a potential minor structural pullback to retest the 5,200.00 to 5,225.00 breakout zone. Letting that old heavy macro resistance prove itself as a new, indestructible support floor offers a phenomenal risk-to-reward ratio.
Take Profit (Targets): Because the stock is in pure price discovery, we use measured structural targets. By taking the depth of the recent major accumulation base (roughly 1,650 points from the 3,560.20 floor to the 5,213.90 ceiling) and projecting it upward from the breakout line, our primary macro extension target sits comfortably in the 6,850.00 to 6,900.00 zone. Immediate psychological milestones are 5,500.00 and 6,000.00.
Invalidation (Stop Loss): A trade thesis is only valid if the new market structure holds. A hard stop loss should be placed safely below the breakout zone and within the body of the recent momentum thrust, around the 4,600.00 to 4,700.00 level. A definitive daily close completely back below the 4,219.50 green line would act as a massive warning sign of a failed macro breakout and severe structural weakness.
5. Time Horizon:
Because this technical setup is built on a 1-Day chart capturing a massive structural completion into a vertical momentum thrust, this is a short-to-medium-term swing/position trade designed to capture the explosive markup phase. Let the trend run!  Long
Long
AVALONhas explosively broken out of a massive ascending triangle1. The Macro Perspective: The Institutional Staircase
I am taking a LONG bias on Avalon Technologies Limited (AVALON) on the weekly (1W) timeframe.
When analyzing pure market structure, the most powerful and sustainable breakouts occur in alignment with an established macro trend. Look at the massive structural development on this chart. The defining feature is the steep, unbroken ascending trendline (the lower solid black line). Every single time the stock experienced a pullback, institutional buyers aggressively stepped in exactly at this dynamic support line. They refused to let the secular bull trend break, consistently printing higher lows and indicating massive, systemic accumulation over the long term.
2. The Educational Setup: The Squeeze and The Ceiling
To understand the sheer strength of this current breakout, look at how the price systematically squeezed historical resistance to form a textbook "Ascending Triangle":
The Concrete Ceiling: The stock's recovery was heavily capped by a formidable horizontal resistance line at 1,264.45. Sellers repeatedly defended this extreme high, creating a clear supply ceiling.
The High-Level Squeeze: Notice how the pullbacks became shallower over time, riding the ascending trendline and the 20 SMA (the middle blue line of your Bollinger Bands). By pressing up against the flat horizontal ceiling while simultaneously forming higher lows, the stock acted like the ultimate pressure cooker. It gracefully transferred shares from impatient retail traders to strong-handed institutional buyers, storing immense kinetic energy as the structure tightened.
3. Current Price Action: Riding the Upper Band into Blue Sky
Look at the most recent weekly candles on the far right. The high-level pressure cooker has absolutely exploded. Buyers have effortlessly shattered the 1,264.45 macro ceiling with a massive, full-bodied green momentum thrust, pushing the price well past the 1,400 mark. Furthermore, notice how the price has violently pierced the upper Bollinger Band, forcing the bands to rapidly expand upward. By decisively clearing this extreme resistance zone, AVALON has officially entered "Blue Sky Territory" (pure price discovery). All historical overhead supply has been completely eliminated.
4. The Trade Plan: Entries, Targets, and Risk Management
Entry Strategy: Momentum is exceptionally strong right now near 1,464.40. Chasing a massive vertical expansion candle that is riding outside the weekly Bollinger Bands always carries a higher risk of an immediate intraday or daily mean-reversion pullback as the stock breathes. The highest-probability, lowest-risk entry involves stepping down to a daily timeframe and waiting for the dust to settle. Look to place limit orders to catch a potential structural pullback to perfectly retest the 1,260.00 to 1,300.00 breakout zone. Letting that heavy historical resistance prove itself as a new, indestructible support floor offers a phenomenal risk-to-reward ratio.
Take Profit (Targets): Because the stock is breaking out of a massive macro structure into pure price discovery, we use measured targets based on the depth of the pattern. By taking a conservative depth of the ascending triangle (roughly 600+ points from the ~646 mid-base up to the 1,264.45 ceiling) and projecting it upward from the breakout line, our primary structural macro target sits comfortably in the 1,850.00 to 1,900.00 zone. The immediate psychological milestone will be the 1,500.00 mark.
Invalidation (Stop Loss): A trade thesis is only valid if the new market structure holds. A hard stop loss should be placed safely below the breakout line and the rising 20 SMA, around the 1,100.00 to 1,150.00 level. A definitive weekly close completely back inside the triangle and breaking below the ascending trendline would invalidate the immediate continuation thesis and signal a severe macro bull trap.
5. Time Horizon:
Because this technical setup is built on a 1-Week chart capturing a massive structural phase transition and volatility expansion, this is a medium-to-longer-term position trade designed to capture the explosive new markup phase. Let the new trend run!  Long
Long
CEMPRO: Massive Rounding Bottom and Explosive Macro Breakout1. The Macro Perspective: The Deep Washout and Aggressive Recovery
I am taking a LONG bias on Cemindia Projects Ltd (CEMPRO) on the weekly (1W) timeframe.
When analyzing pure market structure, we want to look for areas where supply is completely exhausted and demand takes over with undeniable force. Look at the macro structure on this chart. After establishing a heavy historical ceiling directly at the 933.15 level, the stock suffered a deep, highly volatile markdown phase that dragged the price all the way down toward the 525 zone. This successfully washed out all the weak hands. However, instead of languishing in a secular bear market, the stock initiated a massive "Rounding Bottom" accumulation phase.
2. The Educational Setup: The Power of the Right Side
To understand the sheer strength of this current breakout, look at the price action on the right side of the curve:
The Momentum Shift: Notice how the recovery wasn't a slow, grinding chop. Once the stock found its absolute floor, institutional buyers stepped in aggressively. The right side of this rounding bottom is incredibly steep, characterized by large, full-bodied green weekly candles.
Ignoring the Mid-Line: Look at the dashed mid-level pivot at 795.45. In a weaker stock, this level would act as major resistance and force a deep pullback. Instead, CEMPRO simply gapped or pushed straight through it, using it merely as a brief resting stop before continuing its aggressive ascent. This shows that buyers were highly motivated and unwilling to wait for deep discounts.
3. Current Price Action: Blue Sky Territory
Look at the most recent weekly candle on the far right, accompanied by a massive surge in buying volume (bottom panel). The pressure cooker has exploded. Buyers have effortlessly shattered the 933.15 ultimate macro resistance, printing an enormous expansion candle. By clearing this final historical ceiling with such velocity, the stock has officially entered "Blue Sky Territory" (pure price discovery). There is absolutely zero historical overhead supply left to act as natural resistance.
4. The Trade Plan: Entries, Targets, and Risk Management
Entry Strategy: Momentum is exceptionally strong right now near 956.15. Chasing a massive, near-vertical weekly expansion candle always carries a higher risk of an immediate intraday or daily drawdown. The highest-probability, lowest-risk entry involves stepping down to a daily timeframe and placing limit orders to catch a potential structural pullback to retest the 930.00 to 940.00 breakout zone. Letting that old, heavy resistance prove itself as a new, indestructible support floor offers a phenomenal risk-to-reward ratio.
Take Profit (Targets): Because the stock is in pure price discovery, we use measured structural targets. By taking the depth of the massive macro rounding bottom (roughly 408 points from the ~525 base to the 933.15 neckline) and projecting it upward from the breakout line, our primary structural target sits comfortably in the 1,340.00 to 1,350.00 macro extension zone. Immediate psychological milestones are 1,100.00 and 1,200.00.
Invalidation (Stop Loss): A trade thesis is only valid if the new market structure holds. A hard stop loss should be placed safely below the breakout zone and within the body of the recent weekly momentum thrust, around the 850.00 to 870.00 level. A definitive weekly close completely back below the 933.15 line would act as an early warning sign of a failed macro breakout (a "bull trap").
5. Time Horizon:
Because this technical setup is built on a 1-Week chart capturing a massive structural completion and momentum thrust into fresh price discovery, this is a medium-to-longer-term position trade designed to play out over the coming weeks to months. Let the macro trend run!  Long
Long
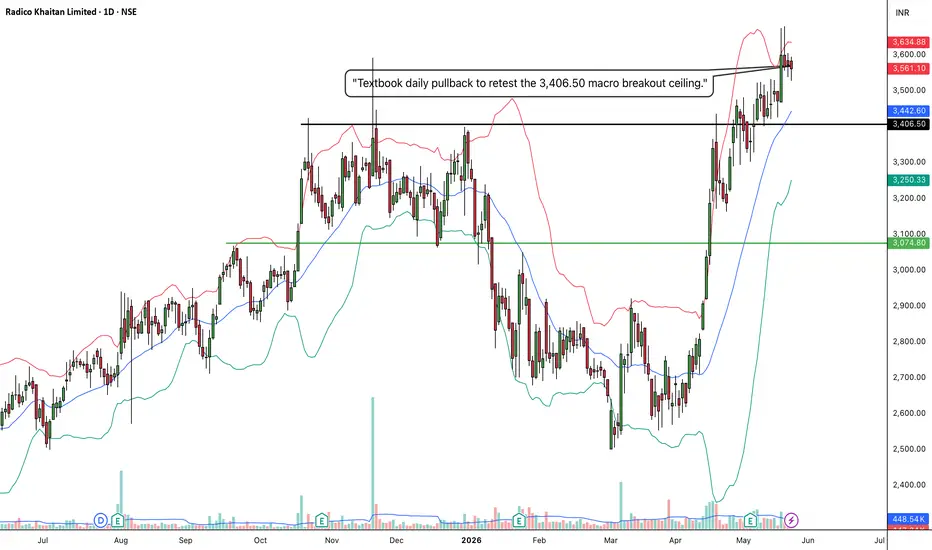
RADICO: Daily Break & Retest1. The Macro Perspective: The Massive Accumulation Cup
I am taking a LONG bias on Radico Khaitan Limited (RADICO) on the daily (1D) timeframe.
When analyzing pure market structure, sustainable long-term trends do not move in a straight line; they breathe through cycles of expansion and compression. Look at the extensive structural development displayed across Screenshot 2026-05-23 at 17.07.29.jpg. After a major markup phase that topped out in late 2025, the stock underwent an extensive corrective digestion phase, dropping down toward the 2,500–2,600 area. This deep correction washed out weak retail hands and allowed institutional buyers to absorb liquidity at a steep discount. Over the last few months, the stock has systematically carved out a massive rounding recovery, marching back up the right side of the base to challenge key historical supply.
2. The Educational Setup: Neckline Clearance and Volatility Squeeze
To understand the technical validity behind this massive breakout structure, we examine the clear horizontal parameters and dynamic indicators acting across the chart:
The Major Resistance Ceiling: The absolute horizontal line to watch is the solid black line drawn at 3,406.50. This level has historically acted as a major roadblock where sellers aggressively blocked further upward expansion, establishing a key macro neckline.
The Bollinger Band Springboard: Notice how the price action behaved leading up to the breakout. As the price climbed back to the 3,406.50 ceiling, the Bollinger Bands expanded and the price began riding the upper band. Following that initial vertical surge, the stock has entered a tight consolidation phase, allowing the rising daily 20 SMA (the middle blue line of your Bollinger Bands, currently near 3,442.60) to catch up and act as a dynamic cushion.
3. Current Price Action: The Ultimate Retest Confirmation
Look closely at the most recent daily candles on the far right of the chart. After an explosive momentum thrust that launched the price to local highs near 3,634.88, the stock is executing a highly controlled, shallow pullback. To amateur retail traders, these minor red candles look like a failed rally. To structural price action traders, this is a textbook "Break and Retest" pattern. The stock is pulling back to perfectly test the 3,406.50 breakout line and the daily 20 SMA from above. By holding its ground here, that old, heavy historical resistance is officially being flipped into a brand-new, indestructible structural launchpad.
4. The Trade Plan: Entries, Targets, and Risk Management
Entry Strategy: We are currently sitting directly inside the highest-probability "golden entry" zone. Chasing the initial vertical breakout candle is always dangerous due to mean-reversion risks, which is exactly why we wait for pullbacks like this. The lowest-risk entry involves scaling into long positions within the current 3,400.00 to 3,460.00 digestion range, looking for a strong daily reversal candle to confirm that buyers are aggressively defending this newly claimed support floor.
Take Profit (Targets): Because the stock is clearing a major macro base to target fresh multi-year highs, we use a measured move strategy. By taking the depth of the rounding base (roughly 850 points from the ~2,550 floor up to the 3,406 breakout neckline) and projecting it upward, our primary structural macro target sits comfortably in the 4,200.00 to 4,250.00 zone over the coming weeks. Near-term psychological targets rest at 3,800.00 and 4,000.00.
Invalidation (Stop Loss): A break-and-retest thesis is completely invalidated if the price fails to defend its new floor and slips back into the core of its older base. A hard stop loss should be placed safely below the recent swing low and the green structural line, specifically around the 3,040.00 to 3,080.00 zone. A definitive daily close completely back below 3,050 would act as a major warning sign of a failed macro breakout and a severe bull trap.
5. Time Horizon:
Because this technical setup is engineered on a 1-Day chart capturing a clean range breakout and an immediate structural retest, this is a high-alpha swing trade designed to capture a rapid momentum continuation over the coming days and weeks. Let the markup phase run!  Long
Long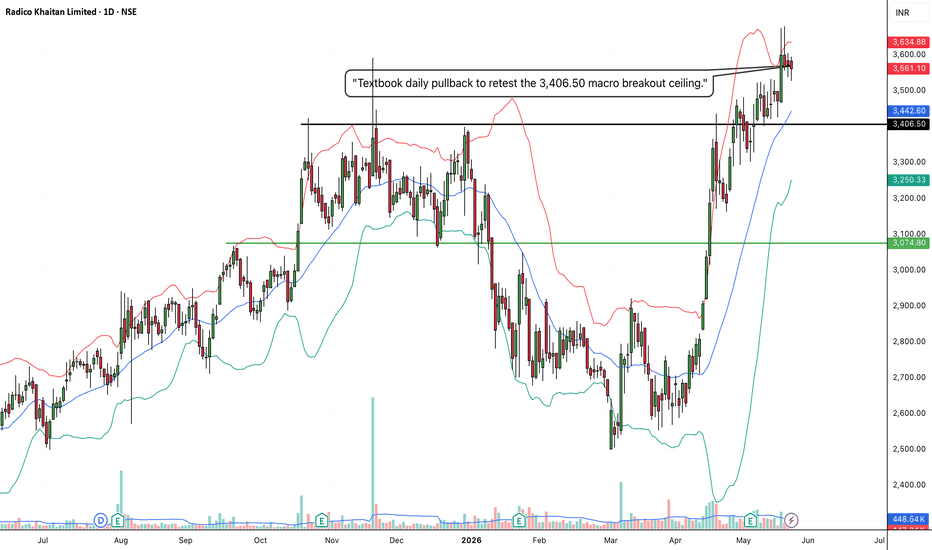
SHILPAMED: Monthly Macro Base Breakout1. The Macro Perspective: The Multi-Year Consolidation Base
I am taking a LONG bias on Shilpa Medicare Limited (SHILPAMED) on the absolute macro monthly (1M) timeframe.
When analyzing pure market structure on a monthly chart, we are looking at the footprint of long-term institutional accumulation. Look at the staggering structural development displayed across Screenshot 2026-05-26 at 14.44.51.jpg. After a major rally through mid-2024, the stock entered a broad, multi-year horizontal range. This corridor has been rigidly bounded by a rock-solid accumulation floor at 288.85 and a formidable overhead resistance ceiling at 471.55. This multi-year consolidation served as a massive liquidity vacuum, thoroughly exhausting weak retail hands while strong-handed institutional portfolios methodically absorbed all floating supply.
2. The Educational Setup: Dynamic Support and Volatility Compression
To understand the absolute technical validity behind this macro breakout, look closely at how perfectly the price structure interacted with its core boundaries right before launching:
The 20 SMA Cushion: Notice the deep corrective swing that occurred in late 2025 into early 2026. The downward pressure stopped dead in its tracks exactly at the rising monthly 20 SMA (the middle blue line of your Bollinger Bands, currently sitting at 381.28). Institutional capital heavily defended this moving average, refusing to let the primary bull trend break.
The High-Level Squeeze: Following that dynamic defense, buyers immediately pushed the price right back up to the 471.55 ceiling. Notice how the price action began coiling tightly against this horizontal resistance line. This high-level compression represents immense kinetic energy storing under the surface—a classic volatility squeeze before a massive structural expansion.
3. Current Price Action: Entering Pure Price Discovery
Look at the most recent monthly candle on the far right of the chart. The technical pressure cooker has officially exploded. Institutional buyers have stepped in with undeniable conviction, printing a massive, full-bodied green expansion candle that has surged up to 500.35 (+23.04%). This vertical thrust has decisively obliterated the 471.55 multi-year ceiling, pushing the price into clear price discovery territory. Furthermore, the price has pierced the upper Bollinger Band, confirming a textbook shift out of a low-volatility accumulation phase and into a highly explosive, high-volatility secular markup trend.
4. The Trade Plan: Entries, Targets, and Risk Management
Entry Strategy: Macro momentum is exceptionally strong right now with the stock trading near 500.35. Because the monthly candle is extended and pushing hard against the upper Bollinger Band, chasing the vertical move immediately carries a short-term mean-reversion risk on lower timeframes. The highest-probability, lowest-risk entry strategy involves stepping down to the weekly or daily timeframe and waiting for the initial vertical excitement to cool off. Look to scale into long positions or place limit orders to catch a potential structural pullback to perfectly retest the 460.00 to 475.00 broken resistance zone. Letting old macro resistance prove itself as a concrete new support floor offers a phenomenal risk-to-reward ratio.
Take Profit (Targets): Because the stock is clearing a major multi-year structure to launch into uncharted sky territory, we use a measured move strategy based on the depth of the base. By taking the core depth of this consolidation range (roughly 183 points from the 288.85 floor up to the 471.55 ceiling) and projecting it upward from the breakout point, our primary structural macro target sits comfortably in the 650.00 to 660.00 zone. Intermediate profit-taking milestones rest at the psychological round numbers of 550.00 and 600.00.
Invalidation (Stop Loss): An explosive macro breakout thesis is completely invalidated if the price fails to hold its newly claimed structural floor and collapses back inside the base boundaries. A hard stop loss should be placed safely below the monthly 20 SMA cushion, specifically around the 360.00 to 380.00 level. A definitive monthly close completely back below 370.00 would act as a severe warning sign of a failed macro breakout and a major bull trap.
5. Time Horizon:
Because this technical setup is built on a 1-Month chart capturing a massive structural phase transition and a multi-year base breakout, this is a longer-term position trade designed to capture a secular markup phase over the coming months and quarters. Let the macro trend run!  Long
Long
SANDHAR: Weekly Macro Breakout1. The Macro Perspective: The Broad Base and Deep Washout
I am taking a LONG bias on Sandhar Technologies Limited (SANDHAR) on the weekly (1W) timeframe.
When analyzing pure market structure, the most sustainable trends emerge from large, well-developed base structures that successfully absorb long-term selling pressure. Look at the comprehensive development displayed in Screenshot 2026-05-26 at 14.50.53.jpg. After a major high was established in mid-2024, the stock underwent an extensive corrective digestion cycle, cascading down into a deep washout zone near 350-375 in early 2025. This painful markdown completely flushed out weak retail participants. Instead of continuing lower, institutional accumulation stepped in to build a solid foundational floor, methodically guiding the stock back up the right side of the chart over several months to challenge major historical supply.
2. The Educational Setup: Dynamic Support and Resistance Clearance
To understand the technical validity behind this macro breakout, we look at the interaction between horizontal key levels and dynamic moving average structures:
The Critical Supply Barrier: The key level defining this macro base is the solid black horizontal resistance line drawn at 658.25. This boundary marks a major historical structural ceiling where intense selling pressure repeatedly capped upward expansion, making it the definitive line in the sand for a bullish trend reversal.
The 20 SMA Dynamic Cushion: Notice how cleanly the price action behaved during the recovery process. The stock established a clear series of higher lows, consistently utilizing the rising weekly 20 SMA (the middle blue line of your Bollinger Bands, currently sitting at 514.35) as a dynamic cushion. Defending this key moving average allowed the price to compress tightly against the 658.25 ceiling, building up immense kinetic energy before the eventual structural launch.
3. Current Price Action: Volatility Expansion and Markup Phase
Look at the most recent weekly candle on the far right of the chart. The structural pressure cooker has officially exploded. Institutional buyers have seized total control of the tape, printing a massive, full-bodied green expansion candle that has closed strong at 690.05 (+10.85%). This vertical thrust has decisively obliterated the 658.25 historical ceiling on an unmistakable institutional volume surge (visible in the towering cyan volume bars below). Furthermore, the price has violently pierced and is riding completely outside the upper Bollinger Band, confirming that the asset has officially transitioned out of low-volatility compression and into a high-volatility, explosive vertical markup phase.
4. The Trade Plan: Entries, Targets, and Risk Management
Entry Strategy: Macro momentum is exceptionally strong with the stock trading out in the open. Because the weekly candle is closing outside the upper Bollinger Band, chasing the price immediately carries a minor risk of a short-term, lower-timeframe mean-reversion pullback. The highest-probability, lowest-risk entry strategy involves waiting for a minor structural cooling-off period. Look to scale into long positions or place limit orders to catch a potential pullback to perfectly retest the broken 640.00 to 665.00 zone. Letting old historical resistance prove itself as concrete new support provides an unmatched risk-to-reward ratio.
Take Profit (Targets): We utilize classical structural measured moves based on the depth of the macro accumulation base. By taking the depth of the core structure (roughly 300 points from the ~350 dynamic floors up to the 658 breakout line) and projecting it upward, our primary structural macro target sits comfortably in the 940.00 to 960.00 zone. Near-term profit-taking milestones rest at the psychological round numbers of 750.00 and 850.00.
Invalidation (Stop Loss): An explosive breakout thesis is completely invalidated if the asset fails to hold its newly claimed support floor and collapses back inside the base boundaries. A hard stop loss should be placed safely below the weekly 20 SMA cushion and the mid-level structural pivot, specifically around the 490.00 to 520.00 level. A definitive weekly close completely back below 500.00 would act as a severe warning sign of a failed macro breakout and a major bull trap.
5. Time Horizon:
Because this technical setup is engineered on a 1-Week chart capturing a massive structural phase transition and an ultimate range breakout, this is a longer-term position trade designed to capture a secular markup trend over the coming months. Let the macro trend run!  Long
Long
XAUUSD 1H: Gold Recovers From SupportGold is trading around 4,327 on the 1-hour chart after showing a recovery from the lower price area.
The chart highlights two important levels:
- Support: 4,261.360
- Resistance: 4,403.030
Market Structure
Price has recently moved upward from the support region, creating a short-term recovery. However, the broader market remains between the marked support and resistance levels.
If buying interest continues, price may retest the resistance area. A rejection could lead to another pullback, while a sustained move above resistance would require confirmation from subsequent price action.
Key Points
Support: 4,261.360
Resistance: 4,403.030
Timeframe: 1H
This analysis is based on the displayed chart structure and is for educational purposes only. It is not financial advice. Market conditions can change, and no price movement is guaranteed.  Long
Long
SUDARSCHEM: Daily Inverse H&S Breakout1. The Macro Perspective: The Reversal Structure
I am taking a LONG bias on Sudarshan Chemical Industries Limited (SUDARSCHEM) on the daily (1D) timeframe.
When analyzing pure market structure, reversal patterns are critical to identifying shifts in major trends. Look at the structural development displayed on this chart. Following a painful and persistent markdown phase throughout late 2025 and early 2026, the stock carved out a deep structural bottom. Instead of a random V-shaped recovery, the stock systematically built out a textbook Inverse Head and Shoulders (H&S) pattern. This classic reversal structure visually maps the exact process of institutional accumulation, successfully transitioning the asset from a sequence of lower lows into a fresh structural uptrend.
2. The Educational Setup: The Inverse H&S and the Moving Averages
To understand the absolute technical validity behind this setup, look at the key components forming the reversal base:
The Pattern Construction: The chart perfectly defines the three foundational pillars of the reversal: a 'Left Shoulder', a deeper washout 'Head' marking the absolute floor near 741.15, and a higher-low 'Right Shoulder'. This higher low forming the right shoulder is the first major structural clue that selling pressure has completely exhausted and buyers are stepping in aggressively.
The Dynamic Cushion and Neckline: Notice how the price action behaved during the formation of the Right Shoulder. The stock decisively reclaimed the daily 20 SMA (the middle blue line of the Bollinger Bands, currently near 923.79), utilizing it as a dynamic launchpad. This rising support compressed the price action tightly against the solid black horizontal neckline at 978.60, which marks the absolute ceiling of the reversal pattern.
3. Current Price Action: Neckline Breakout and Volatility Expansion
Look at the most recent daily candles on the far right of the chart. The structural pressure cooker has exploded. Institutional buyers have stepped in with undeniable conviction, printing a massive, full-bodied green expansion candle that has surged out of the base, currently trading around 1,004.50. This vertical thrust has decisively obliterated the 978.60 neckline on an unmistakable volume surge (visible in the towering cyan volume bar below). Furthermore, the price has violently pierced the upper Bollinger Band, confirming a textbook shift out of accumulation and into a highly explosive, high-volatility markup trend.
4. The Trade Plan: Entries, Targets, and Risk Management
Entry Strategy: Momentum is exceptionally strong with the stock trading out in the open above the neckline. Chasing a vertical move immediately carries a short-term, lower-timeframe mean-reversion risk. The highest-probability, lowest-risk entry strategy involves waiting for a minor structural cooling-off period. Look to scale into long positions or place limit orders to catch a potential pullback to perfectly retest the broken 960.00 to 980.00 neckline zone. Letting old historical resistance prove itself as a concrete new support floor offers a phenomenal risk-to-reward ratio.
Take Profit (Targets): We use a classical measured move strategy based on the structural depth of the Inverse Head and Shoulders pattern. By taking the depth of the 'Head' (roughly 237 points from the 741.15 floor up to the 978.60 neckline) and projecting it upward from the breakout point, our primary structural target sits comfortably in the 1,200.00 to 1,220.00 zone. Intermediate profit-taking milestones rest near the psychological round numbers of 1,100.00 and 1,150.00.
Invalidation (Stop Loss): A structural reversal breakout thesis is completely invalidated if the price fails to hold its newly claimed neckline support and collapses back into the right shoulder. A hard stop loss should be placed safely below the daily 20 SMA and the mid-level of the Right Shoulder, specifically around the 880.00 to 900.00 level. A definitive daily close completely back below 860.00 would act as a severe warning sign of a failed reversal and a major bull trap.
5. Time Horizon:
Because this technical setup is built on a 1-Day chart capturing a classic structural reversal phase and a clear neckline breakout, this is a high-alpha swing trade designed to capture a rapid momentum markup phase over the coming weeks. Let the trend run!  Long
Long