Trading Roadmap | ClassTradical TA · Lesson 11 — Core IndicatorsLesson 11 - Core Indicators (RSI, MACD, Stochastic, Bollinger Bands)
Difficulty: Intermediate
The indicators on your chart are built from the same price data you already see. The four covered here are among the most widely followed in technical analysis — knowing how to read them can add useful context to your setups.
🔵 WHAT INDICATORS ACTUALLY DO
An indicator does not see the future — it reorganizes past price (and sometimes volume) into a different visual form. That can make certain conditions easier to spot: fading momentum, stretched moves, or quiet periods before expansion.
Two useful categories to keep in mind:
- Oscillators (RSI, Stochastic) — move between fixed bounds; often more useful in ranging markets
- Trend/momentum tools (MACD, Bollinger Bands) — follow price openly; often more useful for reading trend strength and volatility
No indicator needs to be traded on its own. Most experienced traders use them as context on top of the structure you learned in earlier lessons.
🔵 RSI — RELATIVE STRENGTH INDEX
RSI measures the speed of recent price changes on a 0–100 scale.
- Above 70 → often described as overbought (momentum stretched to the upside)
- Below 30 → often described as oversold (momentum stretched to the downside)
Important nuance: in a strong trend, RSI can stay overbought or oversold for a long time. A high reading alone is not a sell signal.
One of the more widely watched RSI signals is divergence — price makes a new high while RSI makes a lower high (or the reverse at lows). This can suggest momentum is fading, especially when confirmed by a reversal pattern from Lesson 7.
🔵 MACD — MOVING AVERAGE CONVERGENCE DIVERGENCE
MACD builds directly on the moving averages from Lesson 10. It shows the relationship between a faster and a slower average of price, plus a signal line and a histogram.
Common ways traders read it:
- MACD line crossing the signal line — can indicate a shift in short-term momentum
- Histogram shrinking — the current push may be losing strength
- MACD crossing the zero line — often read as a broader momentum shift
Because MACD is built from moving averages, it lags by design. It tends to work better for confirming momentum than for picking exact tops and bottoms.
🔵 STOCHASTIC OSCILLATOR
The Stochastic compares the latest close to the recent high–low range: readings near 100 mean price is closing near the top of its recent range, near 0 means the bottom.
- Above 80 / below 20 → commonly used overbought/oversold zones
- %K crossing %D inside those zones → a frequently watched trigger
Stochastic tends to shine in sideways markets, where price rotates between support and resistance (Lesson 3). In strong trends it can stay pinned at extremes, so many traders only take its signals in the direction of the larger trend.
🔵 BOLLINGER BANDS
Bollinger Bands wrap a moving average with an upper and lower band that expand and contract with volatility.
- Wide bands → volatile conditions
- Narrow bands (the "squeeze") → quiet conditions that often precede expansion — direction unknown until price shows its hand
- Band walk → in strong trends, price can ride along one band for extended periods; touching a band is not by itself a reversal signal
A squeeze followed by a decisive close outside the bands, supported by volume (Lesson 9), is one of the more commonly watched volatility setups.
In the chart above: notice how the bands tightened in late December while price moved sideways — quiet conditions. The expansion arrived in late January with a strong break to the downside. The squeeze suggested a bigger move may be building, but the direction only became clear once the break happened.
🔵 COMBINING THEM WITHOUT CLUTTER
More indicators does not mean more clarity. A practical approach:
- Pick at most one oscillator and one trend/volatility tool
- Let structure lead: levels, trend, and volume first — indicators as confirmation
- Avoid stacking indicators that measure the same thing (RSI + Stochastic together mostly repeat each other)
🔵 COMMON MISTAKES
- Selling just because RSI is above 70 in a strong uptrend
- Taking every MACD crossover in a ranging market, where whipsaws are frequent
- Treating a Bollinger Band touch as an automatic reversal signal
- Loading five indicators and losing sight of price itself
🐳 PRO TIPS
- Divergence signals often carry more weight on higher timeframes — a 4H or daily divergence tends to matter more than a 5-minute one.
- When an oscillator signal appears at a level you already marked (Lesson 3) inside a clear trend (Lesson 2), the context is doing most of the work — the indicator is just the trigger.
- Try removing all indicators for a week and trading structure only, then add one back. Many traders find this reveals which tool actually helps them.
- Default settings (RSI 14, MACD 12/26/9, Stochastic 14/3/3, BB 20/2) are a starting point — consistency matters more than optimization.
If this lesson helped you, drop a comment with the indicator you rely on most — and let us know which topic you want covered next. 🐳
Full Trading Roadmap | Classical TA Course
Trading Roadmap | Classical TA · Lesson 01 — Mastering the Chart
Trading Roadmap | Classical TA · Lesson 02 — Mastering Trends
Trading Roadmap | Classical TA · Lesson 03 — Support & Resistance
Trading Roadmap | Classical TA · Lesson 04 — Price Channels
Trading Roadmap | Classical TA · Lesson 05 — Single Candle Patterns
Trading Roadmap | Classical TA · Lesson 06 — Multi-Candle Patterns
Trading Roadmap | Classical TA · Lesson 07 — Reversal Chart Patterns
Trading Roadmap | Classical TA · Lesson 08 — Continuation Chart Patterns
Trading Roadmap | Classical TA · Lesson 09 — Volume Analysis
Trading Roadmap | Classical TA · Lesson 10 — Moving Averages
Best Regards, BigBeluga 🐳  Education
The Trade You Almost TookYou saw the setup. The level made sense, the risk was clear, and your analysis pointed in one direction.
But you waited.
Maybe you wanted one more confirmation. Maybe you hesitated for a few seconds. Maybe you simply looked away at the wrong moment.
Then price moved exactly as you expected.
You never entered the trade, so technically you lost nothing. But mentally, it doesn't always feel that way. You start calculating the profit you "could have made," replaying the entry in your head, and wondering why you didn't trust yourself.
The trade is gone. Yet somehow, you're still trading it.
1. A Missed Trade Can Feel Like a Real Loss
Your account balance hasn't changed, but your mind may already be counting imaginary profit. You think about the entry you almost took and calculate how much the move would have paid.
That's where the problem begins: You start emotionally reacting to money that was never actually yours. A missed opportunity slowly starts feeling like something the market took away from you.
2. The "I Knew It" Trap
When price follows your original analysis, confidence can quickly turn into frustration. You tell yourself: "I knew this was going to happen."
But knowing a possible direction and executing a trade are two different skills. After the move becomes obvious, it's easy to forget the uncertainty you felt before it started.
3. The Next Setup Suddenly Looks Better
After missing a strong move, traders often become less selective. An average setup appears, but because you don't want to miss another trade, it feels more attractive than it normally would.
The setup hasn't improved: Your standards have simply dropped. You're no longer judging the opportunity alone. You're comparing it with the trade you just missed.
4. You Start Chasing a Trade That Is Already Over
Sometimes traders enter late into the same move, even when the original entry and risk-to-reward are gone. The thought is simple: "There must still be some movement left."
At that point, you're not following the original plan anymore. You're trying to participate in a story that has already started without you.
5. Missed Profit Is Not Lost Money
This sounds obvious, but traders often forget it in the moment. You cannot lose profit from a position you never opened.
The market didn't take anything from you. Your mind created an expected reward, mentally added it to your account, and then felt disappointed when reality didn't match that imaginary result.
6. Don't Punish the Next Trade
The next setup has nothing to do with the opportunity you missed. It doesn't deserve a bigger position, a faster entry, or lower standards just because you're frustrated.
Ask yourself: "Would I take this trade if I hadn't seen the previous move?" If the answer is no, you're probably still reacting to the missed trade.
7. Let the Trade Leave Without You
Some trades will move perfectly without your position. That's part of trading. You will miss entries, hesitate, close charts too early, and occasionally watch your exact analysis play out from the sidelines.
Review why you missed it. If you broke a rule, learn from it. If you followed your process, accept it. Then let the trade go.
Conclusion:
The trade you almost took can be more dangerous than a losing trade because the damage isn't visible on your P&L. It appears in the decisions that come after it: The rushed entry, the forced setup, the oversized position, or the trade you chase because you don't want to miss twice.
A missed trade is not a debt the market owes you.
Remember: The opportunity is over. Your next decision doesn't have to pay for it. Education 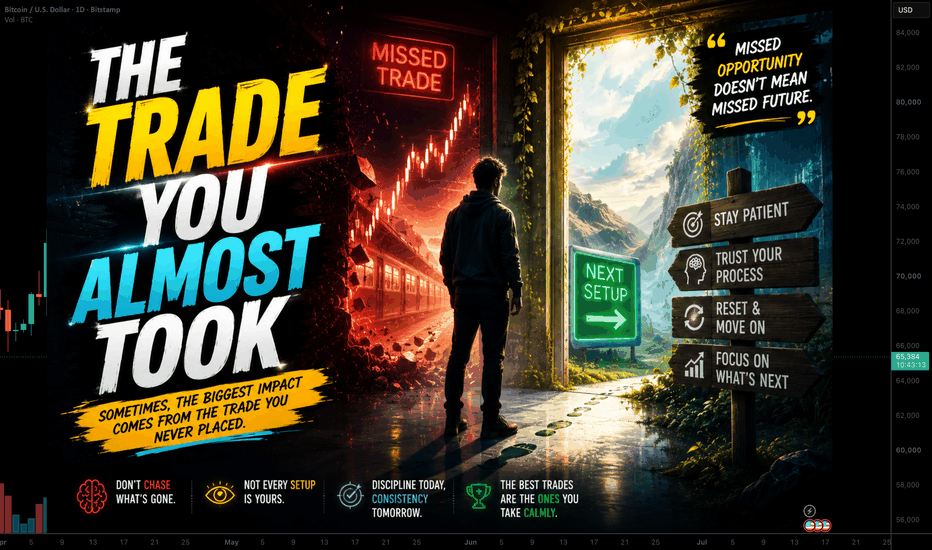
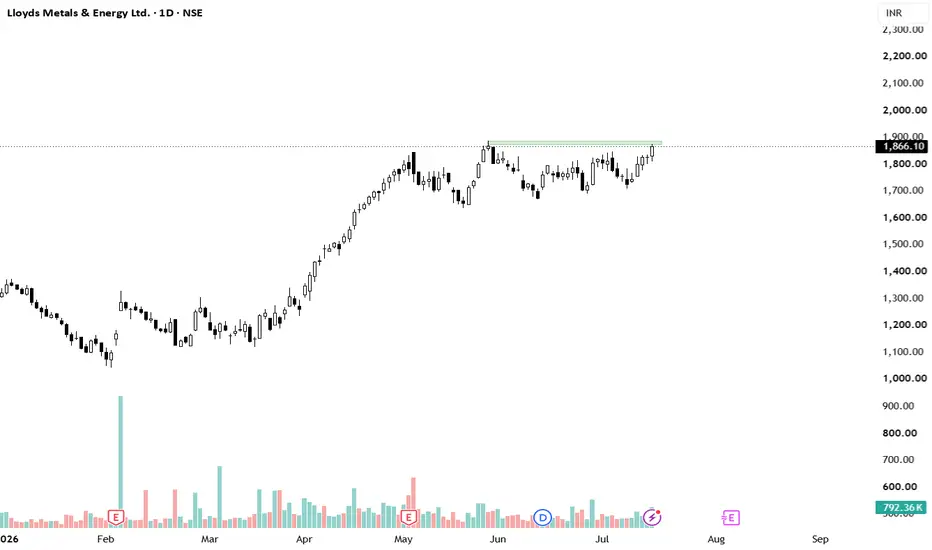
Lloyds Metals Rally Continuation? Breakout Above ₹1,900 Ahead?Lloyds Metals & Energy Ltd. has delivered an impressive uptrend since early 2026, rising from the ₹1,100–1,300 range to the current levels near ₹1,866. The stock is now consolidating just below the psychological ₹1,900 resistance.
Key Levels to Watch:
Resistance: ₹1,900 (immediate and critical).
Support: ₹1,800–1,850 zone.
A decisive close above ₹1,900 with healthy volume would strengthen the bullish case for continuation toward ₹2,000+.
Outlook:
The broader trend remains positive. If the current momentum sustains and resistance is cleared, the rally appears likely to extend. Traders should monitor price action around the ₹1,900 level closely in the coming sessions.
Sector tailwinds in metals and energy may provide additional support. Risk management is advised given market volatility.
Will the rally continue? Your views welcome.  Long
Long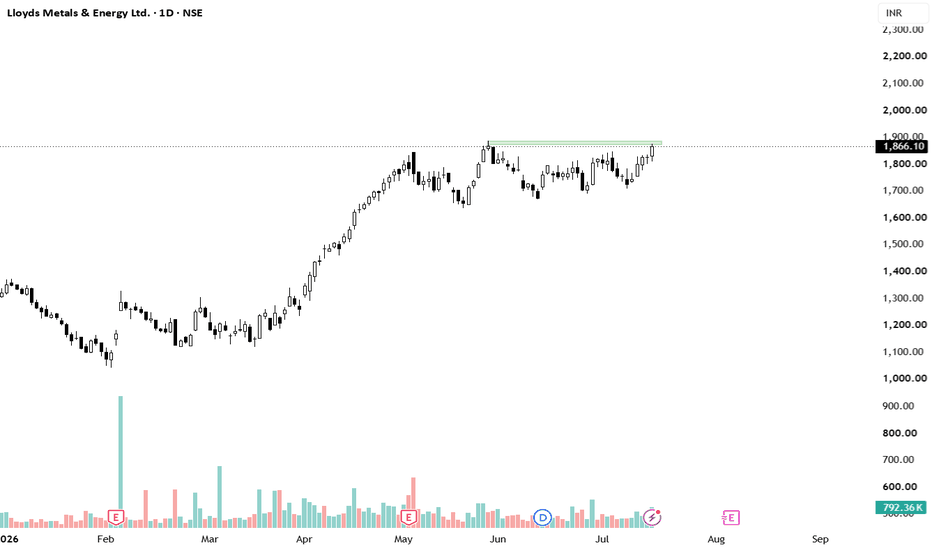
 Long
Long
 Long
Long
 Long
Long
ABB Symmetrical Triangle Consolidation________________________________________
📊 ABB India: Daily Technical Snapshot – Symmetrical Triangle Consolidation
📊 STWP Technical Analysis
________________________________________
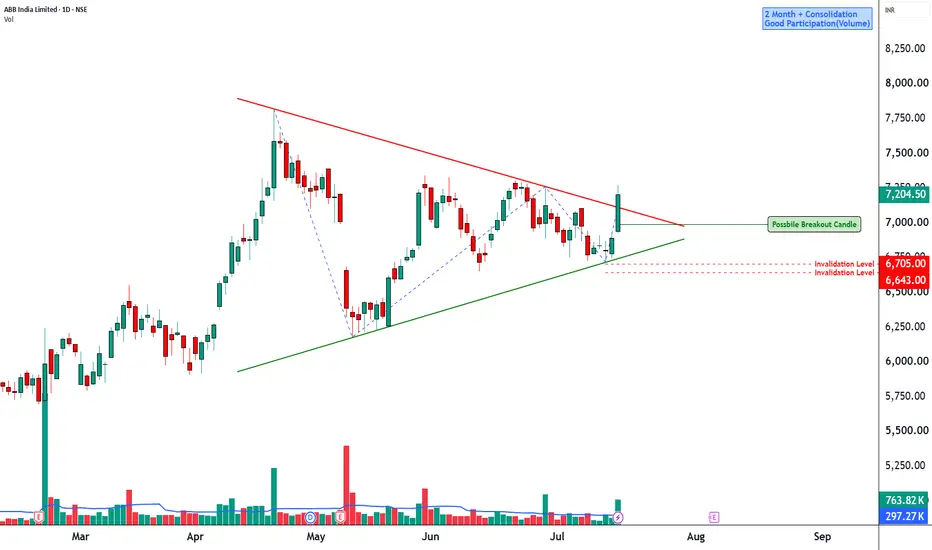
MARKET STRUCTURE SNAPSHOT | NSE: ABB
Closing Price: ₹7,204.50 (+₹312.50 | +4.53%)
Core Trend: Long-Term Uptrend
Market State: Consolidation Within Uptrend
Price Structure: Price is consolidating inside a Symmetrical Triangle, reflecting a period of compression following the previous rally. The structure suggests that buyers and sellers are reaching equilibrium, with a breakout likely to determine the next directional move.
________________________________________
OPERATIONAL PRICE GRID & KEY REFERENCE LEVELS
Model Reference Level: ₹7,270.00
Hard Invalidation Level: ₹6,643.20
Structural Risk: ₹626.80 (8.62%)
Resistance Levels: R1 ₹7,340.83 | R2 ₹7,477.17 | R3 ₹7,684.33
Support Levels: S1 ₹6,997.33 | S2 ₹6,790.17 | S3 ₹6,653.83
Range Structure: Low ₹6,643.20 | High ₹7,684.33
Higher Timeframe Observation Zones: ₹7,477 | ₹7,684 | ₹8,000
________________________________________
MOMENTUM, PARTICIPATION & CPR DATA
Volume Profile: 763.82K Shares
Volume Character: Strong Relative Participation
RSI: 58.93 (Positive Momentum Zone)
ADX: 11.75 (Low Trend Strength – Compression Phase)
ROC: +3.86%
MACD Status: Momentum Improving
CCI: +68.25 (Positive Momentum)
Stochastic Reading: 88.19 (Strong Momentum Zone)
Current Bias: WAIT FOR BREAKOUT CONFIRMATION
CPR State: Bullish Zone | CPR Moving Up (Wide)
Today's CPR: Pivot ₹6,852.00 | Top ₹6,872.00 | Base ₹6,832.00
Tomorrow's CPR (Projected): Pivot ₹7,133.65 | Top ₹7,169.10 | Base ₹7,098.25
________________________________________
📚 EDUCATIONAL OBSERVATION
ABB India continues to consolidate within a Symmetrical Triangle, a chart pattern that commonly develops after a strong directional move as the market enters a temporary period of balance between buyers and sellers. The series of lower highs and higher lows reflects gradually narrowing price swings, often preceding a volatility expansion.
The stock remains within its broader uptrend despite the ongoing consolidation. Rather than signalling weakness, the current structure appears to represent a pause following the previous advance. Such consolidation phases frequently allow momentum indicators to cool before the next significant move develops.
Momentum indicators remain constructive despite the consolidation. The RSI at 58.93 remains comfortably above the neutral zone, suggesting buyers continue to hold an advantage. ROC at +3.86% reflects positive price momentum, while CCI at +68.25 remains in bullish territory. MACD is stabilising after the previous correction, indicating improving momentum. Meanwhile, ADX at 11.75 confirms the market is currently in a low-trend environment, which is typical during triangle formations before a decisive breakout.
The projected Central Pivot Range (CPR) for the next trading session has shifted higher, with the projected Pivot at ₹7,133.65. A rising and widening CPR generally reflects improving acceptance of higher prices and provides a supportive backdrop should a breakout emerge.
The immediate technical focus remains on the upper boundary of the Symmetrical Triangle, which coincides with the resistance zone between ₹7,340 and ₹7,477. A decisive close above this region, supported by stronger-than-average trading volume, would confirm the continuation breakout and strengthen the probability of a move towards ₹7,684 and potentially the psychological ₹8,000 level. Conversely, failure to hold the lower trendline could shift attention towards the support levels near ₹6,997 and ₹6,790.
________________________________________
🏢 BUSINESS OVERVIEW
ABB India is a leading provider of electrification, industrial automation, robotics and motion technologies. The company benefits from India's ongoing investment in manufacturing, infrastructure, renewable energy, data centres and industrial automation. Rising capital expenditure across these sectors continues to support long-term demand for ABB India's products and engineering solutions.
________________________________________
📖 Educational Note
Support and resistance levels should be treated as observation zones rather than predictive targets. Chart patterns, price action, volume analysis, momentum indicators and CPR are educational tools that help market participants understand evolving market structure within a disciplined risk-management framework.
________________________________________
⚠️ Disclaimer
This analysis is provided strictly for educational and informational purposes.
It does not constitute financial, investment or trading advice and should not be interpreted as a recommendation to buy or sell any security.
Stock market investments are subject to market risks, including the possible loss of capital.
Historical performance, chart patterns and technical indicators do not guarantee future results.
Please conduct your own research and consult a SEBI-registered investment adviser before making investment decisions.
STWP assumes no responsibility or liability for any financial loss arising directly or indirectly from the use of this analysis.
 Long
Long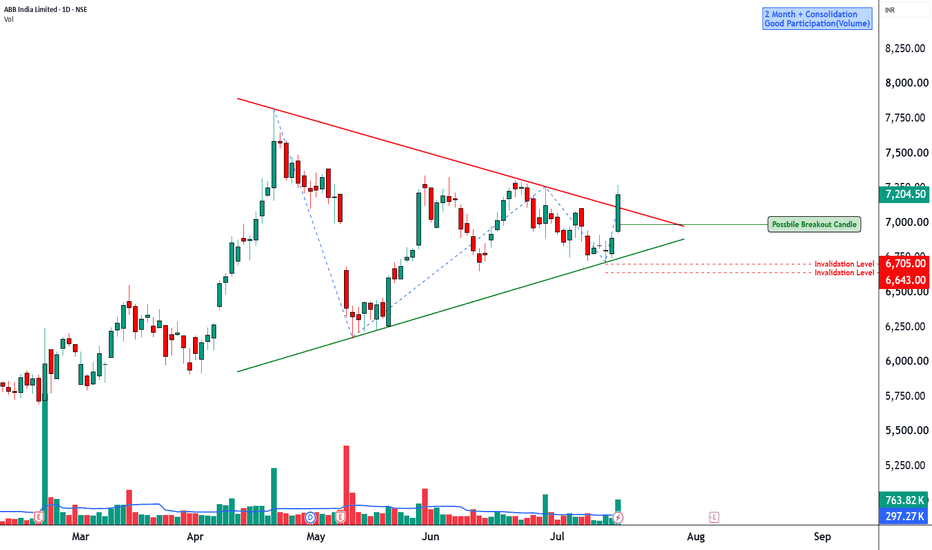
Support & Resistance: The Only Two Words You Really Need to KnowOverview
If you're new to charts, here's the good news — almost everything else in technical analysis is built on top of just two ideas: support and resistance. Once these click, patterns, trendlines, and setups all start making a lot more sense. Let's break it down simply.
What Is Support?
Support is just a price level where buyers have shown up before. Think of it like a floor — price falls toward it, buyers step in, and it bounces back up. It doesn't always hold, but it's a zone worth watching.
What Is Resistance?
Resistance is the opposite — a price level where sellers have shown up before. Think of it like a ceiling — price rises toward it, sellers step in, and it falls back down.
Different Types of Support & Resistance
Not all support and resistance look the same. Here are the common types you'll come across:
Type 1 - Horizontal Support/Resistance — the simplest kind. Just a flat price level where price has bounced or reversed multiple times in the past. Easiest one to spot for beginners.
Type 2 - Trendline Support/Resistance — a sloped line connecting a series of highs or lows. Rising trendlines act as support, falling trendlines act as resistance.
Type 3 - Moving Average Support/Resistance — averages like the 50 EMA or 200 EMA often act like a "floor" or "ceiling" too, especially on higher timeframes like weekly or monthly charts.
Type 4 - Psychological Levels — round numbers like 1,000, 500, or 100 often act as support/resistance simply because a lot of traders place orders around these numbers.
Type 5 - Old Swing Highs/Lows — a previous high or low left behind on the chart tends to matter again later, even months down the line.
How to Actually Identify These on a Chart
Here's a simple way to start:
Look left. Has price touched this level before? The more times it's been tested, the more people are watching it.
Look for reactions, not just touches. A level only matters if price actually reacted there — bounced, reversed, or paused.
Zoom out. A level that matters on the weekly chart is usually more important than one that only shows up on the 5-minute chart.
How to "Play" Support & Resistance
Once you've spotted a level, here's how traders typically use it:
Buying near support: Some traders wait for price to reach support and show signs of holding (like a strong bounce candle) before buying.
Selling/booking profit near resistance: Others use resistance as a place to book profits or expect a pause.
The flip rule: Here's a neat trick — once resistance is broken, it often becomes support going forward (and vice versa). This is called a "role reversal" and it's one of the most useful ideas in trading.
Waiting for a retest: As we always prefer, it's usually safer to wait for price to retest a broken level and confirm it's holding, rather than jumping in the moment it breaks.
A Common Beginner Mistake
New traders often think a level is either "100% support" or "not support at all." In reality, these are zones, not exact lines — think of them as an area, not a single price. Give some room around the number rather than expecting a perfect bounce to the rupee.
Beginner's Lesson
The next time you open a chart, before looking at any indicator or pattern, just ask: where has price reacted before? Mark those zones first. You'll be surprised how much of the "story" of a stock becomes clear just from doing this one simple step.
Conclusion
Support and resistance aren't fancy or complicated — they're just the market's memory of where buyers and sellers have shown up before. Master this one concept, and a lot of the rest of technical analysis starts falling into place naturally.
For educational purposes only. Chart shown is for illustration only. Not financial advice  Education
Jubilant Pharmova Limited Breakout StructureCurrent Price Action
Last Traded Price (LTP): ₹1,011.40 (Up by +3.79% or +₹36.95)
Daily Range: Open ₹979.30 | High ₹1,013.90 | Low ₹976.25
Indicators
9 SMA: Currently at ₹976.94
Supertrend (7, 2): Currently at ₹943.08 (indicating a bullish trend)
Chart Patterns & Structure
Consolidation Channel: The stock spent May, June, and early July consolidative within a defined horizontal rectangular range.
Breakout: The current daily candle shows a clear breakout above the Upper Breakout Weekly level (marked around ₹1,019.90).
Annotation Note: The chart explicitly notes a "Daily 9 SMA and Super trend break out", indicating strong upward momentum supported by these moving averages.
Key Support & Resistance Levels
Resistance / Targets
Stop Loss: 978
Primary Target: ₹1,118.50
Secondary Target: ₹1,184.80
Full Target: ₹1,248.00
Support / Breakout Levels
Upper Breakout Weekly: ₹1,019.90 (Immediate pivot zone being tested)
Lower Break Down Weekly: ₹931.05 (Bottom of the consolidation range)
Disclaimer: aliceblueonline.com Education 
 Long
Long
 Long
Long
 Long
Long
NIFTY ANALYSIS | THURSDAY, 16 JULY 2026 | DAILY →4H →1H→15MIN TF# 📊 NIFTY ANALYSIS | THURSDAY, 16 JULY 2026 | DAILY → 4H → 1H → 15M → 5M 🔥
**Previous Close:** **24,078.50**
**Change:** **+26.45 (+0.11%)**
NIFTY managed to close marginally higher after another volatile session, but the price action lacked conviction. The index spent most of the day below the **Volume Profile Point of Control (POC) at 24,193**, indicating that buyers are still struggling to regain control. The latest option chain shows **massive Call writing between 24,100 and 24,300**, while Put writers continue defending **24,000**, suggesting institutions expect another range-bound session unless a decisive breakout occurs. Markets have once again demonstrated that moving just enough to confuse everyone is apparently a full-time profession.
---
# 📌 PREVIOUS SESSION OHLC (15 JULY 2026)
* **Open:** 24,085.85
* **High:** 24,220.35
* **Low:** 24,010.55
* **Close:** **24,078.50**
---
# 📈 DAILY CHART ANALYSIS
* Price continues trading below the Volume Profile POC near **24,193**, indicating overhead supply.
* The broader structure remains inside a consolidation despite recovering from the previous day's decline.
* Buyers defended **24,000**, but failed to sustain above **24,200**.
* RSI remains around the neutral zone, suggesting neither bulls nor bears have complete control.
* A close above **24,200-24,220** would improve short-term momentum.
---
# 📊 DAILY FIBONACCI LEVELS
**Swing High:** 26,354.05
**Swing Low:** 22,184.45
| Fibonacci Level | Price |
| --------------- | ------------: |
| 23.6% | **23,168.50** |
| 38.2% | **23,777.25** |
| 50.0% | **24,269.25** |
| 61.8% | **24,761.25** |
| 65.0% | **24,894.70** |
| 78.6% | **25,461.75** |
| 1.618 Extension | **26,098.50** |
### Institutional Interpretation
* NIFTY continues trading below the crucial **50% Fibonacci level (24,269)**.
* Sustaining above **24,269** is required for stronger bullish momentum.
* Until then, every rally is likely to encounter institutional selling.
---
# 🏦 MARKET BIAS
🟢 **Bullish Above:** **24,200**
🟡 **Range Bound:** **24,000 – 24,200**
🔴 **Bearish Below:** **24,000**
---
# 🏛️ INSTITUTIONAL VIEW
### Market Regime
Consolidation with a slight bearish bias.
### Control
Call writers continue dominating above **24,100**, while Put writers aggressively defend **24,000**.
### Immediate Resistance
* 24,100
* 24,193 (POC)
* 24,200
* 24,300
### Immediate Support
* 24,000
* 23,950
* 23,900
* 23,800
---
# 📊 OPTION CHAIN VIEW (Latest)
### ATM Strike
**24,100**
### Maximum Call OI
✅ **24,200** (1,43,031)
### Maximum Put OI
✅ **24,000** (95,854)
### Aggressive Fresh Call Writing
* **24,200 (+77,148 OI)**
* **24,150 (+42,952 OI)**
* **24,300 (+27,980 OI)**
* **24,250 (+27,110 OI)**
* **24,100 (+15,556 OI)**
### Strong Fresh Put Writing
* **24,100 (+24,387 OI)**
* **24,000 (+22,646 OI)**
* **24,150 (+23,130 OI)**
* **24,200 (+18,042 OI)**
* **24,050 (+16,429 OI)**
### Institutional Interpretation
* Heavy Call writing between **24,150-24,300** creates a strong resistance zone.
* Strong Put additions at **24,000-24,100** indicate institutions are defending lower levels.
* Unless 24,200 is convincingly crossed, expect selling pressure on rallies.
---
# 📊 VOLUME PROFILE ANALYSIS
### Point of Control (POC)
**24,193**
### High Volume Node
**24,170 – 24,210**
### Interpretation
* Price closed below the POC.
* Acceptance above **24,193** would strengthen bullish momentum.
* Repeated rejection below the POC keeps sellers in control.
---
# 🟢 HIGH PROBABILITY CE TRADE
### Setup
15-minute close above **24,200**
### Confirmation
* Retest holds
* RSI above 55
* Strong buying volume
### Stop Loss
24,120
### Targets
* **T1:** 24,250
* **T2:** 24,300
* **T3:** 24,380
### Probability
**38%**
---
# 🔴 HIGH PROBABILITY PE TRADE
### Setup
15-minute close below **24,000**
### Confirmation
* Failed retest
* RSI below 45
* Strong selling volume
### Stop Loss
24,090
### Targets
* **T1:** 23,950
* **T2:** 23,900
* **T3:** 23,800
### Probability
**35%**
---
# 📈 MULTI-TIMEFRAME ANALYSIS
## 4H Timeframe
**Trend:** Neutral
**Support:** 24,000 / 23,900
**Resistance:** 24,193 / 24,300
---
## 1H Timeframe
**Trend:** Sideways
Momentum remains capped below the Volume Profile POC.
---
## 15-MIN Timeframe
### Resistance
* 24,100
* 24,193
* 24,200
* 24,300
### Support
* 24,000
* 23,950
* 23,900
---
## 5-MIN EXECUTION PLAN
### CE Buyers
Trade only after a sustained breakout above **24,200**.
**Targets:**
24,250 → 24,300 → 24,380
### PE Buyers
Trade only after a confirmed breakdown below **24,000**.
**Targets:**
23,950 → 23,900 → 23,800
---
# 🎯 TRADING SCENARIOS
### 🟢 Scenario 1: Bullish Breakout
**Probability:** 38%
**Trigger:** Sustained move above **24,200**
**Targets:** 24,250 → 24,300 → 24,380
---
### 🟡 Scenario 2: Sideways Consolidation
**Probability:** 42%
**Range:** 24,000 – 24,200
Expect option sellers to dominate within this range.
---
### 🔴 Scenario 3: Bearish Breakdown
**Probability:** 20%
**Trigger:** Sustained move below **24,000**
**Targets:** 23,950 → 23,900 → 23,800
---
# ⚠️ INVALIDATION LEVELS
### Bullish View Invalid
15-minute close below **24,000**
### Bearish View Invalid
Sustained close above **24,300**
---
# 💡 KEY TRADER NOTE
* **24,000** remains the strongest institutional support backed by the highest Put Open Interest.
* **24,200** has become the biggest hurdle, supported by the highest Call Open Interest and aggressive fresh Call writing.
* **24,193 (Volume Profile POC)** is the key institutional pivot. A sustained move above it can shift short-term momentum back to the bulls.
* Until NIFTY breaks decisively above **24,200** or below **24,000**, expect another range-bound session where disciplined execution is likely to outperform bold predictions. Humans call this "waiting for confirmation." The market calls it "charging option premiums from impatient traders."
#Nifty50 #TechnicalAnalysis #PriceAction #OptionTrading #StockMarketIndia #IntradayTrading #SwingTrading #BankNifty #Fibonacci #SupportAndResistance #Options #NSE #TradingStrategy #MarketStructure #VolumeAnalysis #SmartMoney #TechnicalCharts #MomentumTrading #IndianStockMarket #RiskManagement Short 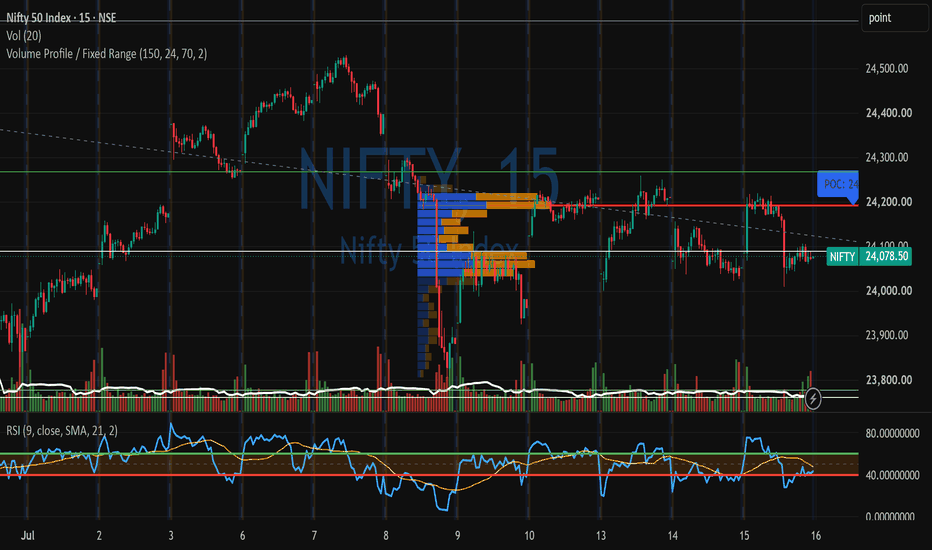
 Long
Long