Bank Nifty Regains Momentum Near Crucial ResistanceHighlights
* Bank Nifty has witnessed a sharp rebound led by heavyweight private sector banks, with renewed buying interest emerging ahead of the Q1FY27 earnings season. The index has reclaimed its short-term moving averages, reinforcing the broader bullish structure.
* The **57,800–58,000** zone remains the immediate resistance area. A decisive close above this range could trigger fresh buying momentum and pave the way for an advance towards **58,500–58,800** in the near term.
* On the downside, the **57,200–57,400** range serves as immediate support, while the **56,800** level remains a strong medium-term demand zone. Holding above these levels would keep the bullish outlook intact.
* Momentum indicators are showing signs of improvement, with RSI rebounding from neutral territory and MACD indicating strengthening momentum. Improving market breadth within the banking space further supports the ongoing recovery.
* The index has formed a higher-low pattern on the daily chart after successfully defending its key support zone, suggesting that buyers continue to accumulate positions on declines rather than chasing prices at higher levels.
* Strong participation from banking heavyweights such as HDFC Bank, ICICI Bank, and SBI, coupled with optimism surrounding quarterly earnings, continues to provide a favorable backdrop for Bank Nifty's technical setup.
Takeaway
Bank Nifty is displaying encouraging signs of a recovery following its recent consolidation phase. A sustained move above **58,000** could accelerate buying momentum and push the index towards the **58,500–58,800** zone. As long as Bank Nifty holds above the **57,200–57,400** support range, the technical bias remains positive, making short-term declines potential buying opportunities rather than indications of a trend reversal.
 Short
Short
 Long
Long
Short 
XAUUSD — Buy Zone Holding, Bullish Recovery SetupXAUUSD — Buy Zone Holding, Bullish Recovery Setup
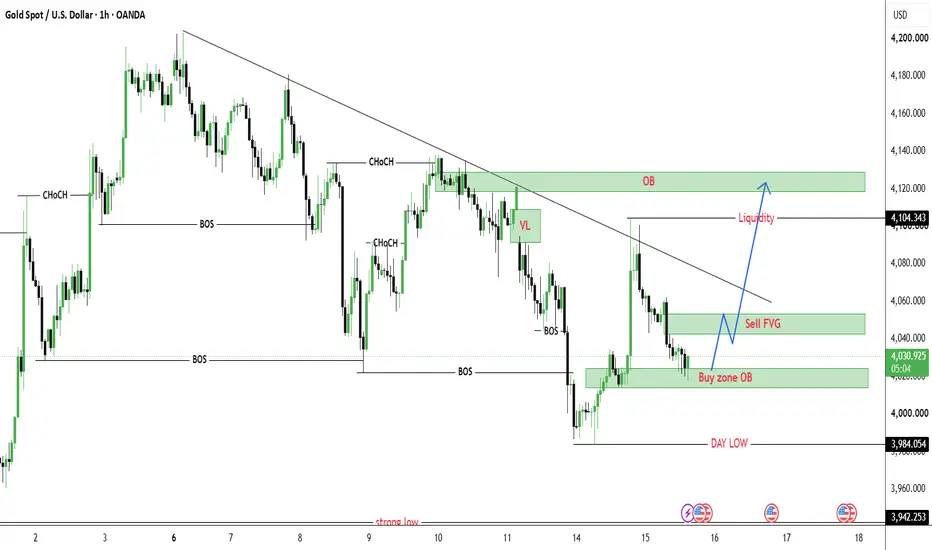
Gold is trading around $4,029 after pulling back into the short-term Buy zone OB. The market reacted from the lower structure near $3,984 and is now trying to build a recovery from the current demand area.
From an SMC perspective, gold has already swept the day low liquidity and started to recover above the buy zone. The recent pullback into $4,017–$4,030 looks more like a liquidity retest than a full bearish continuation. As long as price can hold above this OB area, buyers still have a chance to push gold back toward the Sell FVG zone first, then the higher liquidity around $4,104.
The main plan is to avoid selling low after price has already reached the demand area. If gold holds the Buy zone OB and forms bullish confirmation, the next move can target $4,045–$4,052 first. A clean break above that area would open the path toward the liquidity zone around $4,104 and the upper OB area near $4,120–$4,130.
Buy setup 1
Condition:
Gold holds the Buy zone OB around $4,017–$4,030 and forms bullish rejection with lower timeframe MSS / CHOCH.
Entry: $4,017–$4,030
SL: below $3,984
TP1: $4,045–$4,052
TP2: $4,075
TP3: $4,104
TP4: $4,120–$4,130
Buy setup 2
Condition:
If gold breaks above the Sell FVG area and retests it as support, bullish continuation becomes stronger.
Entry: above $4,052 after breakout retest
SL: below $4,017
TP1: $4,075
TP2: $4,104
TP3: $4,120–$4,130
Buy setup 3
Condition:
If gold sweeps below the current buy zone but quickly reclaims $4,017–$4,030, this can create a stronger liquidity-trap buy setup.
Entry: after reclaim above $4,017–$4,030
SL: below the sweep low
TP1: $4,045–$4,052
TP2: $4,075
TP3: $4,104
Sell scalping setup
Condition:
Selling is not the main priority. A sell scalp is only valid if gold reaches the Sell FVG zone around $4,045–$4,052 and shows clear bearish rejection.
Entry: $4,045–$4,052 after rejection
SL: above $4,075
TP1: $4,030
TP2: $4,017
TP3: $3,984
Key levels
Current price area: $4,029
Buy zone OB: $4,017–$4,030
Day low liquidity: $3,984
Strong low liquidity: $3,942
Sell FVG reaction zone: $4,045–$4,052
Short-term liquidity: $4,104
Upper OB target zone: $4,120–$4,130
Bullish continuation confirmation: clean break above $4,052
Stronger bullish confirmation: clean break above $4,104
Bullish invalidation: clean 2H close below $3,984
My current view is that gold is trying to build a bullish recovery from the Buy zone OB. The Prime Gold plan is to avoid selling into demand and wait for confirmation around $4,017–$4,030. If buyers defend this area, gold may recover toward $4,045, $4,075, $4,104 and potentially the upper OB zone around $4,120–$4,130.
No confirmation, no trade.
Long 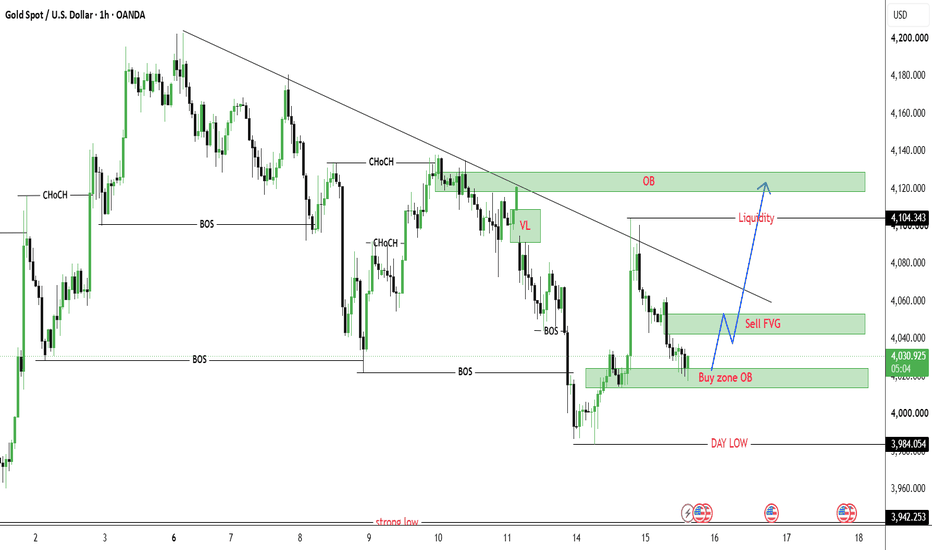
XAUUSD — 4,021 Is Feeding the Bounce XAUUSD — 4,021 Is Feeding the Bounce
Gold is trying to breathe again from the lower side of the range, but this bounce still feels like a market that needs to prove itself before traders fully trust it.
Price swept down into the lower FVG around 4,000 - 4,021.815, then started pushing back toward 4,054.400. That reaction is important because it tells us sellers may have already taken the easy liquidity below the recent low. When price grabs sell-side liquidity and then climbs back above the broken area, it can turn the low into a short-term trap zone.
For newer traders, this is where the story becomes simple. The market dropped hard first, pulled liquidity from weak buyers, then began recovering while the USD paused before CPI and Fed-related comments. That does not mean gold is fully bullish again, but it does mean the lower FVG has woken up as a reaction zone.
My main view is short-term bullish while gold holds above 4,021.815. If buyers can keep price above this level and reclaim 4,054.400, the next area I expect price to hunt is the sell premium zone around 4,085 - 4,100.355. That zone matters because it is where late buyers may start chasing, and where sellers may test the strength of this recovery.
If gold breaks through that premium area cleanly, the upper FVG around 4,125 - 4,140 becomes the next magnet. But I still want to keep the bigger picture honest: sticky inflation, geopolitical tension, and Fed expectations may limit the upside, so this looks more like a controlled recovery than a clean bullish trend reversal.
This bullish bounce becomes weak if gold loses 4,021.815 and fails to recover. If that happens, the lower FVG reaction failed, and price may look for liquidity back near 3,983.545 or even 3,960.275.
Key price zones to watch
Current reaction area: 4,054.400
Main demand / lower FVG zone: 4,000 - 4,021.815
Bullish confirmation zone: clean reclaim above 4,054.400
Main upside reaction zone: 4,085 - 4,100.355
Upper FVG target: 4,125 - 4,140
Lower support if buyers fail: 3,983.545
Major lower liquidity: 3,960.275
Invalidation: clean close below 4,021.815
Do you see this as a real bounce from the lower FVG, or just a liquidity pullback before sellers return near the premium zone?
Long 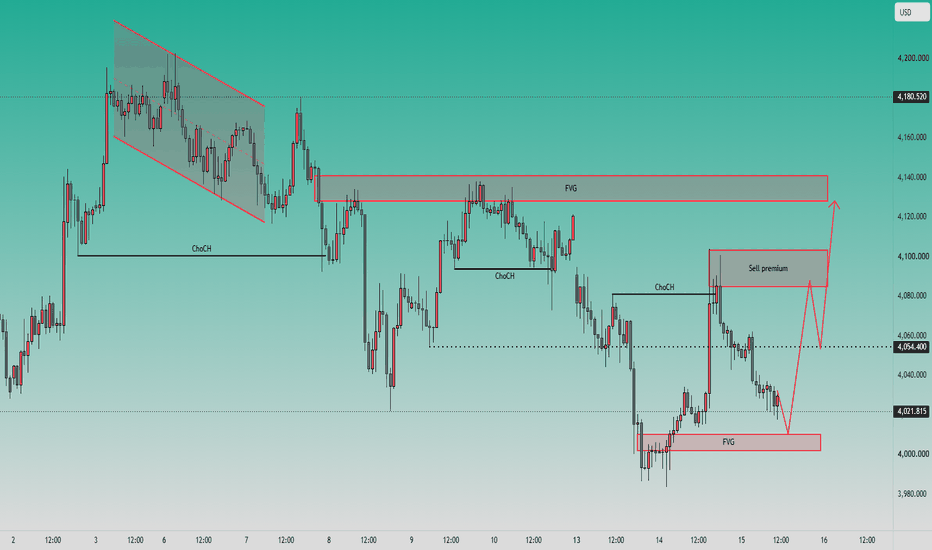
XAUUSD: Bearish Wave 5 May Persist TodayGold is showing weakness again after failing to hold the recovery structure above the short-term resistance area. From Kelly’s view, the current chart suggests that price may be developing a bearish wave 5 move, with sellers still active below the 4,035–4,040 sell zone.
The key idea is simple: gold is trying to rebound, but the structure still favors downside continuation while price remains below resistance.
⟡ Market structure
The chart shows gold completed a short recovery after reacting from the lower area, but buyers failed to sustain momentum above the 4,062 resistance level. Price then started forming lower highs again and is now trading near 4,026.
The support zone around 4,015–4,025 is currently being tested. If this area breaks with clear bearish pressure, gold may continue lower towards the Fibonacci 1.618 target zone around 3,960–3,970.
The sell zone around 4,035–4,040 is important. As long as price remains below this area, the bearish intraday structure remains active.
➤ Key levels
◌ 4,035–4,040: sell zone wave 4 and short-term resistance
◌ 4,026: current reaction area
◌ 4,015–4,025: support area under pressure
◌ 4,062: key resistance and bullish invalidation zone
◌ 3,960–3,970: Fibonacci 1.618 target and wave 5 downside area
◌ Above 4,062: area where the bearish wave setup weakens
⌁ Elliott Wave view
From an Elliott Wave perspective, gold appears to be forming a bearish 5-wave structure after the recovery failed near resistance.
Wave 1 created the first downside reaction from the recent high.
Wave 2 corrected higher but failed below resistance.
Wave 3 pushed price back into the support zone.
Wave 4 may now be forming around the 4,035–4,040 sell area.
If this zone holds, wave 5 may continue lower towards the 3,960–3,970 target.
This is why Kelly would not treat the current support reaction as a reversal yet. Price still needs to reclaim resistance before the bullish view becomes stronger.
▸ Trading scenario
Preferred scenario: wait for price to reject from the 4,035–4,040 sell zone before expecting wave 5 continuation.
Sell zone: 4,035–4,040 if bearish confirmation appears
Stop loss: above 4,062 or above the confirmed rejection high
Take profit 1: 4,015
Take profit 2: 3,990
Take profit 3: 3,960–3,970
Alternative scenario: if gold breaks above 4,062 and holds with strong acceptance, the bearish wave 5 setup weakens. In that case, the market may shift back into a corrective recovery structure.
⌁ Kelly’s view
For Kelly, this is a bearish intraday setup. Gold is still trading below the sell zone, and the Elliott structure suggests one more downside leg may develop if sellers defend resistance.
The cleaner plan is to avoid chasing price at support and wait for a retest reaction around 4,035–4,040.
Gold is still under short-term pressure.
If the sell zone holds, wave 5 may continue towards the Fibonacci target below.
Share your view below. Long 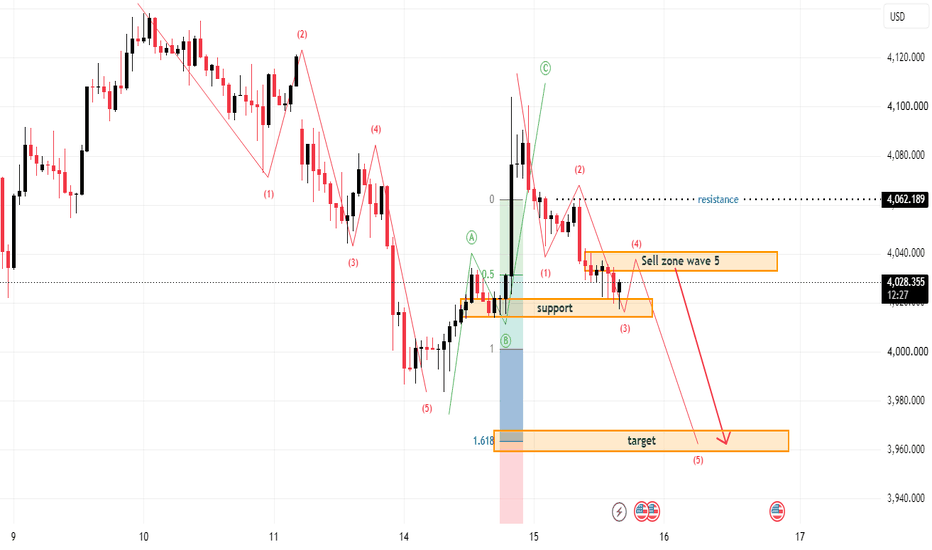
 Short
Short
XAU/USD (Gold) | 45-Minute TimeframeMarket Overview
Gold is currently trading around 4,025.78, showing a slight intraday decline of -0.16%. The broader market remains mixed, with short-term buying interest emerging after a recent bullish reversal while higher timeframes continue to maintain a bearish structure.
Multi-Timeframe Trend
Timeframe Bias Interpretation
5 Min 🟢 Bullish Short-term momentum favors buyers.
15 Min 🔴 Bearish Minor pullback within the intraday trend.
45 Min 🟢 Bullish Primary trading timeframe remains constructive.
4 Hour 🔴 Bearish Medium-term trend is still under selling pressure.
Daily 🔴 Bearish Long-term structure remains negative.
Technical Structure
1. Trend Analysis
The 45-minute chart shows a transition from a prolonged bearish trend into a developing recovery phase. Price has recently broken above the dynamic trend ribbon and is now consolidating just above support.
This suggests buyers are attempting to build momentum, although confirmation is still required.
2. Dynamic Support & Resistance
Immediate Resistance
4,041 – 4,045
Previous swing highs and projected upside objective.
Major Resistance
4,070 – 4,085
Strong supply zone where sellers may re-enter.
Immediate Support
4,021 – 4,024
Dynamic trend support.
Major Support
3,995 – 4,000
Psychological and structural support.
Momentum Assessment
Recent candles indicate:
Higher lows are forming.
Selling pressure is gradually weakening.
Price is consolidating instead of breaking lower.
Buyers remain active above the trend ribbon.
Momentum currently favors a continuation higher unless support is lost.
Trading Scenario
✅ Bullish Scenario (Higher Probability)
If price continues holding above 4,021, buyers could attempt another move toward:
Target 1: 4,041
Target 2: 4,055
Target 3: 4,075
A break above 4,041 with strong volume would strengthen the bullish outlook.
🔴 Bearish Scenario
If price breaks below 4,021, bullish momentum would weaken.
Possible downside objectives:
4,010
4,000
3,985
Failure to hold above the trend ribbon would likely shift control back to sellers.
Risk Assessment
Bullish Confirmation
Price holds above dynamic support.
Bullish candles close above recent consolidation.
Increasing buying momentum.
Bearish Confirmation
Breakdown below 4,021.
Lower highs begin forming.
Increased selling volume.
Professional Outlook
The current market structure suggests short-term bullish recovery within a broader bearish trend. Although the higher timeframes (4H and Daily) remain bearish, the 45-minute chart indicates that buyers have gained short-term control and may push price toward the 4,041 resistance area if support continues to hold.
Traders should monitor the 4,021–4,024 support zone closely. Holding above this level favors further upside, while a decisive break below it would increase the probability of renewed selling pressure.
Key Levels Summary
Current Price: 4,025.78
Immediate Support: 4,021–4,024
Major Support: 3,995–4,000
Immediate Resistance: 4,041–4,045
Major Resistance: 4,070–4,085
Short-Term Bias: Bullish
Medium/Long-Term Bias: Bearish
Overall Outlook: Cautiously Bullish while price remains above 4,021, with an upside objective near 4,041. Long 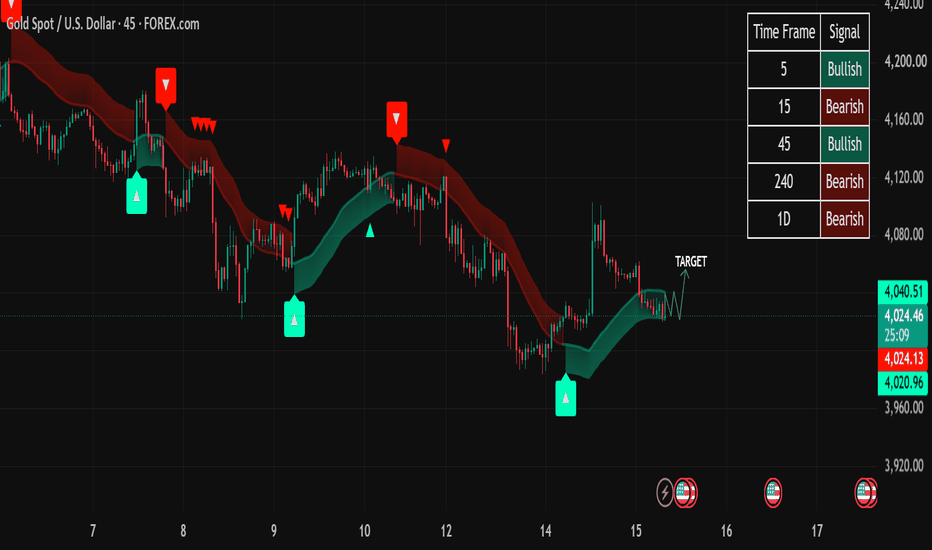
 Long
Long
 Long
Long
Flute RSI: A Potential Wave 2 Completion Signal Before Wave 3Introduction
One of the challenges of Elliott Wave analysis is identifying when a corrective Wave 2 has truly ended and when a new impulsive Wave 3 is about to begin.
Over the past several months, I have been studying a recurring relationship between price structure and RSI behavior that appears repeatedly before many significant bullish advances.
I call this pattern Flute RSI.
This article presents the concept, its market psychology, and several examples. The research is ongoing, and I welcome feedback from traders, technicians, and Elliott Wave practitioners.
The Core Observation
In many corrective structures:
Price continues making lower highs.
RSI also makes lower highs.
RSI breaks its downward trendline before price does.
RSI then pulls back and successfully retests the broken trendline.
Price subsequently completes its correction and begins a strong advance.
The key insight is that momentum appears to improve before price confirms the change.
Why " Flute RSI "?
The name comes from the appearance of the chart.
Price and RSI often form parallel downward trendlines during the correction, resembling the body of a flute.
When RSI breaks the trendline and later returns to test it, the move resembles a musician covering a flute hole before producing the next note.
After this "tap" occurs, the market frequently enters a powerful advance phase.
Pattern Definition
Stage 1 – The Correction
Price forms a series of lower highs.
RSI forms a matching series of lower highs.
Trendlines can be drawn on both price and RSI.
At this stage price and momentum are moving in harmony.
Stage 2 – The RSI Breakout
The first structural change appears in RSI.
Before price can break resistance, RSI breaks above its own descending trendline.
This suggests momentum is improving beneath the surface even though price has not yet confirmed.
Stage 3 – The Pullback
Price remains weak and may even fall further.
Many traders assume the bearish trend remains intact.
However, RSI holds above its broken trendline and begins forming support.
This is the critical phase of the setup.
Stage 4 – The Retest
RSI returns to the breakout area and successfully tests it as support.
What was previously resistance now becomes support.
This transition is what I consider the defining characteristic of the pattern.
Without a successful retest, I do not consider the setup complete.
Stage 5 – The Expansion
After RSI support is confirmed:
Price often forms its final corrective low.
Selling pressure diminishes.
A strong upward move begins.
Price eventually breaks its primary resistance trendline.
Many of the examples studied subsequently produced rapid advances.
Elliott Wave Connection
My working hypothesis is that Flute RSI frequently appears near the completion of a corrective Wave 2.
By the time price is still finishing its correction, RSI has already communicated a change in momentum structure.
When viewed through an Elliott Wave lens:
Wave 2 is completing.
Momentum begins improving.
Wave 3 emerges shortly afterward.
This remains a hypothesis and is one of the areas of ongoing research.
Market Psychology
The psychology behind the pattern may be straightforward.
During the correction:
Most traders focus on price.
Momentum starts improving first.
Early accumulation occurs.
RSI reflects the change before price does.
As price remains weak, many traders continue expecting downside.
Once the correction is complete, the market advances rapidly, leaving late sellers trapped.
Examples Studied
Some of the charts currently documented include:
Deepak Nitrate
TCI Express
Medicamen Biotech
Max Healthcare
Nifty Realty Index
docs.google.com
In each case, RSI demonstrated an earlier structural improvement than price.
Further testing across broader datasets is underway.
Limitations
This research is still in development.
The following work remains in progress:
Statistical win-rate analysis
Failure-case documentation
Risk/reward evaluation
Objective screening criteria
Cross-market validation
Multi-timeframe testing
At this stage, Flute RSI should be considered a research observation rather than a validated trading system.
Questions for the Community
I would appreciate feedback from traders and analysts:
Have you observed a similar RSI behavior before major advances?
Have you found examples where the pattern failed?
Does the setup appear on markets outside equities?
Have you observed a similar relationship with other momentum indicators?
Constructive criticism and counterexamples are especially welcome.
Conclusion
The Flute RSI concept is built on one simple idea:
Momentum may reveal a change in market structure before price confirms it.
Whether this observation ultimately proves statistically robust remains to be determined. However, the pattern has appeared often enough in my research to warrant further investigation.
I look forward to refining the concept with feedback from the TradingView community.
Author's Note: This is ongoing independent research and not investment advice. Future work includes large-scale testing, win-rate calculation, and identification of failure scenarios. Short 
Weaker USD and gold impact market trends.Despite softer-than-expected U.S. inflation data, Gold failed to attract sustained buying interest. The decline in CPI briefly pressured the U.S. Dollar, but the broader market reaction suggests investors remain cautious rather than aggressively shifting into safe-haven assets. Treasury yields have not declined enough to trigger a meaningful reallocation of capital toward Gold, while expectations surrounding future Federal Reserve policy remain largely unchanged. Today's PPI release and comments from Fed officials could provide additional direction, but for now, institutional flows continue to favor confirmation over anticipation.
From a technical perspective, Gold remains confined beneath a well-defined descending trendline on the H4 timeframe. Yesterday's recovery failed to produce a decisive breakout, highlighting that sellers continue to defend the upper resistance zone around 407x, where the descending trendline converges with Fibonacci retracement and previous demand turned resistance. While the Dollar has softened, Gold has not responded with the strength typically associated with a bullish reversal, suggesting buying momentum remains limited.
As long as price continues trading below this confluence resistance, the broader bearish structure remains intact. A recovery toward 406x–407x could provide another opportunity for sellers if bearish rejection develops. On the downside, the 396x support area remains the next major liquidity target should downside momentum resume.
PRIMARY SCENARIO
Gold may extend its recovery toward 406x–407x.
Bearish rejection from the descending trendline could reinforce selling pressure.
A move back toward 396x remains the preferred scenario while resistance holds.
ALTERNATIVE SCENARIO
A decisive H4 close above the descending trendline and the 407x resistance zone could invalidate the current bearish bias and open the door for a broader recovery toward the next resistance area.
MARKET VIEW
Current Bias: Bearish
Preferred Strategy: Sell the Rally
Key Resistance: 406x–407x
Key Support: 396x Short 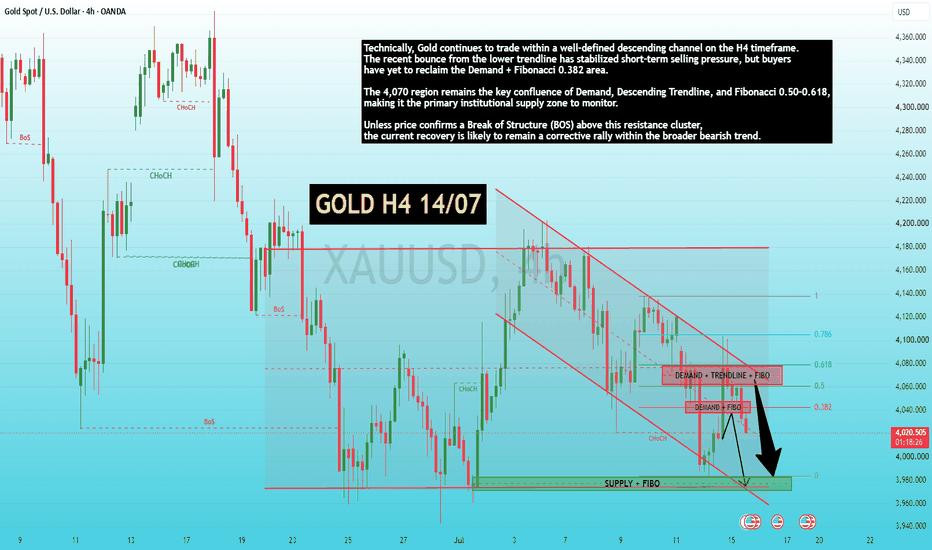
Aegis Logistics Weekly BreakoutSubject: Aegis Logistics Weekly Breakout 🚀 | Entering a New Bullish Zone
Chart View: Weekly (NSE: AEGISLOG)
Aegis Logistics has delivered a strong breakout above the key resistance zone around ₹1,040–₹1,050 after a long consolidation phase. The stock has shown aggressive bullish momentum with a strong price expansion, indicating fresh buying interest.
📈 Trade Setup (Swing / Positional)
Entry Zone: ₹1,050–₹1,080 (or on a retest near ₹1,040)
Target 1: ₹1,200
Target 2: ₹1,350
Target 3: ₹1,500 (major breakout projection)
Stop Loss: ₹980 (Weekly closing basis)
My View:
In my analysis, AEGISLOG has entered a fresh bullish phase after a clean breakout from a long consolidation range. The recent rally has been sharp, so short-term consolidation is possible. I remain positive as long as the stock holds above the ₹1,040 breakout level.  Long
Long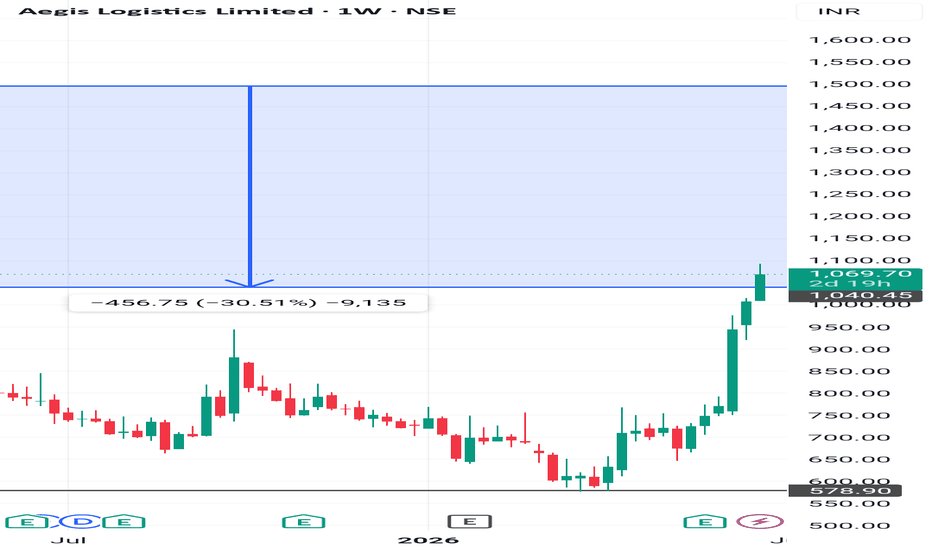
 Long
Long
 Long
Long
 Long
Long
 Long
Long
Gujarat Fluorochemicals Ltd. (NSE: FLUOROCHEM)🏆 Stock Setup of the Day | Gujarat Fluorochemicals Ltd. (NSE: FLUOROCHEM)
📈 Timeframe: Weekly Chart
🚀 Fresh Breakout Into a Major Resistance Zone
Gujarat Fluorochemicals has staged an impressive recovery from the February 2026 lows and has now broken above a key resistance level around ₹4,000, indicating renewed bullish momentum.
🔹 Current Price: ₹4,082
🔹 Breakout Level: ₹4,000
🔹 Major Target Zone: ₹5,250
🔹 Potential Upside: ~22%
📊 Technical View
✅ Strong weekly breakout with bullish price structure
✅ Higher Highs & Higher Lows confirm an uptrend
✅ Price has reclaimed an important resistance after a prolonged consolidation
✅ Momentum remains positive while price sustains above the breakout zone
👀 Key Levels to Watch
🟢 Support: ₹4,000–₹3,950
🎯 Target Zone: ₹5,200–₹5,250
📌 A sustained move above ₹4,000 could keep the medium-term trend firmly bullish. Watching for follow-through buying in the coming weeks.
⚠️ Disclaimer: This is purely a technical chart analysis for educational purposes and should not be considered as investment or trading advice. Please do your own research and follow proper risk management.
🔥 Follow the channel for daily high-probability breakout setups and technical analysis.  Long
Long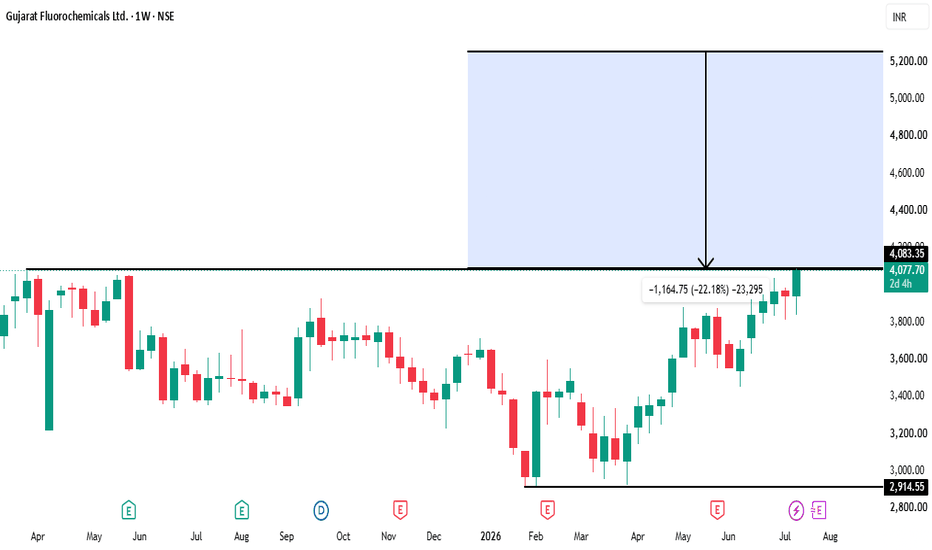
 Long
Long