NIFTY 50 ANALYSIS |23 July 2026 |Daily → 4H → 1H → 15M → 5M TF# 📊 NIFTY 50 ANALYSIS | 23 July 2026 | Daily → 4H → 1H → 15M → 5M
**Previous Close:** **23,996.25**
**Change:** **-191.45 (-0.79%)**
> *Markets continue their favorite hobby: convincing both bulls and bears that they're geniuses, then billing both for the lesson by the closing bell.*
---
# 📌 PREVIOUS SESSION OHLC
| Level | Price |
| ----- | ------------: |
| Open | **24,150.45** |
| High | **24,166.30** |
| Low | **23,961.40** |
| Close | **23,996.25** |
---
# 📈 DAILY CHART ANALYSIS
### Trend
The primary daily trend has weakened after NIFTY decisively slipped below the **24,180-24,200 acceptance zone**. The session closed below the important psychological **24,000** level, keeping short-term momentum negative.
### Market Structure
* Lower Highs continue.
* Fresh Lower Low formed.
* Bears remain in control unless price reclaims the value area.
### Volume
Selling volume expanded during the breakdown below 24,000, indicating institutional distribution rather than simple profit booking.
### RSI
15-minute RSI has recovered from oversold territory to around **47**, suggesting only a relief bounce rather than a confirmed reversal.
### Volume Profile
Your chart clearly shows:
**Point of Control (POC): 24,189**
This remains the strongest institutional value area.
Until price trades above this level, rallies are likely to face selling pressure.
---
# 📊 DAILY FIBONACCI VIEW
Current price action is trading below the key retracement zone.
Institutionally:
* Below 50% retracement = bearish bias.
* Sustained trade below 61.8% generally favors continuation selling.
* Bulls need acceptance above value before expecting trend reversal.
---
# 🏦 MARKET BIAS
### ✅ Bullish Above
**24,189 (Volume Profile POC)**
---
### ⚖️ Range Bound
**23,961.40 - 24,189**
---
### 🔴 Bearish Below
**23,961.40**
---
# 🏛️ INSTITUTIONAL VIEW
### Market Regime
Bearish
### Institutional Control
Currently with sellers.
### Immediate Resistance
* **24,189 (POC)**
* **24,200 Value Area**
### Immediate Support
* **23,961.40 (Previous Day Low)**
---
# 📊 OPTION CHAIN ANALYSIS (28 July Expiry)
Using the uploaded option chain:
### ATM
**24,000**
### Maximum Call OI
**24,200 CE : 239,351 contracts**
Very strong resistance.
---
### Second Highest Call OI
**24,000 CE : 213,561**
---
### Maximum Put OI
**24,000 PE : 199,048 contracts**
Strong immediate support.
---
### Fresh Call Writing
Largest additions seen at:
* **24,000 CE (+141,016)**
* **24,100 CE (+88,184)**
* **24,200 CE (+65,637)**
This confirms aggressive resistance building above spot.
---
### Fresh Put Writing
Largest additions:
* **24,000 PE (+81,922)**
* **23,950 PE (+43,094)**
* **23,800 PE (+20,348)**
Writers are attempting to defend the 24,000 region, although price has already slipped below it.
### Put Unwinding
Visible at:
* **24,150 PE (-5,704)**
* **24,200 PE (-21,769)**
* **24,250 PE (-3,222)**
* **24,300 PE (-3,782)**
Put unwinding above current price suggests diminishing confidence in higher support levels.
### Institutional Interpretation
The option chain reflects a **bearish-to-neutral** structure. Heavy call writing between **24,000 and 24,200** creates a supply zone, while **24,000 PE** remains the strongest defensive support. A sustained move below **23,961.40** could force further put writers to unwind.
---
# 📊 VOLUME PROFILE ANALYSIS
### Point of Control
**24,189**
### High Volume Node (HVN)
**24,170-24,200**
### Low Volume Node (LVN)
Below **24,000**
### Acceptance Zone
**24,170-24,200**
### Rejection Zone
Current trading around **23,996**
### Interpretation
Price trading well below POC indicates institutions are accepting lower prices. Until the market regains **24,189**, rallies are more likely to encounter selling interest than sustained buying.
---
# 🟢 HIGH PROBABILITY CE TRADE
### Setup
Buy only after **24,189** is reclaimed and sustained.
### Confirmation
* Strong candle close above POC
* Rising volume
* RSI crosses above 50
### Stop Loss
**Below 24,150.45**
### Targets
* **24,200**
* **24,300**
### Probability
**40%**
Counter-trend trade.
---
# 🔴 HIGH PROBABILITY PE TRADE
### Setup
Sell below
**23,961.40**
### Confirmation
* Breakdown with volume
* Failure to reclaim 24,000
### Stop Loss
Above **24,000**
### Targets
As visible from the chart:
* Initial target: continuation below the previous day's low.
* If momentum accelerates, the next downside objective is the next visible swing support below the current structure.
### Probability
**60-65%**
Trend-following setup.
---
# 📈 MULTI-TIMEFRAME ANALYSIS
### Daily
**Trend:** Bearish
Support: **23,961.40**
Resistance: **24,189**
Institutional View:
Sellers retain control below value.
---
### 4H
Trend:
Bearish
Support:
23,961.40
Resistance:
24,189
Institutional View:
Lower highs continue.
---
### 1H
Trend
Bearish
Support
23,961.40
Resistance
24,189
Institutional View
Weak recovery attempts.
---
### 15M
Trend
Bearish with short-covering bounce.
Support
23,961.40
Resistance
24,189
---
### 5M
Trend
Sideways to mildly bullish intraday.
Institutional View
Relief bounce only unless value area is reclaimed.
---
# 🎯 TRADING SCENARIOS
## Scenario 1: Bullish Continuation
**Probability:** 35%
Trigger:
Acceptance above **24,189**
Targets:
* **24,200**
* **24,300**
---
## Scenario 2: Range Market
**Probability:** 30%
Range:
**23,961.40 - 24,189**
Expect two-sided movement while institutions determine direction.
---
## Scenario 3: Bearish Breakdown
**Probability:** 35%
Trigger:
Break below **23,961.40**
Targets:
Continuation toward the next visible support zone below the previous day's low.
---
# ⚠️ INVALIDATION LEVELS
### Bullish View Invalid
Below **23,961.40**
### Bearish View Invalid
Above **24,189**
---
# 💡 KEY TRADER NOTES
* **24,189** remains the most important institutional level (POC).
* Heavy call writing at **24,200 CE** reinforces resistance.
* **24,000 PE** is the strongest support according to the current option chain.
* As long as NIFTY trades below the POC, institutions are likely to sell into rallies rather than chase higher prices.
* Avoid anticipating reversals without confirmation. Markets have a remarkable talent for punishing certainty, which is one of the few industries where efficiency never seems to decline.
**#NIFTY50 #NiftyAnalysis #StockMarket #TechnicalAnalysis #PriceAction #VolumeProfile #OptionChain #SmartMoney #InstitutionalTrading #TradingView #IndianStockMarket #FuturesAndOptions #SwingTrading #IntradayTrading #MarketAnalysis**
XAUUSD – Breakout Retest in FocusGold has extended its bullish momentum after breaking above the previous resistance zone around 4,082, confirming a stronger short-term market structure on the 1-hour timeframe.
Price is now approaching the 4,142 resistance level, where buyers may face fresh selling pressure. If price is rejected from this area, a pullback toward the 4,082 zone could develop. Since this level previously acted as resistance, market participants may watch whether it now provides support during any retracement.
A sustained move above 4,142 would indicate continued bullish strength and could open the way for further upside. On the other hand, a failure to hold above 4,082 may weaken the current momentum and increase the likelihood of a deeper correction.
Key Levels
🔴 Resistance: 4,142
🟢 Potential Support: 4,082
This analysis is based on price action and technical structure only. It is shared for educational purposes and does not constitute financial advice.  Long
Long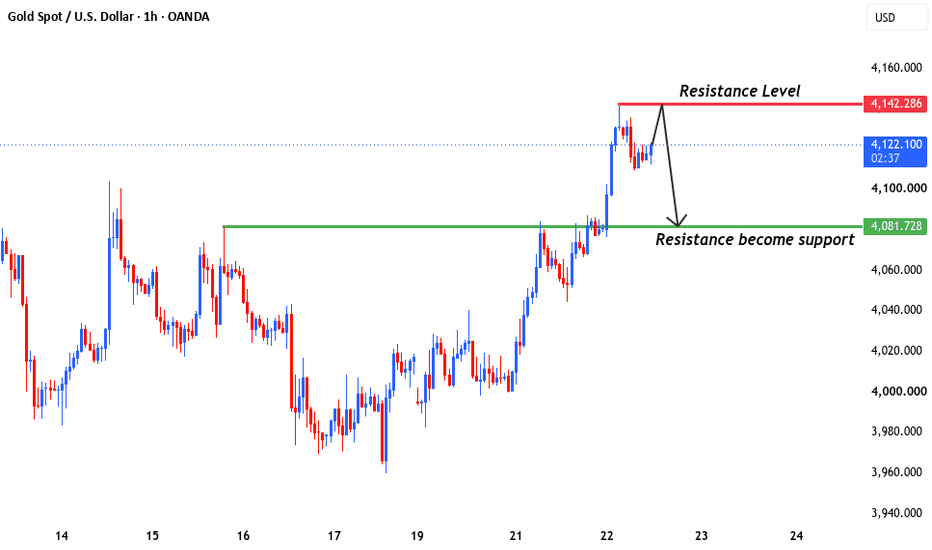
Bitcoin AnalysisIf the price breaks below 58,000–57,700, it could trigger a significant bearish move toward the 50,000–40,000 zone.
A decisive breakdown below 40,000 may open the path to the 20,000–15,000 range.
Until those key support levels are breached, the overall trend remains strong, with the potential to advance toward the 65,000–75,000 target in the near future.  Short
Short
BTCUSD Retesting Breakout Zone | High-Probability Buy SetupBTCUSD has successfully broken above the 65,600 resistance level after an extended period of consolidation, signaling renewed bullish momentum. Following the breakout, price is now pulling back to retest the breakout zone, which could act as fresh support.
This retest presents a potential buying opportunity if buyers defend the 65,600–65,400 support area.
📈 Trade Setup
Entry Zone: 65,600 – 65,400
Bias: Bullish
Take Profit 1: 66,600
Take Profit 2: 67,000
Final Target: 67,300
Why This Setup?
✅ Clean breakout above a major resistance level.
✅ Healthy pullback to retest previous resistance as new support.
✅ Bullish market structure remains intact.
✅ Favorable risk-to-reward if the support zone holds.
What to Watch
Wait for bullish confirmation inside the support zone, such as a strong bullish candle, increased buying volume, or a break in lower-timeframe bearish structure before entering.
A successful defense of this level could fuel the next leg higher toward 66.6K, 67K, and potentially 67.3K.
Trade smart, manage your risk, and never risk more than you can afford to lose.
💬 Do you think BTC will hold the breakout retest, or is a deeper pullback still ahead? Share your analysis below!
📌 Disclaimer:
This analysis is for educational purposes only and is not financial advice. Always manage risk and follow your trading plan.
Your feedback drives our content and keeps everyone trading smarter. Let’s make those pips together! 🚀
Happy Trading,
– The InvestPro Team Long 
XAUUSD — 4,140 May Be the Trap XAUUSD — 4,140 May Be the Trap
Gold made a strong push into the 4,140 area, and at first glance it looks like buyers finally found their rhythm again. But when I slow the chart down, this move feels more like price climbing into a liquidity pocket than starting a clean bullish trend.
The rally from the order block around 4,000 was sharp, and it did create a clear BOS as price pushed higher. That tells us buyers had short-term control. But now gold is sitting near the upper side of the recent move, right after taking liquidity above the previous structure, and this is where I would be careful with chasing longs too late.
For newer traders, this is the part that matters most: a strong candle into resistance does not always mean continuation. Sometimes price runs higher to collect buy-side liquidity, pulls late buyers in, then starts breathing back into the zone where the move began.
That is why my main view is bearish for a corrective pullback while gold stays below the 4,130 - 4,140 area. The diplomatic tone around US-Iran talks may have helped gold recover, but technically the chart is already showing price reacting after that liquidity push. If sellers keep defending this upper area, the first zone I expect price to revisit is 4,068.875. That level sits near the recent balance area, so a reaction there would make sense.
If 4,068.875 fails to hold, the bigger magnet becomes the order block around 4,003.038. That is where the previous bullish impulse started, so price may want to come back and test whether real demand is still there.
This bearish pullback idea becomes weak only if gold reclaims 4,140 cleanly and holds above it. If that happens, buyers may continue toward the higher liquidity area instead of correcting lower.
Key price zones to watch
Current reaction area: 4,120 - 4,130
Main supply / liquidity trap zone: 4,130 - 4,140
Bearish confirmation zone: clean break below 4,068.875
First downside target: 4,068.875
Main downside order block target: 4,003.038
Lower support if selling continues: 3,980 - 3,990
Upper resistance if sellers fail: 4,140
Invalidation: clean reclaim and hold above 4,140
Do you see this 4,140 move as real bullish strength, or just a liquidity grab before gold comes back to test the order block? Short 
BANDHANBNK: 17% Guidance Crash Meets Multi-Yr Value Demand ZoneOverview : BANDHANBNK (Bandhan Bank Ltd.) is experiencing extreme downside volatility following a massive single-day sell-off of ~17% down to the ₹173.29 zone. A recent guidance cut regarding Return on Assets (RoA) triggered aggressive institutional repricing. While short-term technical indicators reflect severe selling pressure, the steep valuation discount and proximity to multi-year volume profile support render this an intriguing deep-value candidate for a 1-to-3-year investment window.
Technical Analysis and Trend Direction :
Trend Alignment : The technical structure is overwhelmingly bearish across all primary timeframes (4-hour, daily, and weekly) . The stock is trading well below its Moving Average Ribbon (20/50/100/200 EMAs spanning ₹180.79 to ₹204.95).
Momentum Oscillators : The daily RSI has dropped into oversold territory at 30.56 , with the 4-hour RSI deeply oversold at 20.70. While this suggests a potential short-term relief bounce, the broader path of least resistance remains down until structural acceptance is re-established above broken support.
Volume Profile Structure : Price action is currently sitting inside the Value Area (VAL ₹141.46 to VAH ₹199.13), with the high-volume Point of Control (POC) lingering below at ₹150.47 , acting as a strong structural volume magnet.
Key Levels to Watch :
Immediate Resistance Levels : Watch ₹175.95 (swing high) and ₹186.55 (broken support turned resistance).
Macro Resistance Levels : Watch ₹199.13 (Value Area High) and ₹204.95 (top of the MA Ribbon).
Immediate Support Levels : Watch ₹168.88 (broken swing high support) and ₹162.25.
Macro Demand Zone (1–3 Year Accumulation) : Watch ₹150.47 (Volume Profile POC) down to ₹141.46 (Value Area Low) and the 52-week low at ₹134.25.
Fundamental Analysis and Financial History :
Growth and Margins : TTM Revenue stands at ₹244.6B (-2.2% YoY) with Net Income at ₹13.5B (-34.1% YoY). Net profit margin sits at 9.9% compared to the sector median of 21.8%.
Balance Sheet Deleveraging : Despite the growth slowdown, total debt was reduced aggressively by 62.5% in FY2025, bringing the Debt-to-Equity ratio down to a healthy 0.51x.
Annual Performance Trajectory : After expanding revenue by +18.6% in FY2024, top-line growth decelerated to -0.8% in FY2025. Net income contracted by 55.4% in FY2025 following a +23.1% rebound in FY2024.
Valuation Multiples : BANDHANBNK is heavily discounted, trading at a P/E of 20.6x and a P/S of 2.5x, representing a ~31% valuation discount relative to broader private sector banking peers.
Sector Comparison with Peer Stocks :
HDFCBANK : Current Price ₹753.00 (-1.11% 1D), Market Cap ₹11.73T, P/E 14.71x, YoY Revenue Growth +1.8%, Analyst Rating Strong Buy.
ICICIBANK : Current Price ₹1,441.80 (-1.46% 1D), Market Cap ₹10.50T, P/E 18.64x, YoY Revenue Growth +5.1%, Analyst Rating Strong Buy.
AXISBANK : Current Price ₹1,237.40 (-1.65% 1D), Market Cap ₹3.91T, P/E 13.91x, YoY Revenue Growth +4.1%, Analyst Rating Strong Buy.
KOTAKBANK : Current Price ₹380.60 (-1.39% 1D), Market Cap ₹3.84T, P/E 18.65x, YoY Revenue Growth +5.9%, Analyst Rating Strong Buy.
Peer Takeaway : While larger peers like ICICIBANK and KOTAKBANK exhibit stronger top-line growth and positive weekly momentum, BANDHANBNK offers the steepest valuation discount and turnaround potential once credit costs normalize.
Directional Bias and 1-to-3 Year Holding Strategy: Bearish near-term, but cautiously bullish on a 1-to-3-year horizon.
Short-Term Strategy : Chasing shorts at oversold levels carries short-squeeze risk. Wait for a retest of broken resistance near ₹175.95 to ₹186.55 to manage risk.
Long-Term Strategy : Catching falling knives during a guidance cut is risky. The optimal long-term strategy is phased accumulation near the major volume profile demand zone between ₹141.46 and ₹150.47 (POC/VAL). A sustained weekly close back above ₹186.55 will confirm structural trend stabilization.
Disclaimer:
This analysis is for educational purposes only and does not constitute financial advice. Always perform your own research and manage your risk/position sizing accordingly.  Long
Long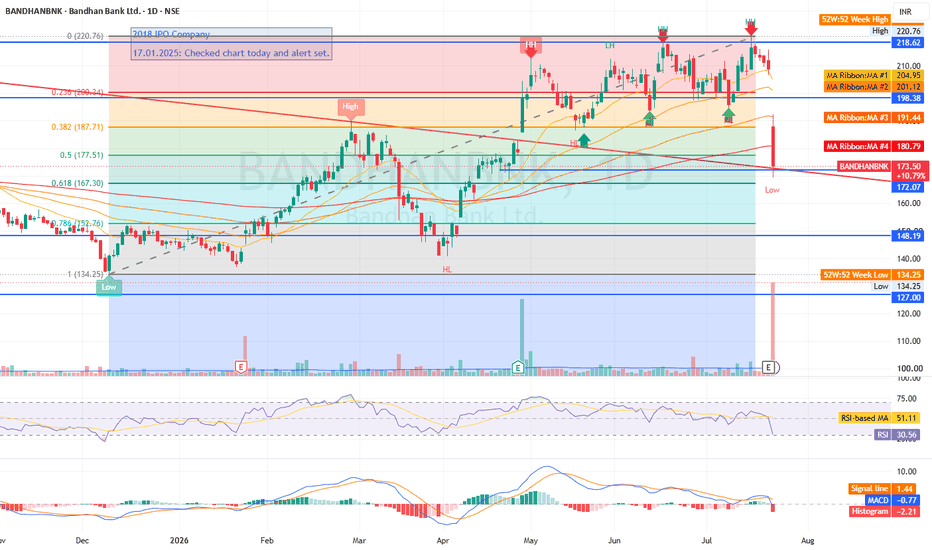
XAU/USD Holding Strong – Demand Zone Signals the Next Bullish 📊 Technical Analysis
The overall market structure remains bullish, with price consistently forming higher highs and higher lows after rebounding from the strong support zone. Each previous breakout was followed by a healthy retracement, allowing buyers to re-enter the market before continuing the upward trend.
The highlighted Demand Zone has once again proven its importance. After breaking above this area, Gold pulled back to retest it, where buyers stepped in aggressively. This successful retest strengthens the probability that the demand zone will continue acting as a launching pad for the next bullish wave.
The repeated Pivot Points shown on the chart indicate that every major correction has been followed by renewed buying pressure, suggesting that institutional participants continue to accumulate positions during pullbacks.
🔥 Bullish Signals
✅ Price is holding firmly above the key demand zone.
✅ Previous resistance has successfully flipped into support.
✅ Higher highs and higher lows confirm a healthy bullish trend.
✅ Strong buying reaction from every marked pivot point.
✅ Market structure favors trend continuation rather than reversal.
🎯 Potential Price Scenario
If Gold continues to hold above the highlighted demand zone, buyers are likely to regain momentum and push price toward the first target, followed by the second upside target marked on the chart. A clean breakout above the recent swing high would further confirm bullish continuation and could attract additional buying interest.
However, a decisive close below the demand zone would weaken the bullish outlook and may lead to a deeper correction before the next directional move.
⚠️ Risk Management
Even in a strong uptrend, disciplined trading is essential.
Wait for bullish confirmation before entering.
Place stop-loss orders below the demand zone or recent swing low.
Avoid chasing extended candles after sharp rallies.
Manage position size according to your trading plan.
💡 Conclusion
Gold is showing a textbook bullish structure, with buyers successfully defending a crucial demand zone after multiple breakout confirmations. As long as this support remains intact, the path of least resistance appears to be higher. A breakout above the recent high could pave the way for a fresh bullish leg toward the projected targets. Long 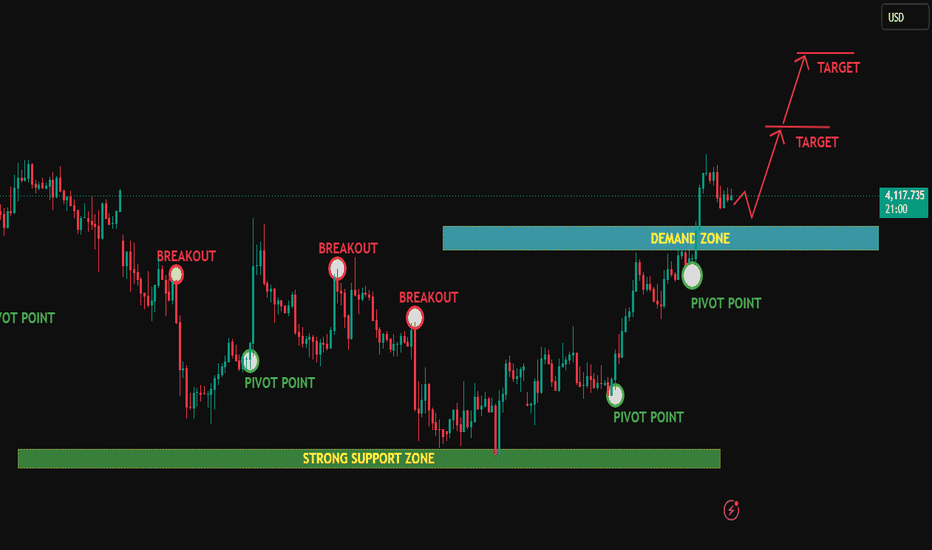
HDFC Bank Trades Near Lifetime HighsHighlights
* HDFC Bank continues to exhibit a strong technical structure, with the stock sustaining above all major moving averages following a steady post-merger recovery. The recent price action suggests sustained institutional accumulation and improving market confidence.
* The stock is currently trading near the **₹2,080–₹2,100** resistance zone. A decisive close above this range could confirm a fresh breakout and open the door for an advance towards **₹2,180–₹2,250** in the near term.
* On the downside, **₹2,000–₹2,020** serves as immediate support, while the **₹1,930–₹1,950** zone remains a strong medium-term demand area. Holding above these levels would keep the bullish outlook intact.
* Momentum indicators such as RSI and MACD remain firmly positive, while trading volumes have improved over the past few sessions, indicating continued participation from institutional investors.
* The stock has formed a higher-high and higher-low pattern on the daily chart and is consolidating just below its lifetime highs, suggesting that buyers remain in control despite intermittent profit booking.
* Improving deposit growth, stable asset quality, easing concerns around the merger integration, and expectations of stronger credit growth continue to provide a favorable fundamental backdrop for HDFC Bank's medium-term prospects.
Takeaway
HDFC Bank is displaying one of the strongest technical setups among large-cap private sector banks. A sustained move above **₹2,100** could accelerate buying momentum and push the stock towards the **₹2,180–₹2,250** zone. As long as HDFC Bank holds above the **₹2,000–₹2,020** support range, the technical bias remains firmly positive, making short-term pullbacks potential buying opportunities rather than indications of a trend reversal.
 Long
Long
Long 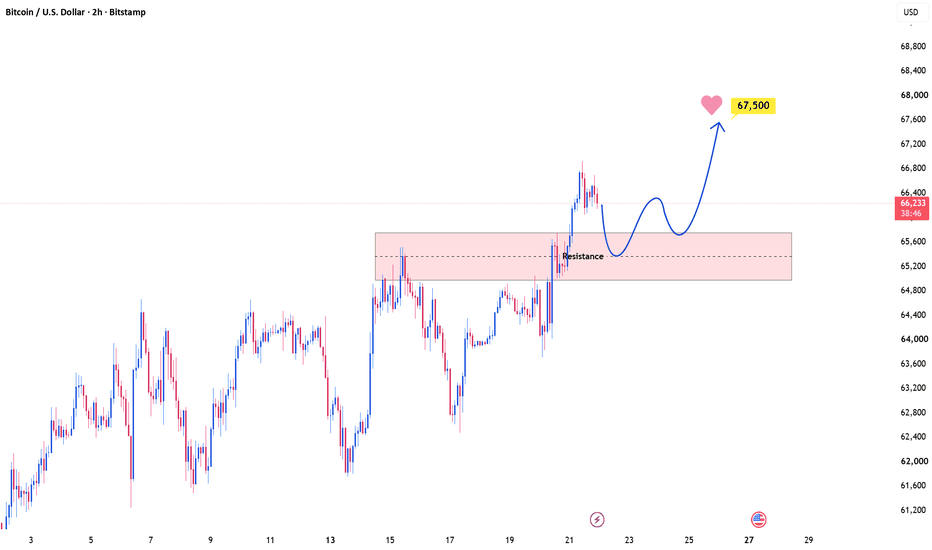
Gold - Technical And Quantitative Analysis CollaborationUpon zooming in on gold's chart on a 3-month timeframe, I made some very interesting observations........
Since 1970 - till 2026, I have identified 3 major bull runs in gold
- And every bull run has followed a rhythm.
- Each bull run lasts roughly 10 years.
- Each cycle inside the bull run expands close to +169%.
- And these inside cycles are compressing every decade
• The 1st bull run completed 3 full cycles.
• The 2nd bull run completed 2 cycles.
• The 3rd bull run (if it has topped) barely stretched to around 1.5 cycles.
• 3 → 2 → 1.5
Now the crucial point is that
- Each time a corrective trend is observed after the completion of every 10-year bull period
And the most interesting discovery of the analysis is that - the current bull cycle ends in Feb 2026
Logically speaking, if momentum compresses with every expansion, the exhaustion phase should arrive sooner.
Now technically, prices have breached the ascending wedge, made highs above 5200, testing resistance at fib ext 2.168 (5184), but still have not re-tested the wedge to confirm the pattern breakout.
Hence, to play out the pattern, gold could decline toward a major confluence zone:
• Convergence of the red trendlines of the ascending wedge
• Fibonacci 1.618 projection
• Major structural support
That zone sits near 3600.
If gold corrects toward that level, I believe it won’t be the end.
It could simply be the reset to begin the next 10-year spell. Short 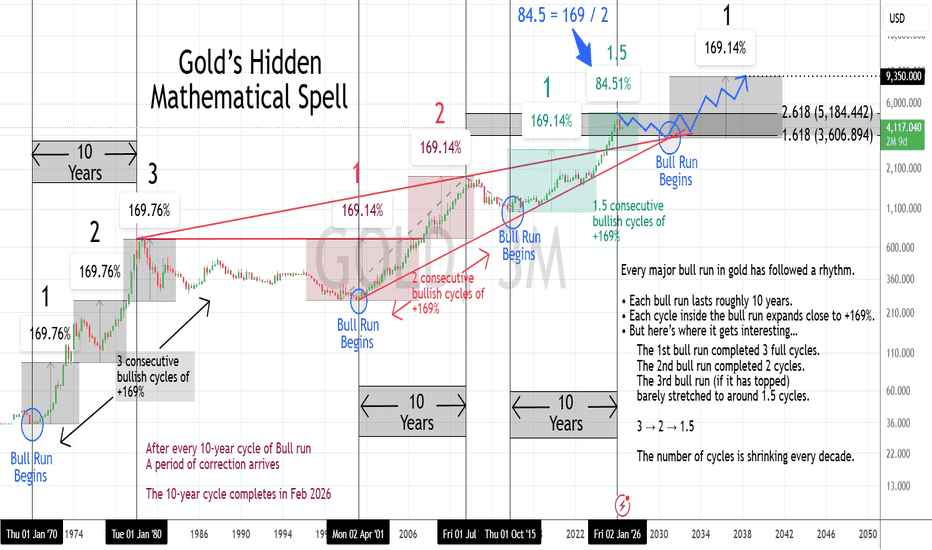
XAUUSD — Buy the Breakout RetestFundamental Analysis
Gold climbed to a two-week high as technical buying and renewed tensions in the Middle East boosted demand for safe-haven assets. However, the US Dollar remains close to a one-week high, while US Treasury yields continue to stay firm, which may restrict further upside ahead of the Federal Reserve's policy meeting on 28–29 July.
Technical Analysis
On the 1H chart, XAUUSD is trading around 4,124 after breaking above the descending channel and extending its rally towards the previous 4,130–4,140 swing high. The preferred buying area is 4,082–4,097, where the breakout structure aligns with the 0.382–0.5 Fibonacci retracement levels.
If the price retests this zone and holds with bullish confirmation, gold could reclaim 4,140 before extending towards the 4,175–4,180 target area.
Important Price Levels
Current Price: 4,124.13
Primary Buy Zone: 4,082–4,097
Short-term Support: 4,038–4,045
Short-term Resistance: 4,130–4,140
Liquidity Zone: 4,130–4,140
Primary Target: 4,175–4,180
Invalidation Level: Below 4,038
Trading Plan
Main Buy Setup
Entry: 4,082–4,097
Stop Loss: 4,038
Take Profit 1: 4,130
Take Profit 2: 4,140
Take Profit 3: 4,175–4,180
Buy Confirmation
Wait for a controlled pullback into the primary buy zone. A long lower wick, a bullish engulfing candle, a failed breakdown, or a 1H candle closing back above 4,097 may confirm renewed buying interest.
If the price breaks below 4,038 and sustains beneath that level, the bullish setup will no longer remain valid.
Overall Outlook
The 1H market structure remains bullish following the breakout above the descending channel. However, chasing the price near 4,130 may not offer an attractive risk-to-reward ratio. The preferred approach is to wait for confirmation around 4,082–4,097, with the expectation of a breakout above 4,140 and further upside towards 4,175–4,180.
What do you think? Will gold retest the primary buy zone first, or break straight above 4,140 and continue higher? Long 
# **XAU/USD (Gold) Technical Analysis ### **Market Structure**
Gold remains in a **strong bullish trend**, forming a sequence of **higher highs and higher lows** after reversing from the recent swing low. Buyers have regained control, and momentum is clearly favoring the upside.
The recent impulsive rally successfully **broke above a key resistance zone**, confirming a bullish market structure shift. Price is now consolidating after the breakout, which is a healthy sign before a potential continuation.
---
## **Key Technical Levels**
### 🟣 Support / Demand Zone
**4,076 – 4,084**
* Previous resistance has turned into support.
* This area is the highest-probability buying zone.
* A successful retest with bullish confirmation could trigger the next leg higher.
### 🔴 Immediate Resistance
**4,125 – 4,135**
* This is the recent swing high where sellers previously entered.
* A decisive break above this level would confirm continuation of the uptrend.
---
## **Trade Setup**
### ✅ Preferred Entry
* Wait for price to retrace into the **4,076–4,084 demand zone**.
* Enter only after a bullish rejection candle (Bullish Engulfing, Pin Bar, or Strong Momentum Candle).
### 🛑 Stop Loss
* Below **4,070** or beneath the recent swing low.
### 🎯 Take Profit Targets
* **TP1:** 4,120
* **TP2:** 4,135
* **TP3:** 4,150–4,170 (if bullish momentum remains strong)
---
## **Technical Confluence**
* ✔ Bullish market structure (Higher Highs & Higher Lows)
* ✔ Breakout above resistance
* ✔ Resistance turned into support
* ✔ Strong bullish momentum
* ✔ Healthy pullback expected before continuation
These confluences increase the probability of a successful **buy-on-retest** setup rather than chasing price at current levels.
---
## **Risk Management**
* Never buy after an extended rally without confirmation.
* Risk **1–2%** of account equity per trade.
* Wait for price action confirmation inside the demand zone.
* Maintain a minimum **Risk-to-Reward ratio of 1:2 or better**.
---
# **Professional Outlook**
The overall bias remains **bullish** as long as Gold holds above the **4,076–4,084 support zone**. A controlled pullback into this area is likely to attract fresh buyers and provide a higher-probability long opportunity. If buyers defend support and price breaks above **4,135**, the next bullish expansion toward **4,150–4,170** becomes increasingly likely.
**Bias:** 🟢 **Bullish**
**Strategy:** **Buy the Retest, Not the Breakout**
**Market Sentiment:** Buyers remain in control until the support zone is decisively broken.
Long 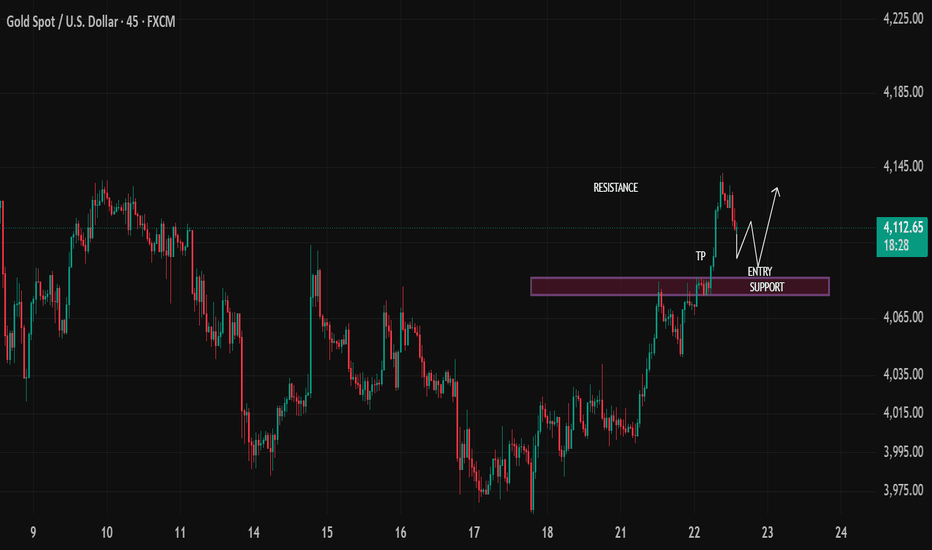
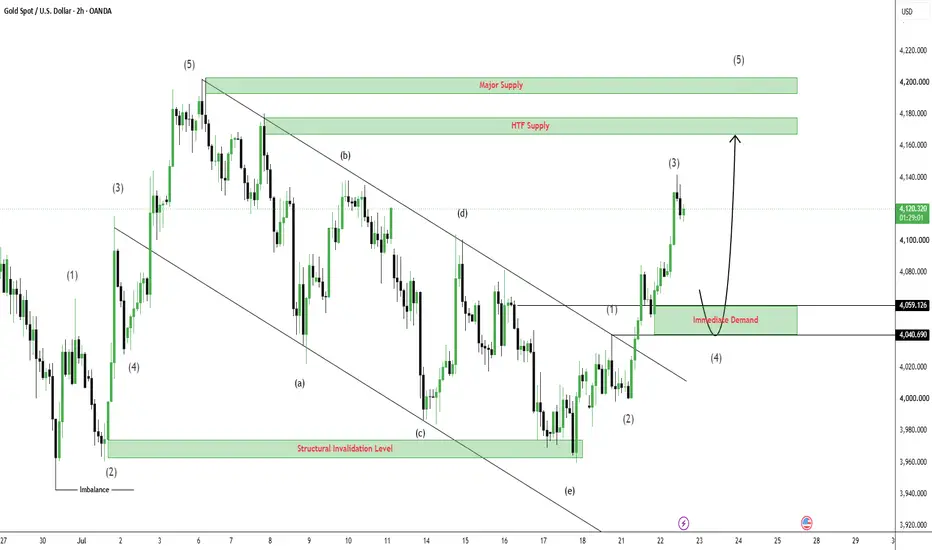
XAUUSD — Demand Retest Buy SetupGold is trading around $4,119 after breaking above the descending trendline and expanding strongly from the structural low near $3,960. The impulsive move confirms that buyers are controlling the short-term structure.
Price is currently extended after reaching the projected wave (3) area. The preferred opportunity is a controlled pullback into the Immediate Demand zone at $4,040.690–$4,059.126 before the next potential bullish expansion.
SMC View
The trendline breakout and strong displacement indicate a clear structural shift from correction into bullish continuation. The Immediate Demand zone represents the origin of the latest impulsive move and remains the main decision area for buyers.
Entering near the current price would mean chasing an extended move. A retracement into demand, followed by bullish rejection and a lower-timeframe MSS or CHOCH, would provide stronger confirmation that buyers remain in control.
Main Trading Scenario
Condition:
Gold pulls back into the $4,040.690–$4,059.126 Immediate Demand zone and forms a clear bullish rejection. A lower-timeframe bullish MSS or CHOCH is required before entry.
Entry: $4,040.690–$4,059.126 after bullish confirmation
SL: Below $4,040.690 and the reaction low
TP1: $4,130–$4,135
TP2: $4,168–$4,177
TP3: $4,193–$4,202
Key Zones to Watch
Current price: $4,119
Immediate Demand: $4,040.690–$4,059.126
HTF Supply: $4,168–$4,177
Major Supply: $4,193–$4,202
Invalidation: Acceptance below $4,040.690
Confirmation: Bullish rejection with MSS or CHOCH
Prime Gold View
The buy bias remains valid while Gold protects the $4,040.690–$4,059.126 Immediate Demand zone. The preferred plan is to wait for a confirmed pullback rather than chase the current expansion.
If buyers defend demand, price could continue toward the HTF Supply and potentially the Major Supply above. Acceptance below $4,040.690 would weaken the bullish setup.
No confirmation, no trade. Long 
Education 
XAUUSD — Bullish FVG Retest Setup
Market Context
Gold is trading around $4,063 after breaking the short-term structure and printing a bullish BOS above the $4,040 area. The recovery followed an earlier MSS from the lower boundary of the descending channel, showing that buyers are gaining control of the intraday structure.
Price is now approaching the old high liquidity at $4,073.649. Rather than chasing the current move, the cleaner opportunity would be a controlled pullback into the Bullish FVG around $4,020–$4,028, where displaced price action could provide support.
SMC View
The MSS marked the first shift away from the previous bearish sequence, while the recent BOS confirmed bullish continuation. The Bullish FVG below price is the main decision zone because it represents the imbalance created during the breakout.
A retracement into this area would allow price to rebalance before targeting the liquidity above. Buyer control should be confirmed through bullish rejection followed by a lower-timeframe MSS, CHOCH or a clean reclaim of the FVG.
Main Trading Scenario
Condition:
Gold pulls back into the $4,020–$4,028 Bullish FVG and forms a clear bullish rejection. A lower-timeframe bullish MSS or CHOCH is required before entry.
Entry: $4,020–$4,028 after bullish confirmation
SL: Below $4,000 and the FVG reaction low
TP1: $4,073.649
TP2: $4,103.844
TP3: $4,135.068
Key Zones to Watch
Current price: $4,063
Bullish FVG: $4,020–$4,028
Old high liquidity: $4,073.649
Internal high: $4,103.844
Main target: $4,135.068
Invalidation: Acceptance below $4,000
Confirmation: Bullish rejection with MSS or CHOCH
Prime Gold View
The buy bias remains valid while Gold holds above the Bullish FVG and maintains the recent BOS. The preferred plan is to wait for a pullback into $4,020–$4,028 rather than chase price near the first liquidity target.
If buyers defend the FVG, price could expand toward $4,073.649, followed by $4,103.844 and $4,135.068. Acceptance below $4,000 would weaken the current bullish setup.
No confirmation, no trade. Long 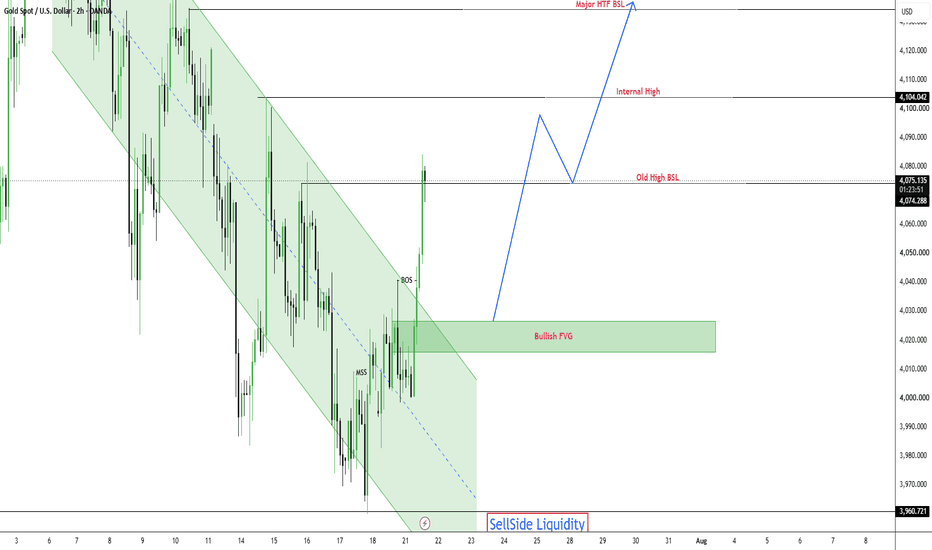
 Long
Long
 Long
Long
XAUUSD – Gold Pushes Higher, But The FVG Retest Will Decide XAUUSD – Gold Pushes Higher, But The FVG Retest Will Decide The Next Move
Gold is showing a stronger bullish recovery after breaking above the previous descending trendline.
Price is currently trading around 4,129, after a clean upside move from the lower support area near 4,045. Buyers are clearly more active now, and the structure has shifted from defensive recovery into a stronger short-term bullish continuation.
However, gold is now approaching a sensitive area. After such a strong move, a pullback into the Buy Order FVG zone may be needed before the next push higher.
FUNDAMENTAL ANALYSIS
Gold is receiving follow-through buying as traders continue to watch U.S.–Iran developments and broader geopolitical risk.
At the same time, higher oil prices can keep inflation concerns alive, which may support expectations for a tighter Fed outlook and strengthen the U.S. dollar. This can limit gold’s upside in the short term.
For now, the fundamental picture is mixed, but the chart is showing stronger buyer control. The key is whether gold can hold the FVG support after the breakout.
TECHNICAL ANALYSIS – SMC + FIBONACCI
From an SMC perspective, gold has broken above the previous bearish trendline and created a strong bullish displacement. This is an important structural change because sellers are no longer controlling price the same way they did last week.
The current Buy Order FVG zone is around 4,102 – 4,116. This area is very important because it may act as the next support if price pulls back. As long as gold holds above this zone, buyers may continue to target the higher resistance area.
The nearest strong support sits around 4,045. This is the level that protected the previous move and helped create the current bullish recovery.
Above current price, the main target resistance is around 4,202 – 4,209. This area aligns with Fibonacci extension and previous resistance, making it the next major test for buyers.
KEY PRICE ZONES
Current price: 4,129
Buy Order FVG zone: 4,102 – 4,116
Strong support: 4,045
Near resistance: 4,140
Target resistance: 4,202 – 4,209
Fibonacci extension target: 4,209
Bullish structure valid: Above 4,102
Invalidation for bullish recovery: Below 4,045
TRADING SCENARIOS
Buy Scenario
Buy Zone: 4,102 – 4,116
Entry: Bullish reaction, FVG retest, liquidity sweep, or lower-timeframe CHoCH
SL: Below 4,102 or below the nearest swing low
TP1: 4,140
TP2: 4,202
TP3: 4,209
Breakout Buy
Condition: Break and hold above 4,140
Target: 4,202 – 4,209
Sell Scenario
Sell is not the priority while gold remains above the Buy Order FVG.
Sell Zone: 4,202 – 4,209
Entry: Bearish rejection, failed breakout, or lower-timeframe bearish CHoCH
TP1: 4,140
TP2: 4,116
Invalidation: If price breaks and holds above 4,209, the sell reaction idea becomes weaker.
MY VIEW
Gold is recovering with stronger momentum.
The breakout above the descending trendline is a positive sign for buyers, but I do not want to chase price too high after a strong move. The cleaner setup is to watch whether gold can retest and hold the 4,102 – 4,116 Buy Order FVG zone.
If this zone holds, the path toward 4,202 – 4,209 remains open.
If buyers fail to defend the FVG and price returns below 4,045, the bullish recovery becomes weaker.
For now, gold is showing strength — but the FVG retest will decide whether this move can continue.
Do you think gold will hold the 4,102 – 4,116 FVG and continue toward 4,209?
Long 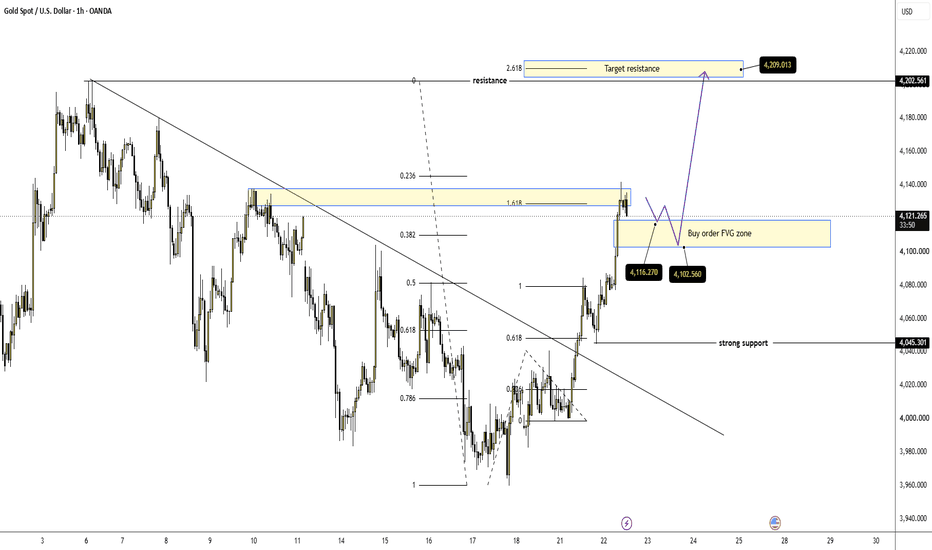
Nestlé India Ltd.📈 Nestlé India Ltd. (1W) – Strong Breakout Retest Keeps the Long-Term Trend Bullish 🚀
Nestlé India has successfully broken above a long-standing resistance zone and is now consolidating just below the next key hurdle. The breakout, backed by strong volume and a healthy retest, suggests that the stock is preparing for another leg higher if buying momentum continues. 👀
🔍 Technical Highlights
✅ Successful Breakout Above ₹1,386
The stock has convincingly moved above the ₹1,386 resistance level, which had acted as a major ceiling for several months. Holding above this level confirms a positive shift in the long-term trend.
✅ Healthy Consolidation After Breakout
Instead of giving back gains, Nestlé India is consolidating near the breakout zone. This type of price action often indicates that buyers are absorbing supply before the next directional move.
✅ Volume Supports the Move
The initial breakout was accompanied by a noticeable increase in trading volume, adding credibility to the bullish setup. The current consolidation on relatively controlled volume reflects healthy profit booking rather than aggressive selling.
🎯 Measured Move Projection
If the stock manages a decisive weekly close above ₹1,496, the measured move projects a potential rally towards the ₹1,720 zone, offering an upside of approximately 15–18% from the breakout confirmation level.
⚠️ What Traders Should Watch
🔹 A weekly close above ₹1,496 would confirm fresh momentum and increase the probability of a move toward the projected target.
🔹 The ₹1,386 zone now becomes the key support. Holding above this level keeps the breakout structure intact.
🔹 As long as the stock continues to form higher highs and higher lows, the broader trend remains positive.
📌 Key Levels
🟢 Immediate Resistance: ₹1,496
🛡️ Major Support: ₹1,386
🛡️ Long-Term Support: ₹1,050
🎯 Potential Target: ₹1,720
💡 Final Thoughts
Nestlé India has transitioned into a strong bullish phase after breaking a significant resistance zone. The ongoing consolidation appears constructive rather than weak, and a decisive move above ₹1,496 could trigger the next leg of the uptrend toward ₹1,720. As long as the stock holds above ₹1,386, the technical outlook remains firmly positive.
📢 Do you think Nestlé India is gearing up for a fresh breakout toward ₹1,720, or will it spend more time consolidating first? Share your views below! 👇  Long
Long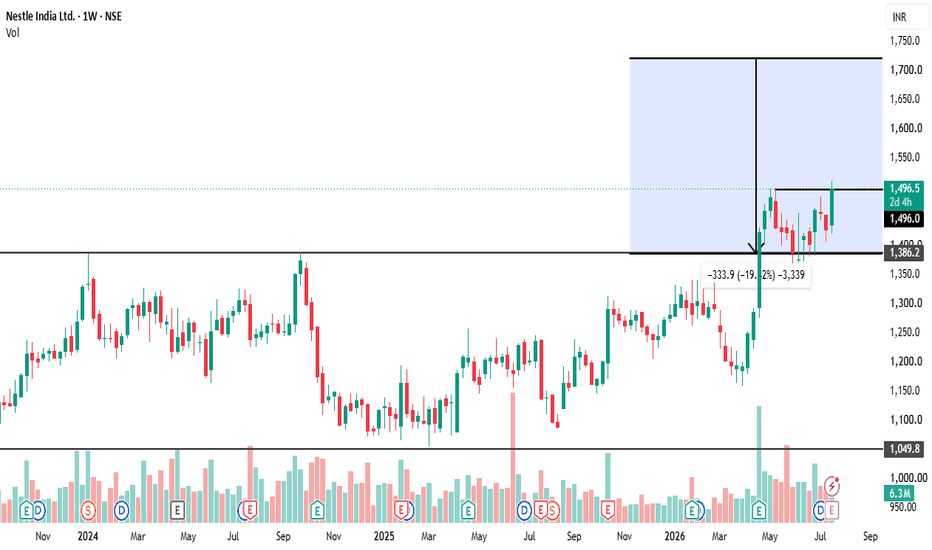
 Long
Long