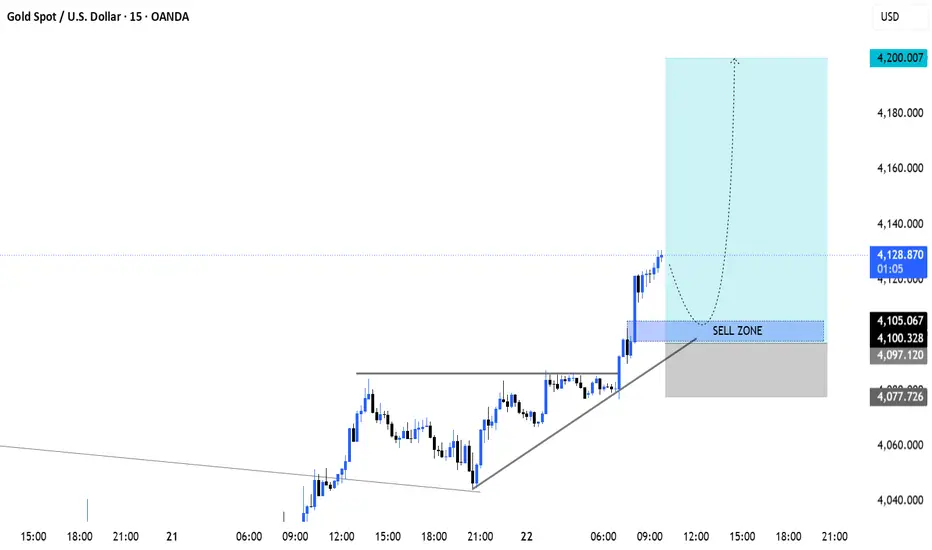
XAUUSD – Gold Pushes Higher, But The FVG Retest Will Decide XAUUSD – Gold Pushes Higher, But The FVG Retest Will Decide The Next Move
Gold is showing a stronger bullish recovery after breaking above the previous descending trendline.
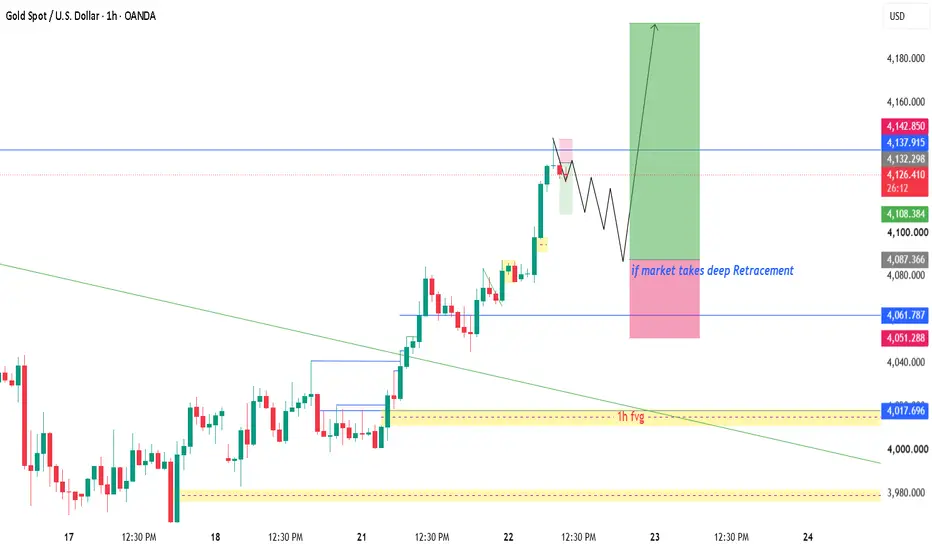
Price is currently trading around 4,129, after a clean upside move from the lower support area near 4,045. Buyers are clearly more active now, and the structure has shifted from defensive recovery into a stronger short-term bullish continuation.
However, gold is now approaching a sensitive area. After such a strong move, a pullback into the Buy Order FVG zone may be needed before the next push higher.
FUNDAMENTAL ANALYSIS
Gold is receiving follow-through buying as traders continue to watch U.S.–Iran developments and broader geopolitical risk.
At the same time, higher oil prices can keep inflation concerns alive, which may support expectations for a tighter Fed outlook and strengthen the U.S. dollar. This can limit gold’s upside in the short term.
For now, the fundamental picture is mixed, but the chart is showing stronger buyer control. The key is whether gold can hold the FVG support after the breakout.
TECHNICAL ANALYSIS – SMC + FIBONACCI
From an SMC perspective, gold has broken above the previous bearish trendline and created a strong bullish displacement. This is an important structural change because sellers are no longer controlling price the same way they did last week.
The current Buy Order FVG zone is around 4,102 – 4,116. This area is very important because it may act as the next support if price pulls back. As long as gold holds above this zone, buyers may continue to target the higher resistance area.
The nearest strong support sits around 4,045. This is the level that protected the previous move and helped create the current bullish recovery.
Above current price, the main target resistance is around 4,202 – 4,209. This area aligns with Fibonacci extension and previous resistance, making it the next major test for buyers.
KEY PRICE ZONES
Current price: 4,129
Buy Order FVG zone: 4,102 – 4,116
Strong support: 4,045
Near resistance: 4,140
Target resistance: 4,202 – 4,209
Fibonacci extension target: 4,209
Bullish structure valid: Above 4,102
Invalidation for bullish recovery: Below 4,045
TRADING SCENARIOS
Buy Scenario
Buy Zone: 4,102 – 4,116
Entry: Bullish reaction, FVG retest, liquidity sweep, or lower-timeframe CHoCH
SL: Below 4,102 or below the nearest swing low
TP1: 4,140
TP2: 4,202
TP3: 4,209
Breakout Buy
Condition: Break and hold above 4,140
Target: 4,202 – 4,209
Sell Scenario
Sell is not the priority while gold remains above the Buy Order FVG.
Sell Zone: 4,202 – 4,209
Entry: Bearish rejection, failed breakout, or lower-timeframe bearish CHoCH
TP1: 4,140
TP2: 4,116
Invalidation: If price breaks and holds above 4,209, the sell reaction idea becomes weaker.
MY VIEW
Gold is recovering with stronger momentum.
The breakout above the descending trendline is a positive sign for buyers, but I do not want to chase price too high after a strong move. The cleaner setup is to watch whether gold can retest and hold the 4,102 – 4,116 Buy Order FVG zone.
If this zone holds, the path toward 4,202 – 4,209 remains open.
If buyers fail to defend the FVG and price returns below 4,045, the bullish recovery becomes weaker.
For now, gold is showing strength — but the FVG retest will decide whether this move can continue.
Do you think gold will hold the 4,102 – 4,116 FVG and continue toward 4,209?
 Long
Long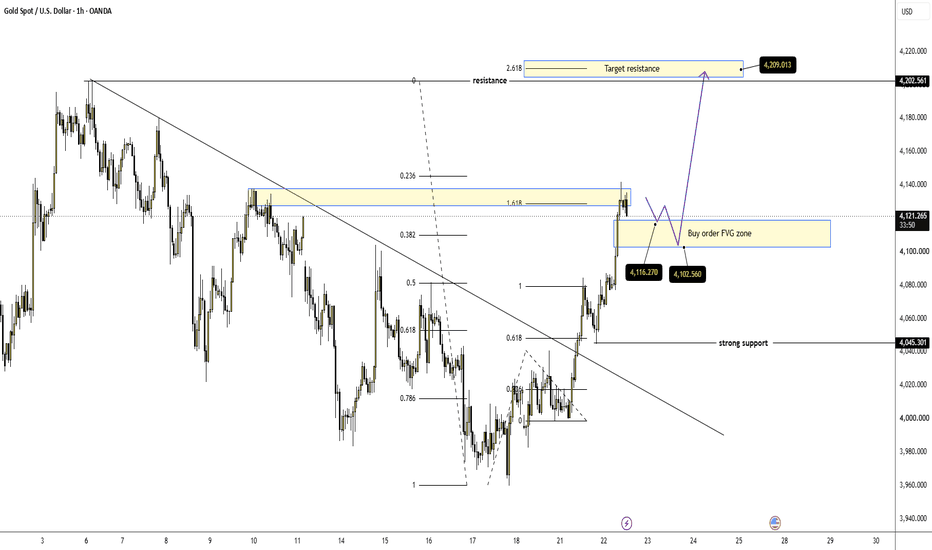
Nestlé India Ltd.📈 Nestlé India Ltd. (1W) – Strong Breakout Retest Keeps the Long-Term Trend Bullish 🚀
Nestlé India has successfully broken above a long-standing resistance zone and is now consolidating just below the next key hurdle. The breakout, backed by strong volume and a healthy retest, suggests that the stock is preparing for another leg higher if buying momentum continues. 👀
🔍 Technical Highlights
✅ Successful Breakout Above ₹1,386
The stock has convincingly moved above the ₹1,386 resistance level, which had acted as a major ceiling for several months. Holding above this level confirms a positive shift in the long-term trend.
✅ Healthy Consolidation After Breakout
Instead of giving back gains, Nestlé India is consolidating near the breakout zone. This type of price action often indicates that buyers are absorbing supply before the next directional move.
✅ Volume Supports the Move
The initial breakout was accompanied by a noticeable increase in trading volume, adding credibility to the bullish setup. The current consolidation on relatively controlled volume reflects healthy profit booking rather than aggressive selling.
🎯 Measured Move Projection
If the stock manages a decisive weekly close above ₹1,496, the measured move projects a potential rally towards the ₹1,720 zone, offering an upside of approximately 15–18% from the breakout confirmation level.
⚠️ What Traders Should Watch
🔹 A weekly close above ₹1,496 would confirm fresh momentum and increase the probability of a move toward the projected target.
🔹 The ₹1,386 zone now becomes the key support. Holding above this level keeps the breakout structure intact.
🔹 As long as the stock continues to form higher highs and higher lows, the broader trend remains positive.
📌 Key Levels
🟢 Immediate Resistance: ₹1,496
🛡️ Major Support: ₹1,386
🛡️ Long-Term Support: ₹1,050
🎯 Potential Target: ₹1,720
💡 Final Thoughts
Nestlé India has transitioned into a strong bullish phase after breaking a significant resistance zone. The ongoing consolidation appears constructive rather than weak, and a decisive move above ₹1,496 could trigger the next leg of the uptrend toward ₹1,720. As long as the stock holds above ₹1,386, the technical outlook remains firmly positive.
📢 Do you think Nestlé India is gearing up for a fresh breakout toward ₹1,720, or will it spend more time consolidating first? Share your views below! 👇  Long
Long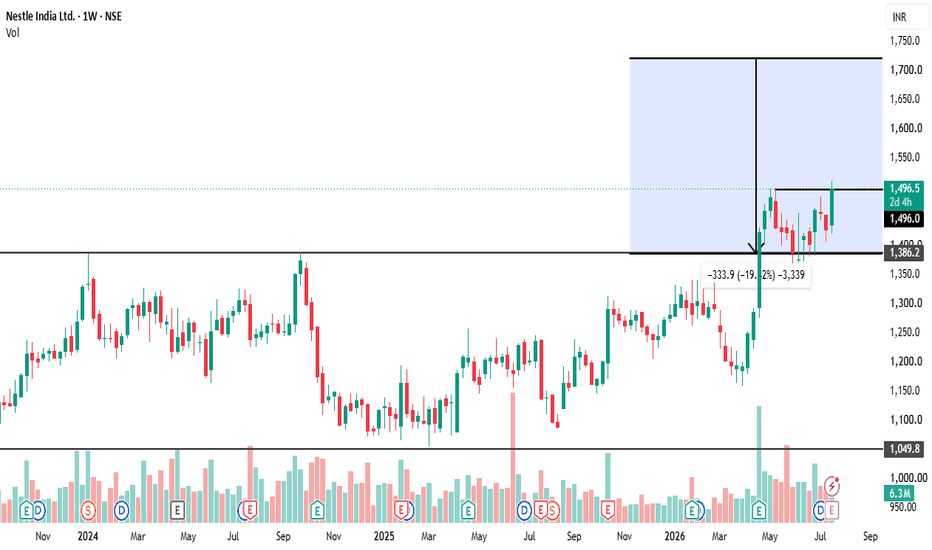
 Long
Long
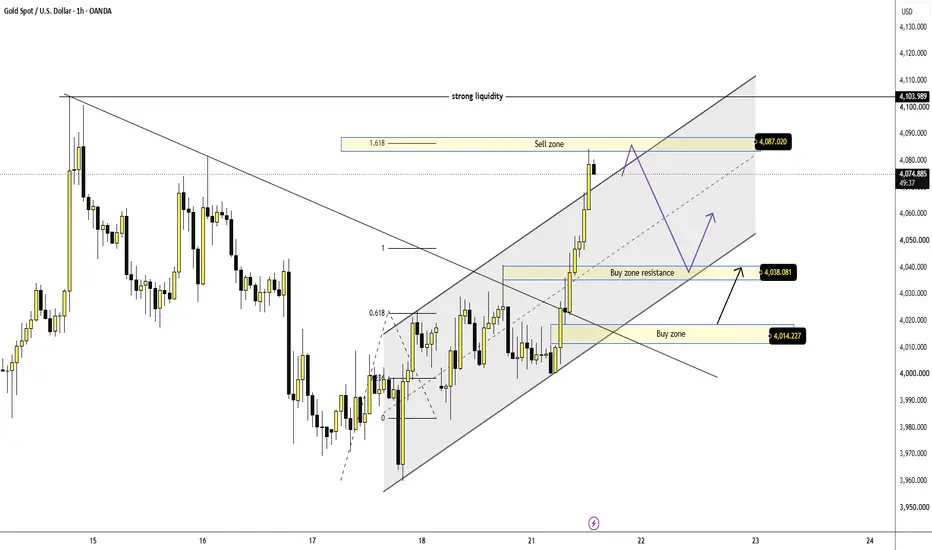
XAUUSD – Gold Rebounds Strongly, But 4,087 Is The First Test XAUUSD – Gold Rebounds Strongly, But 4,087 Is The First Test
Gold is showing a strong recovery from the lower buy zone.
After dropping close to the 4,000 area earlier, price reacted sharply from the 4,014 buy zone and is now trading around 4,077. This tells us that buyers are still active and the short-term structure has shifted into a cleaner recovery phase.
But the market is now moving into a sensitive area. Gold is approaching the 4,087 sell zone, and this is where sellers may try to react again.
FUNDAMENTAL ANALYSIS
Gold remains influenced by geopolitical tension and Fed expectations.
The recent U.S.–Iran headlines may keep safe-haven demand active, but rate expectations are still important. Traders currently see a low chance of a July rate hike, while the market still prices in the possibility of at least one hike later in the year.
This creates a mixed background: geopolitical risk may support gold, but a stronger USD or higher rate expectations can still limit upside.
TECHNICAL ANALYSIS – SMC + MARKET STRUCTURE
From an SMC perspective, gold has reacted strongly from the buy zone around 4,014 and created bullish displacement into the upper part of the short-term rising channel.
The first support zone is now 4,038. If price pulls back and holds above this area, buyers may attempt another push higher.
The key resistance is 4,087. This area sits near the 1.618 extension and is marked as a sell zone on the chart. If gold rejects from this level, a pullback toward 4,038 may appear.
Above 4,087, the next liquidity area is around 4,103. A clean break above 4,103 would make the bullish continuation stronger and open the path for higher movement inside the channel.
KEY PRICE ZONES
Current price: 4,077
Buy zone: 4,014
Buy zone resistance / support: 4,038
Sell zone: 4,087
Strong liquidity: 4,103
Channel support: 4,038 – 4,014
Bullish continuation above: 4,103
Invalidation for recovery view: Below 4,014
TRADING SCENARIOS
Buy Scenario
Buy Zone: 4,038 or 4,014
Entry: Bullish reaction, liquidity sweep, or lower-timeframe CHoCH
SL: Below 4,014
TP1: 4,087
TP2: 4,103
TP3: Higher channel resistance if momentum expands
Breakout Buy
Condition: Break and hold above 4,103
Target: Upper channel continuation
Sell Scenario
Sell Zone: 4,087
Entry: Bearish rejection, failed breakout, or lower-timeframe bearish CHoCH
SL: Above 4,103
TP1: 4,038
TP2: 4,014
Invalidation: If price breaks and holds above 4,103, the sell reaction idea becomes weaker.
MY VIEW
Gold is recovering well, but the next test is very close.
The reaction from 4,014 was strong, and buyers are now controlling the short-term move. However, the 4,087 – 4,103 area may decide whether this recovery continues or slows down.
For me, I prefer not to chase price directly into resistance. The cleaner plan is to wait for either a pullback into 4,038 for a buy reaction, or a breakout above 4,103 for continuation.
Gold is stronger today — but confirmation above 4,103 would make the recovery much cleaner.
Do you think gold can break above 4,103, or will sellers defend the 4,087 sell zone first?
Short 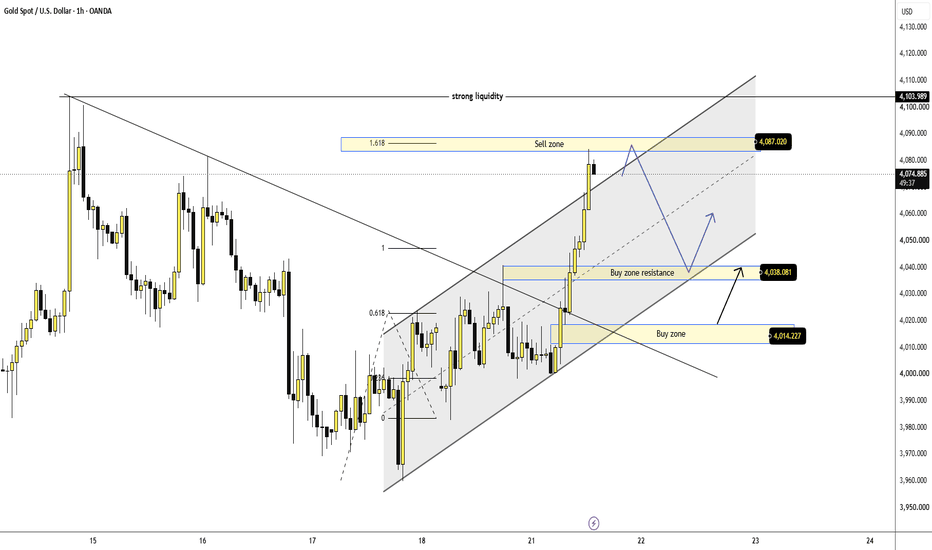
XAUUSD — Buy the Fibonacci PullbackFundamental Analysis
Gold gained more than 1% as markets assessed the possibility of a U.S.–Iran ceasefire and softer crude oil prices, which could reduce energy-driven inflationary pressure. However, firm US Treasury yields and renewed expectations of further Federal Reserve tightening may limit the upside ahead of the 28–29 July FOMC meeting.
Technical Analysis
On the 1H chart, XAUUSD is trading around 4,082.65 after breaking above the descending trendline and testing the immediate resistance near 4,078.67. Since the price has already made a strong upward move, the preferred strategy is to wait for a pullback into the 4,038.30–4,047.83 zone, where the 0.5–0.618 Fibonacci retracement levels coincide with the previous breakout support.
If buyers defend this zone with bullish confirmation, gold could retest 4,078–4,085 before extending towards 4,100 and eventually the 1.618 Fibonacci extension at 4,128.56.
Important Price Levels
Current Price: 4,082.65
Primary Buy Zone: 4,038.30–4,047.83
Short-term Support: 4,038.30–4,047.83
Short-term Resistance: 4,078.67–4,085
Liquidity Zone: 4,126.30–4,133
Primary Target: 4,128.56
Invalidation Level: Below 4,018.42
Trading Plan
Main Buy Setup
Entry: 4,038.30–4,047.83
Stop Loss: 4,018.42
Take Profit 1: 4,078.67
Take Profit 2: 4,100
Take Profit 3: 4,126.30–4,133
Buy Confirmation
Wait for the price to retrace into the primary buy zone and show clear bullish rejection. Confirmation may include a long lower wick, a bullish engulfing candle, a failed breakdown, or a 1H candle closing back above 4,047.83, signalling renewed buying interest.
If the price breaks below 4,018.42 and sustains beneath that level, the bullish setup will no longer be valid.
Overall Outlook
The short-term trend remains bullish following the breakout above the descending trendline. However, buying at the current price may not provide the best risk-to-reward opportunity. Waiting for a healthy pullback into the 4,038.30–4,047.83 demand zone offers a more favourable buying opportunity, with 4,128.56 remaining the primary upside target. This area may also attract profit booking and trigger a temporary bearish reaction.
Do you think gold will revisit the primary buy zone first, or continue its rally straight towards the 1.618 Fibonacci extension target? Long 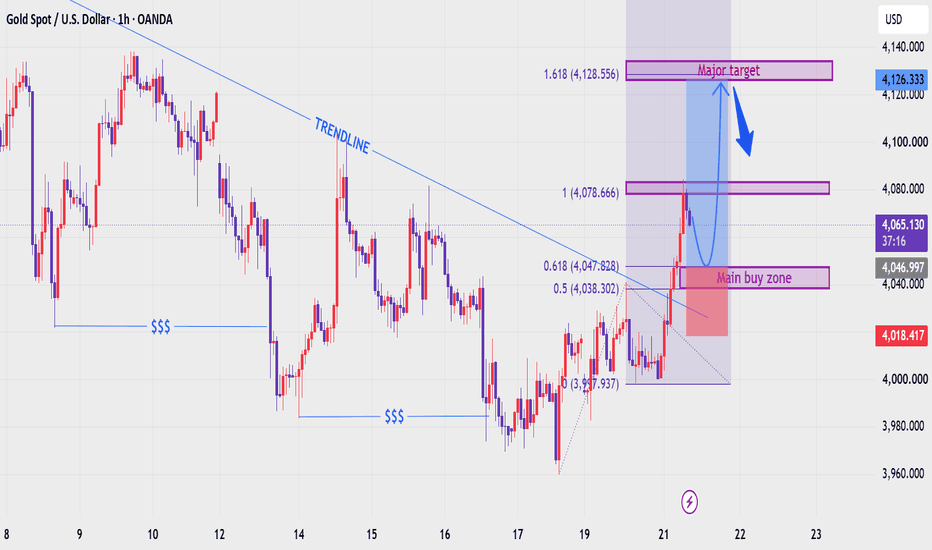
NESTLE Stock Analysis 📈 NESTLE INDIA LTD. | Descending Triangle Breakout | Bullish Reversal Setup
A descending triangle formed during the consolidation phase. The breakout above resistance signals buyers have regained the upper hand, paving the way for further upside.
On the 4H chart, Nestle India has been trading within a well-defined descending triangle, where lower highs repeatedly tested the falling resistance while buyers continued defending the rising support. The recent breakout above the descending trendline indicates that demand has finally overcome supply, increasing the probability of a bullish trend continuation.
🔍 Technical Highlights:
• Descending Triangle Breakout
• Strong Consolidation Before Breakout
• Falling Resistance Successfully Broken
• Buyers Regaining Control
• Bullish Momentum Building
• Trend Reversal Confirmation
🎯 Upper Side Possible Targets:
✅ Target 1: ₹1,520
✅ Target 2: ₹1,600
As long as the price sustains above the breakout trendline, the bullish structure remains intact. A successful retest of the breakout level could provide a favorable risk-reward buying opportunity before the next leg higher.
📊 Market Psychology:
The descending triangle reflected weakening selling pressure despite repeated attempts to push prices lower. Once buyers absorbed the available supply, the breakout above resistance confirmed a shift in momentum. If follow-through buying continues, the stock may witness a fresh bullish expansion.
💬 Do you think Nestle India will continue its breakout rally, or will it first retest the trendline before moving higher? Share your technical view below.
⚠️ Disclaimer:
This analysis is shared for educational purposes only and should not be considered financial advice. Always conduct your own research and use proper risk management before taking any trade. Long 
SBC EXPORTS: High-Momentum Textile Rally Meets Premium ValuationOverview :
SBC Exports Limited (NSE: SBC) is showcasing exceptional multi-timeframe bullish momentum, currently trading near the ₹42.16 zone. The stock has delivered an impressive multi-bagger performance over the past year (+149.7%), driven by aggressive revenue expansion and repeat corporate order wins. However, trading significantly above its historical value area, it represents a classic high-growth, high-risk proposition.
Technical Trend Direction & Key S/R Levels :
Trend Direction : The technical structure remains firmly bullish across the short, medium, and long-term horizons (aligned Buy ratings on 4h, daily, and weekly charts), supported by a rising moving average ribbon and strong volume accumulation.
Key Resistance : Immediate overhead supply sits at the macro ascending trendline around ₹45.58. A decisive weekly close above this barrier opens the path for extended price discovery.
Key Support : The immediate structural safety net rests at the Value Area High (VAH) shelf near ₹29.12, with major deeper multi-year support anchored around the ₹24.27 swing low and the Point of Control (POC) at ₹14.03.
Fundamental Analysis & Valuation :
Growth vs. Leverage : SBC operates as a leveraged growth play. TTM revenue surged +34.4% YoY to $4.0B, and net income jumped +87.4% to $342M with a solid net margin of 8.5%. However, this comes with financial strain—total debt and a high debt-to-equity ratio of 2.83 require close monitoring alongside negative free cash flow trends.
Valuation Multiples : The growth comes at a steep price. SBC trades at a P/E multiple of 58.9 and an EV/EBITDA of 66.4, placing it at a substantial premium compared to industry medians.
Sector Comparison :
When compared against textile peers like WELSPUNLIV (Welspun Living), ARVIND, and GHCLTEXTIL, SBC commands the highest 1-year return and top-line growth rate (+34.4% YoY vs peers). However, peers like Arvind offer a more balanced profile with a moderate P/E of 33.2 and "Strong Buy" consensus ratings, whereas SBC trades at the highest valuation multiple in the group.
Directional Bias & 1–3 Year Outlook (Levels to Watch) :
Bias: BULLISH WITH CAUTION (1–3 Year Horizon)
Strategy : For a 1 to 3-year holding window, momentum favors the buyers as long as macro support structures hold. Chasing aggressively at current extended levels carries mean-reversion risk; a disciplined approach involves waiting for a breakout confirmation above ₹45.58 or scaling in on healthy pullbacks toward the ₹29.12 value area.
Disclaimer: This analysis is for educational purposes only and does not constitute financial advice. Always perform your own research and manage your risk accordingly.  Long
Long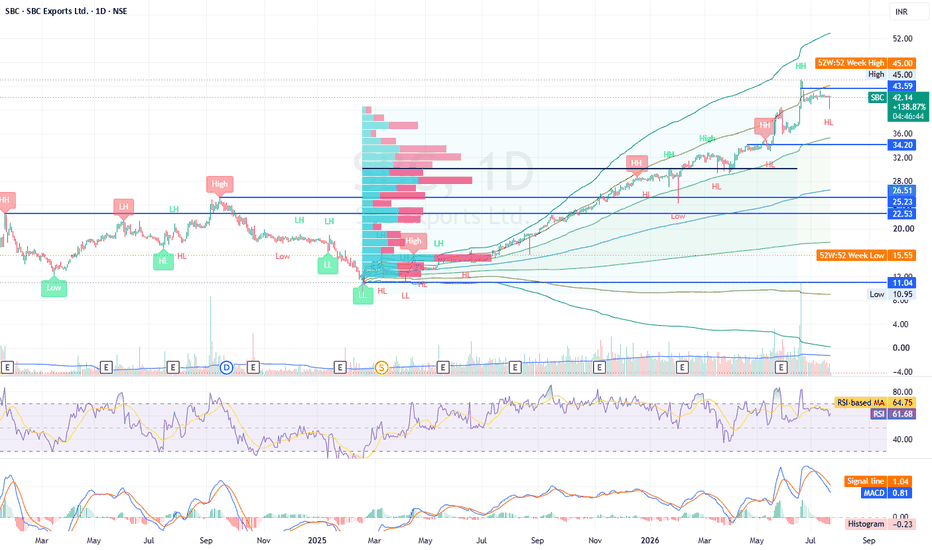
 Short
Short
 Short
Short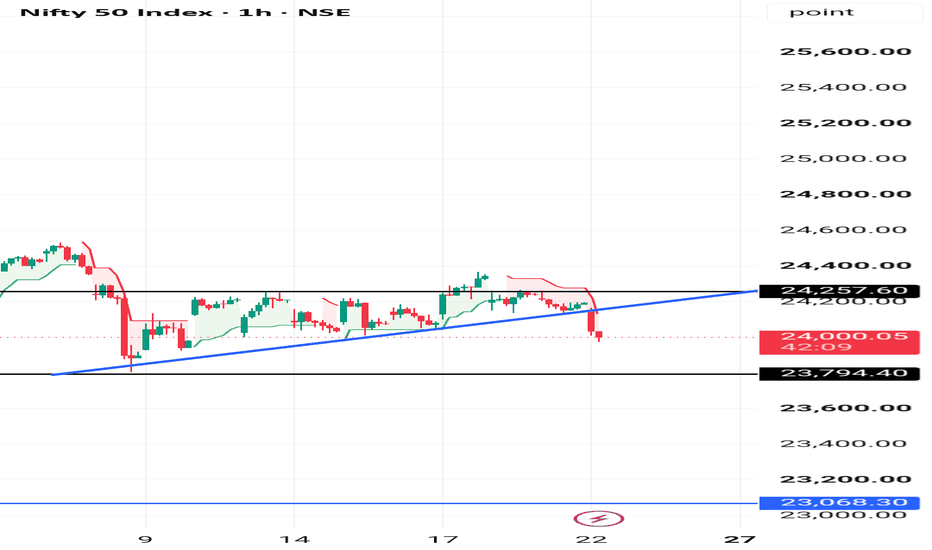
Long 
Long 
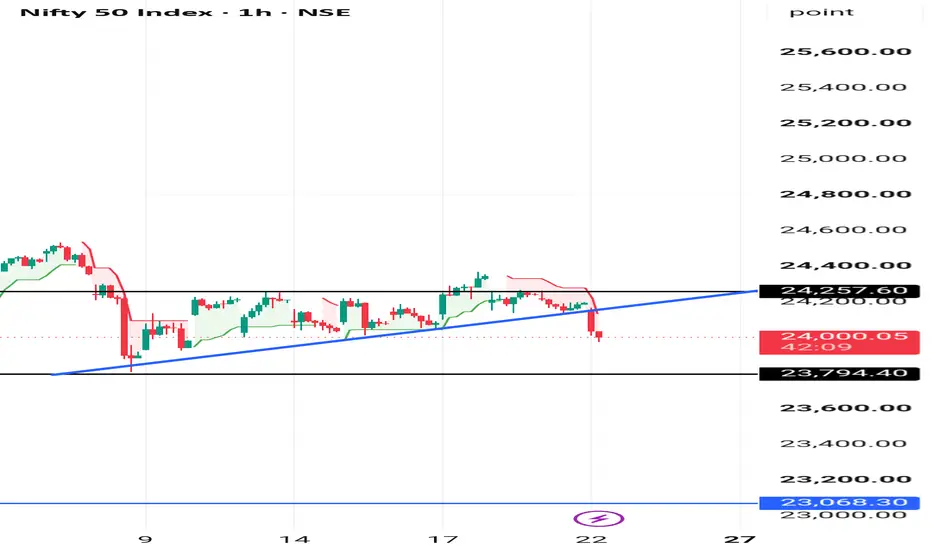
#NIFTY Intraday Support and Resistance Levels - 22/07/2026Nifty is expected to witness a flat opening with no major overnight cues. The index is consolidating near the 24190–24200 zone, indicating indecision after the recent recovery. Traders should wait for confirmation around key support and resistance levels before initiating fresh positions.
If Nifty sustains above 24250 after the opening, traders can consider long positions with upside targets of 24350, 24400, and 24450. A decisive breakout above 24450 will confirm fresh bullish momentum and can extend the rally further.
On the downside, if Nifty fails to hold 24200 and slips below this support, traders can consider short positions with downside targets of 24150, 24100, and 24050. A sustained move below 24050 will strengthen the bearish bias and may trigger additional selling pressure.
Overall, a flat opening is expected with range-bound trading likely during the initial session. As long as Nifty holds above the 24200 support zone, buying on dips remains the preferred strategy. Traders should wait for a confirmed breakout or breakdown near the opening range, maintain disciplined stop-losses, and book profits gradually at the mentioned target levels. #BANKNIFTY Intraday PE & CE Levels(22/07/2026)Bank Nifty is expected to witness a flat opening with mixed global cues and no significant overnight trigger. The index is consolidating around the 57800 zone after the recent rally, suggesting that traders should wait for a confirmed breakout or breakdown before initiating fresh positions.
If Bank Nifty sustains above 57550–57600 after the opening, traders can consider buying CE options with upside targets of 57750, 57850, and 57950. A decisive breakout above 58050 will confirm renewed bullish momentum and can extend the rally towards 58250, 58350, and 58450+.
On the downside, if Bank Nifty faces rejection near 57950–57900 and slips lower, traders can consider buying PE options with downside targets of 57750, 57650, and 57550. A sustained breakdown below 57450 will strengthen the bearish bias and may drag the index towards 57250, 57150, and 57050.
Overall, a flat opening is expected with range-bound movement likely during the initial session. As long as Bank Nifty holds above the 57550–57600 support zone, buying on dips remains the preferred strategy. Traders should wait for confirmation around the opening range, avoid chasing trades in the middle of the range, and follow strict stop-losses while booking profits at the mentioned target levels. Nifty View (August 2026 to June 2027)## NIFTY – A Cautious Outlook
On the monthly chart, NIFTY appears to have formed a **Double Top pattern** and is currently trading below the **Monthly Pivot**. Considering the evolving global geopolitical and economic environment—including developments in the Middle East, the Russia–Ukraine conflict, and concerns surrounding a possible AI bubble—there appears to be an increased possibility of further downside in NIFTY.
### Important Levels to Watch
* **Below 22,300:** NIFTY could potentially move towards the **20,100** level.
* **Around 19,100:** This could act as a possible reversal zone, based on the **Golden Ratio**.
* **If 19,100 is decisively breached:** NIFTY could potentially decline towards the **15,500–16,000** zone over the coming months.
### Astrological Perspective
From an astrological perspective, **Rahu is expected to transit Makara Rāśi (Capricorn) in December 2026**. This transit could potentially coincide with increased economic stress, job losses and financial difficulties. The impact may gradually spread across various sectors, particularly if consumer spending weakens and loan and EMI defaults increase.
### What Could Negate This View?
This bearish outlook would be invalidated if **NIFTY decisively breaks and sustains above its previous high of 26,374**.
### Investor Caution
Investors should exercise caution and consider appropriate **risk-management and hedging strategies** for their investments.
New investors may consider adopting a **systematic, staggered investment approach** in NIFTY-based instruments such as **NIFTY BEES**, rather than investing their entire capital at one time. A disciplined approach to investing during market declines may be considered, but investors should carefully assess their own risk tolerance and financial capacity before making any investment decision.
**Disclaimer:** The views and analysis expressed above are solely my own and are intended for educational and informational purposes only. I am **not registered with SEBI** as an investment adviser or research analyst. This is not investment advice or a recommendation to buy or sell any security. Investors should conduct their own research and consult a **SEBI-registered investment adviser or other appropriately qualified financial professional** before making any investment decision. Past performance and technical or astrological analysis do not guarantee future market outcomes.
Long 
HDFC Bank — Fourth Test of a Multi-Year TrendlineOverview
HDFC Bank has just fallen sharply this week (-7.09%), and this drop is bringing it down toward a trendline that's been holding since 2022. This trendline has already been tested three times before — and now it's headed for a fourth test, right around the 732 zone.
What's Happening
Looking at the weekly chart, there's a rising trendline connecting the lows going all the way back to 2022. Price has tested this trendline three times already (marked on the chart), and each time it has held. Now, after this week's sharp fall, price is heading toward the trendline for a fourth time.
The more times a trendline gets tested and holds, the more traders tend to watch and respect that level — but it's also fair to note that each additional test can increase the risk of an eventual failure too. A trendline doesn't hold forever.
Key Levels to Watch
Trendline Support (4th test approaching): 732
Resistance above (recent swing high): 843
Current price: 761.45
Two Ways This Can Go
If the trendline holds a fourth time: That would be an impressive track record for this level, and a bounce from here would likely head back toward the 843 resistance zone.
If the trendline finally breaks: A weekly close well below 732 would be a meaningful development — the first failure of this level in over three years — and would open the door to levels well below anything seen on this trendline so far.
Beginner's Lesson
Every extra time a trendline holds adds to its credibility, but it doesn't guarantee the next test will go the same way. In fact, some traders get caught off guard exactly because a level "always held before" — right before the one time it doesn't. This is why watching for confirmation, especially after a sharp move like this week's, matters more than assuming history repeats.
Conclusion
HDFC Bank is heading into an important fourth test of a multi-year trendline, right after a sharp weekly fall. As always, we're watching for confirmation rather than assuming either outcome.
For educational purposes only. Not financial advice. Always manage your risk.  Long
Long
Long