XAUUSD — Bullish Structure Holding, Buy Setup Still Priority
Gold is trading around $4,128 after forming a short-term correction from the upper reaction zone. The main structure remains bullish because price is still holding above the rising trendline and the recent market structure continues to show multiple CHOCH and BOS signals to the upside.
From an SMC perspective, gold has already shifted from the previous bearish leg into a recovery structure. The current movement looks more like accumulation and correction rather than a confirmed bearish revers
Trend Lines
Nifty Intraday Analysis for 07th July 2026NSE:NIFTY
The uptrend will likely continue, but expect volatility due to the weekly option expiry.
The upward movement may lead to 24650 – 24700 resistance range and if the index crosses and sustains above this level then may reach near 24900 – 24950 range.
On the contrary, a downward moment may drag the Index to 24200 – 24150 support range in downward momentum and if this support is broken then index may tank near 23950 – 23900 range.
Banknifty Intraday Analysis for 07th July 2026NSE:BANKNIFTY
The uptrend is expected to continue; therefore, any gap-down opening will be seen as a fresh entry opportunity.
The upward moment may lead the Index to 58900 – 59000 resistance range in upward momentum and if the index crosses and sustains above this level then may reach near 59600 – 59700 range.
On the contrary, a downward moment may drag the Index to 57700 – 57600 support range in downward momentum and if this support is broken then the index may tank near the 57000 – 56900
Finnifty Intraday Analysis for 07th July 2026NSE:CNXFINANCE
The uptrend is expected to continue; therefore, any gap-down opening will be seen as a fresh entry opportunity.
The upward movement may lead the Index to 27250 - 27300 resistance range and if the index crosses and sustains above this level then may reach near 27550 - 27600 range.
On the contrary, a downward moment may drag the to 26750 – 26700 support range and if this support too is broken then index may tank near 26450 – 26400 range.
Midnifty Intraday Analysis for 0 7th July 2026NSE:NIFTY_MID_SELECT
The uptrend is expected to continue; therefore, any gap-down opening will be seen as a fresh entry opportunity.
The upward movement may lead the Index near 14775 – 14800 resistance range and if the index crosses and sustains above this level then may reach 14975 – 15000 range.
On the contrary, a downward moment may drag the index to 14475 – 14450 support range and if this support is broken then index may tank near 14275 – 14250 range.
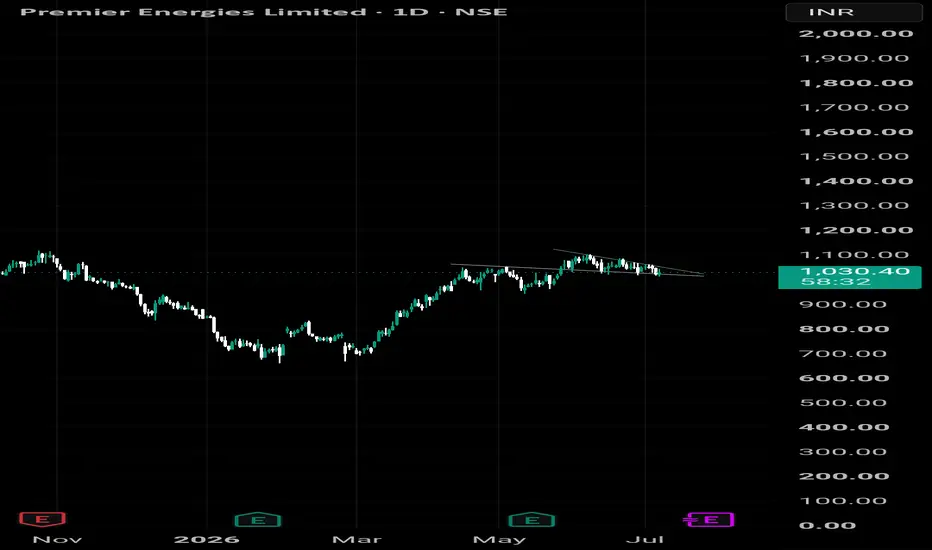
Premier Energies: Chart at a Decision PointA classic descending triangle is forming on the daily chart. 📉➡️📈
🔹 Price is compressing near support.
🔹 A breakout above the trendline could trigger fresh momentum.
🔹 A breakdown may lead to another round of selling.
The next few sessions could decide the next major move. 👀
Breakout or Breakdown? What's your view? 👇
XAUUSD — Gold Is Not Weak, But This Is Not a Clean Buy YetGold is holding a much better structure than before.
After the recovery from the lower area, price is now staying above the rising trendline and moving close to the first resistance zone around 4,188.
This tells me one thing:
Buyers are still present.
But the market is not giving the cleanest entry at the current price.
Gold is now sitting between resistance and support.
That means the next best trade may come from patience, not prediction.
THE SIMPLE READ
Gold remains constructive while
NIFTY at very crucial zone!As we can see NIFTY is back at very crucial zone which is both an important supply zone and a psychological level. Since, this zone has been tested multiple times now, making it weaker hence we can expect a strong upmove if NIFTY manages to close above the given zone. Until the NIFTY can remain sideways to volatile so plan your trades accordingly and keep watching everyone.
AUDUSD getting ready for a rally?After a decline of 5.6% that we saw form 6th may 2026 to 30th June 2026, price has formed a bottoming formation at a strong Support, from where it has seen bounce backs earlier, after the breakout of the bearish trendline and sustaining comfortably above the neckline we might expect a good rally from the current levels.
Important levels:
0.6921 is an immediate support and below it 0.6883 can act as strong support. where as no any significant resistance is seen below 0.7041.
Structurally AUDUSD
Nifty Intraday Analysis for 06th July 2026NSE:NIFTY
The uptrend is expected to continue; therefore, any gap-down opening will be seen as a fresh entry opportunity.
The upward movement may lead to 24500 – 24550 resistance range and if the index crosses and sustains above this level then may reach near 24750 – 24800 range.
On the contrary, a downward moment may drag the Index to 24050 – 24000 support range in downward momentum and if this support is broken then index may tank near 23800 – 23750 range.
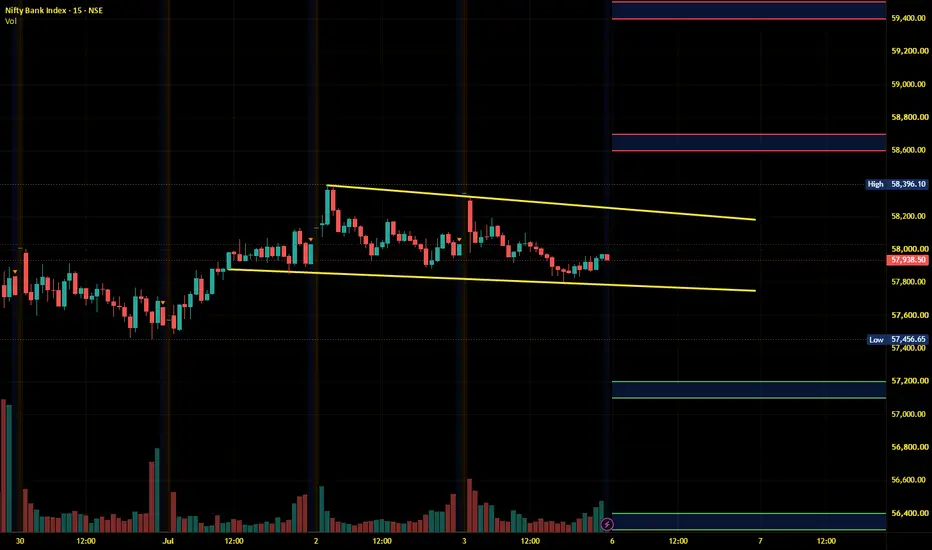
Banknifty Intraday Analysis for 06th July 2026NSE:BANKNIFTY
The uptrend is expected to continue; therefore, any gap-down opening will be seen as a fresh entry opportunity.
The upward moment may lead the Index to 58600 – 58700 resistance range in upward momentum and if the index crosses and sustains above this level then may reach near 59400 – 59500 range.
On the contrary, a downward moment may drag the Index to 57200 – 57100 support range in downward momentum and if this support is broken then the index may tank near the 56400 – 56300
Finnifty Intraday Analysis for 06th July 2026NSE:CNXFINANCE
The uptrend is expected to continue; therefore, any gap-down opening will be seen as a fresh entry opportunity.
The upward movement may lead the Index to 27100 - 27150 resistance range and if the index crosses and sustains above this level then may reach near 27400 - 27450 range.
On the contrary, a downward moment may drag the to 26600 – 26550 support range and if this support too is broken then index may tank near 26300 – 26250 range.
Midnifty Intraday Analysis for 0 6th July 2026NSE:NIFTY_MID_SELECT
The uptrend is expected to continue; therefore, any gap-down opening will be seen as a fresh entry opportunity.
The upward movement may lead the Index near 14700 – 14725 resistance range and if the index crosses and sustains above this level then may reach 14900 – 14925 range.
On the contrary, a downward moment may drag the index to 14400 – 14375 support range and if this support is broken then index may tank near 14200 – 14175 range.
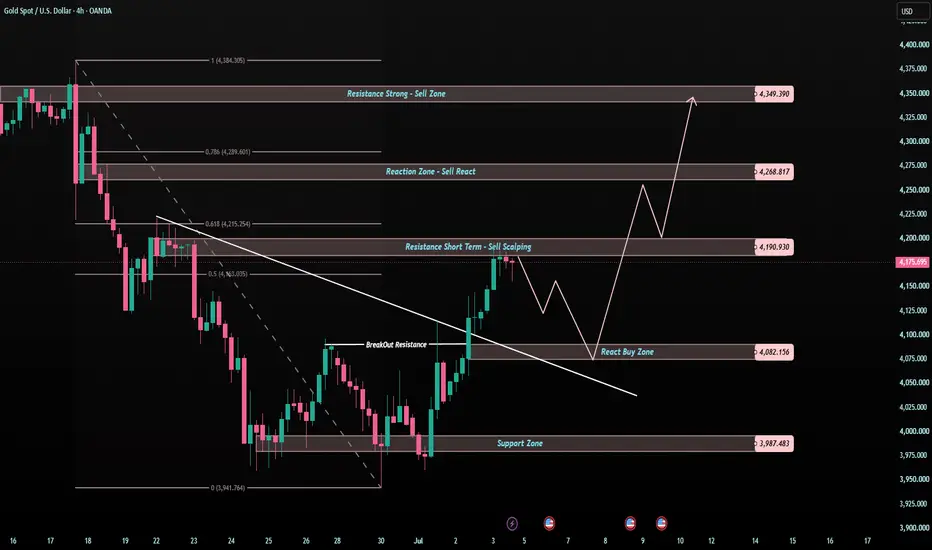
The Breakout Is Real, But the Market May Test Patience FirstXAUUSD — The Breakout Is Real, But the Market May Test Patience First
Gold has changed its short-term behaviour.
After several days of bearish pressure, price has finally broken above the descending trendline and is now pushing into the first resistance area around 4,190.
This is a positive sign for buyers.
But it is also a danger zone for traders who chase too late.
The market has already moved far from the lower support.
So now, the cleaner question is not:
“Should I buy now?”
The bett
Adani Energy Solutions: Multi-Year Breakout Signals new UptrendAdani Energy Solutions: Multi-Year Breakout Signals Potential Start of a New Uptrend ⚡📈
Adani Energy Solutions has finally broken above a multi-year consolidation range, a development that often marks the beginning of a sustained trending phase.
Key Observations
• Price spent nearly 2.5 years consolidating within a broad range, allowing supply to be absorbed.
• A decisive breakout above the range has shifted the long-term trend in favor of the bulls.
• The current consolidation near the highs
XAUUSD — Early Week Pullback Before Bullish Recovery
Gold is trading around $4,167 after recovering strongly from the lower liquidity area. Price is now testing the short-term descending trendline, so the market may first create a pullback before the next bullish continuation attempt.
From an SMC perspective, gold has already swept the lower liquidity twice and created a recovery structure from the bottom. The current move is approaching a trendline reaction area, so an early-week rejection is possible. However, as long as price holds above the
MASON XAUUSD – Gold Holds Bullish Structure At Weekly Open
XAUUSD is trading around 4,181 at the start of the week after holding above the recent breakout structure. Price remains inside the rising trendline channel and above the Ichimoku support area, so the short-term bias is still bullish.
The priority view remains buy on pullback, especially if gold retests the 4,172–4,177 buy order zone and continues to hold above the key support area.
Technical View
Gold is still showing a bullish structure after the strong recovery from the 3,960 area. The ma
NIFTY must close above 24500 for stronger upmove!!As we can see despite the break NIFTY opened with a gap ruining the structure due to which no continuation of upmove was seen. Now that we have close above the structure, we can expect NIFTY to stay bullish but we still have a major resistance and supply zone around 24500 levels which is also a psychological level. Hence as long as we can below that level we can expect NIFTY to remain volatile unless it closes above confirming the upmove so plan your trades accordingly and keep watching everyone
TATAELXSI: Descending Channel Meets 200-Month EMAOverview
Tata Elxsi — one of India's premium technology and design services companies — has been in a significant correction since its all-time high of ₹10,760 in 2021. On the Monthly timeframe, a clear Descending Channel has formed, and price is now approaching a critical confluence zone where the Channel Lower Band meets the 200 Monthly EMA at ₹3,283.
This analysis covers multiple timeframes to present a complete picture of where TATAELXSI stands structurally.
The Descending Channel — Monthly
DR REDDY'S | Ascending Triangle — Watch ₹1,415 BreakoutOverview
Dr. Reddy's Laboratories — one of India's leading pharmaceutical companies — is forming a well-defined Ascending Triangle on the Daily chart. Today's strong +2.11% session pushed price to ₹1,390, approaching the key resistance at ₹1,415, before closing at ₹1,374. The triangle structure remains intact and the breakout zone is approaching.
The Ascending Triangle
An Ascending Triangle forms when price makes higher lows (rising trendline below) while repeatedly testing a flat horizontal re
MASON XAUUSD – Gold Tests Trendline And Ichimoku Value Area
XAUUSD is trading around 4,175 after a strong recovery from the recent support zone. However, the bullish structure has not been fully confirmed yet because price is now testing the descending trendline and the Ichimoku value area.
For next week, the priority view is to watch for sell confirmation around the trendline resistance zone, especially if gold fails to break and hold above 4,187–4,198.
Technical View
Gold has recovered strongly from the 3,960 support area, but the current move is st
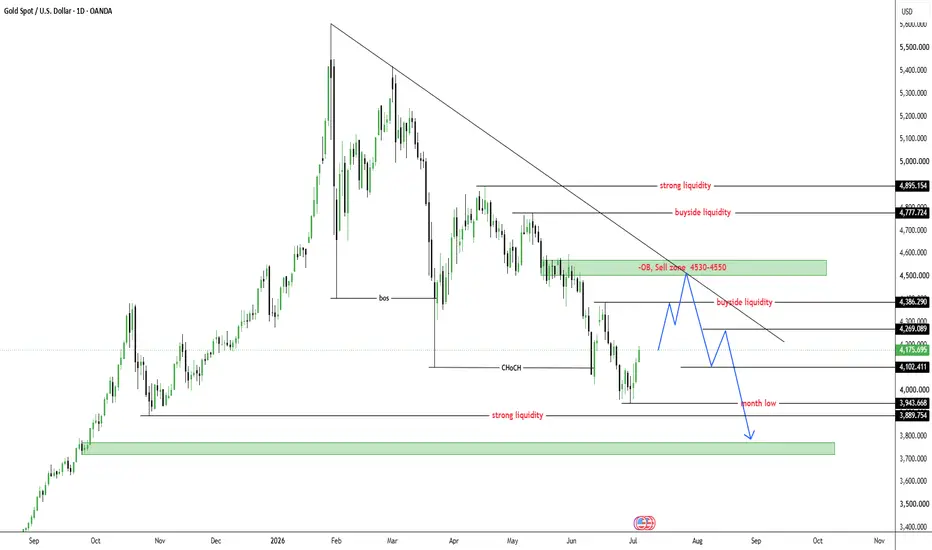
XAUUSD Weekly Recovery Pullback, Main Trend Still Under Pressure
Gold is trading around $4,175 after reacting from the lower support area near the monthly low. The short-term price action is showing signs of a corrective recovery, but the broader structure is still under pressure as price remains below the descending trendline and below the main OB sell zone.
From an SMC perspective, gold has already broken the previous bullish structure and formed a clear CHoCH to the downside. The recent rebound can be viewed as a pullback after a strong bearish leg, not
Banknifty Intraday Analysis for 03rd July 2026NSE:BANKNIFTY
The uptrend is expected to continue, however, profit booking is expected on a higher level.
The upward moment may lead the Index to 58700 – 58800 resistance range in upward momentum and if the index crosses and sustains above this level then may reach near 59500 – 59600 range.
On the contrary, a downward moment may drag the Index to 57300 – 57200 support range in downward momentum and if this support is broken then the index may tank near the 56500 – 56400 range.