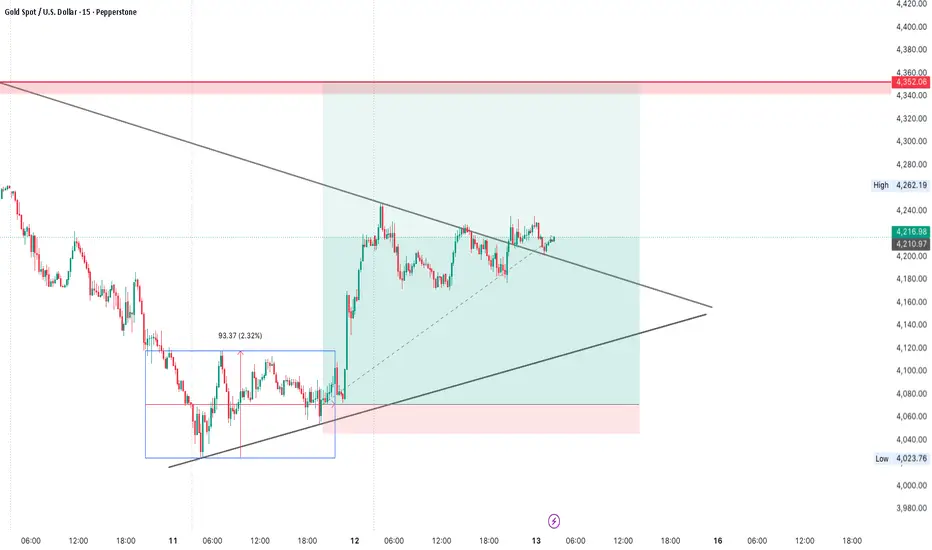
HOW-TO: Trade Gold & Silver with Auto Support/Resistance Levels This tutorial shows how to trade MCX Gold futures using auto-generated support/resistance levels. Current gold setup with clear entry, stop-loss, and target levels.
Markets: MCX Gold/silver Futures (or any commodity)
Timeframe: 15-minute chart
Understanding Auto Support/Resistance Indicator
The Auto S/R indicator generates key levels across multiple timeframes:
Intraday levels for day trading
Weekly levels for swing trades
Monthly levels for position trading
Why this helps: No need to man
Trend Lines
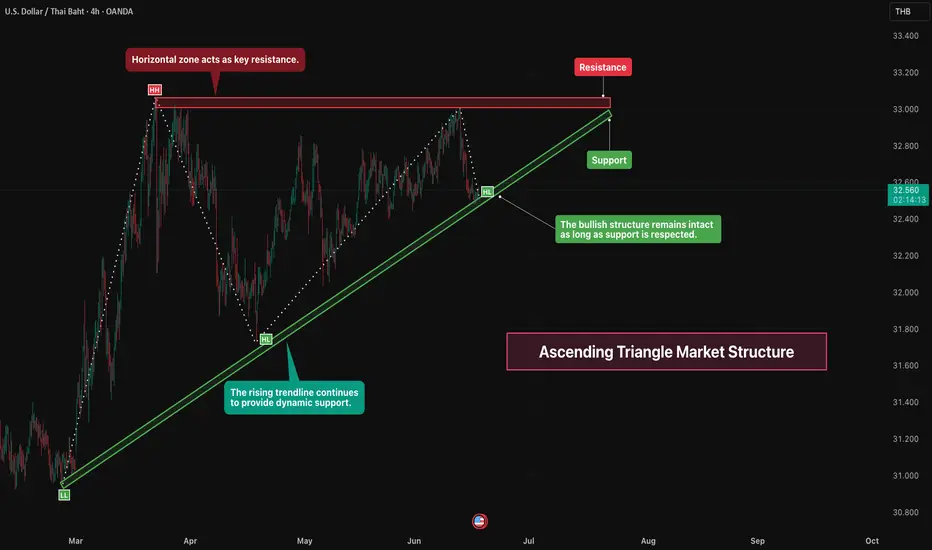
Ascending Triangle Market Structure🔺 Overview
This chart highlights an ascending triangle market structure, where price is trading between a rising support trendline and a horizontal resistance zone. The pattern reflects strengthening demand as higher lows continue to develop.
⸻⸻⸻⸻⸻⸻⸻⸻⸻
📈 Key Price Action
• Higher lows indicate sustained buying pressure.
• Price continues to respect the rising trendline support.
• Multiple tests of the resistance zone confirm its significance.
• The market remains compressed between support
Axis Bank: Analyzing the Current Triangle and Key LevelsAxis Bank is currently trading at 1,365.70 . Over the past few months, the price action has started to tighten significantly, moving into a well-defined technical range. By studying the chart structure and momentum, we can map out the two most likely paths ahead without bias.
The Chart Pattern: A Contracting Triangle
The structure starting from the peak of 1,418.30 looks like a classic contracting triangle. This pattern consists of five waves (A-B-C-D-E) that reflect a balance between buye
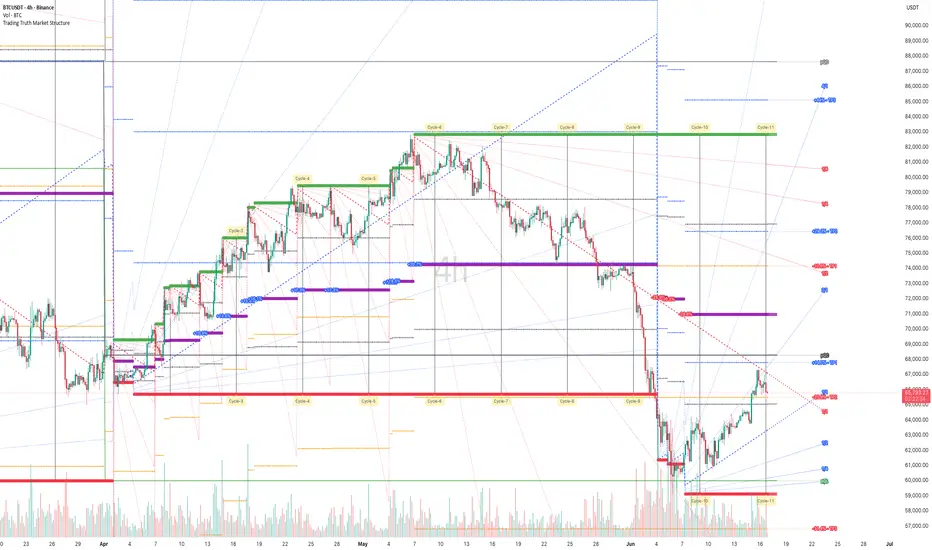
Bitcoin Analysis on 4h using Leading Indicator📊 BTCUSDT (4H Timeframe)
🔍 Analysis:
• Strong recovery from the Cycle-10 low after a capitulation selloff ✅
• Price is respecting the ascending 1x1 geometric angle support ✅
• Higher lows continue to form, showing improving market structure ✅
• BTC is currently testing a key confluence zone near the descending 1x1 resistance ⚠️
• Break above the descending geometric angle could trigger the next expansion leg 🚀
• HTF midpoint around 65,000 remains the critical battleground level 📐
• Time-cycle
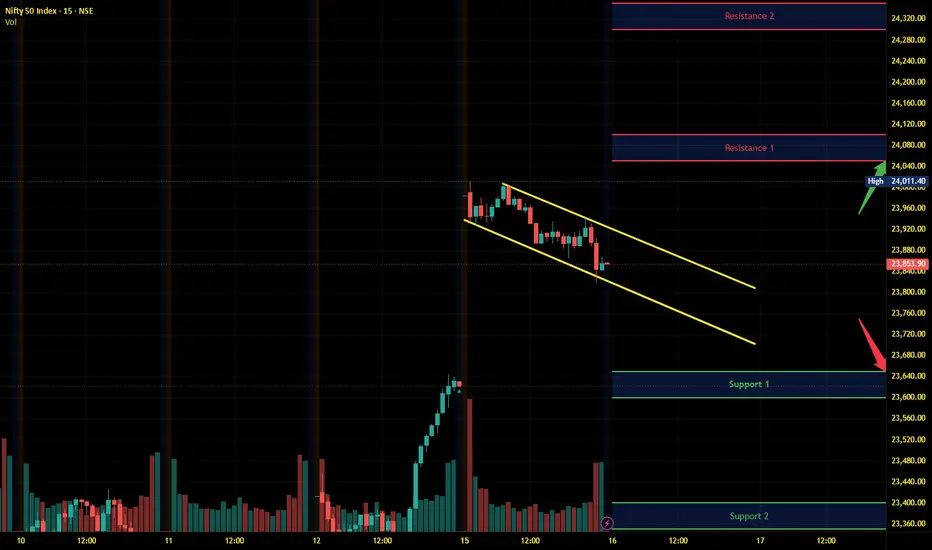
Nifty Intraday Analysis for 16th June 2026NSE:NIFTY
Overall market sentiment is positive as a consensus emerges regarding the signing of the US-Iran deal. However, volatility expected on weekly Option expiry day and 24000-24100 is emerging as major resistance.
The upward movement may lead to 24050 – 24100 resistance range and if the index crosses and sustains above this level then may reach near 24300 – 24350 range.
On the contrary, a downward moment may drag the Index to 23650 – 23600 support range in downward momentum and if
Banknifty Intraday Analysis for 16th June 2026NSE:BANKNIFTY
Overall market sentiment is positive as a consensus emerges regarding the signing of the US-Iran deal. The market is expected to bounce back if profit-taking drags prices down to key support levels.
The upward moment may lead the Index to 57900 – 58000 resistance range in upward momentum and if the index crosses and sustains above this level then may reach near 58700 – 58800 range.
On the contrary, a downward moment may drag the Index to 56500 – 56400 support range in downward
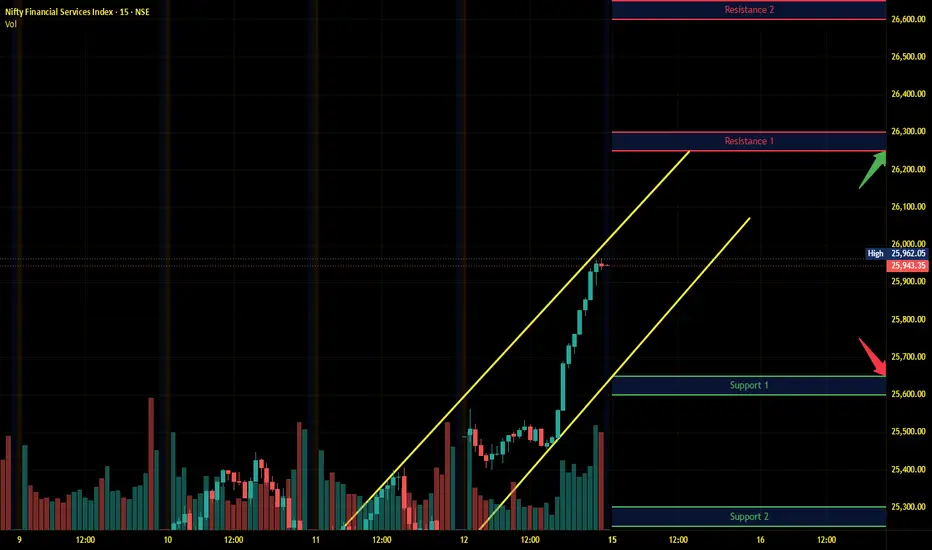
Finnifty Intraday Analysis for 16th June 2026 NSE:CNXFINANCE
Overall market sentiment is positive as a consensus emerges regarding the signing of the US-Iran deal. The market is expected to bounce back if profit-taking drags prices down to key support levels.
The upward movement may lead the Index to 26575 - 26625 resistance range and if the index crosses and sustains above this level then may reach near 26925 - 26975 range.
On the contrary, a downward moment may drag the to 25975 – 25925 support range and if this support too is brok
Midnifty Intraday Analysis for 16th June 2026NSE:NIFTY_MID_SELECT
Overall market sentiment is positive as a consensus emerges regarding the signing of the US-Iran deal. The market is expected to bounce back if profit-taking drags prices down to key support levels.
The upward movement may lead the Index near 14600 – 14625 resistance range and if the index crosses and sustains above this level then may reach 14800 – 14825 range.
On the contrary, a downward moment may drag the index to 14250 – 14225 support range and if this support is
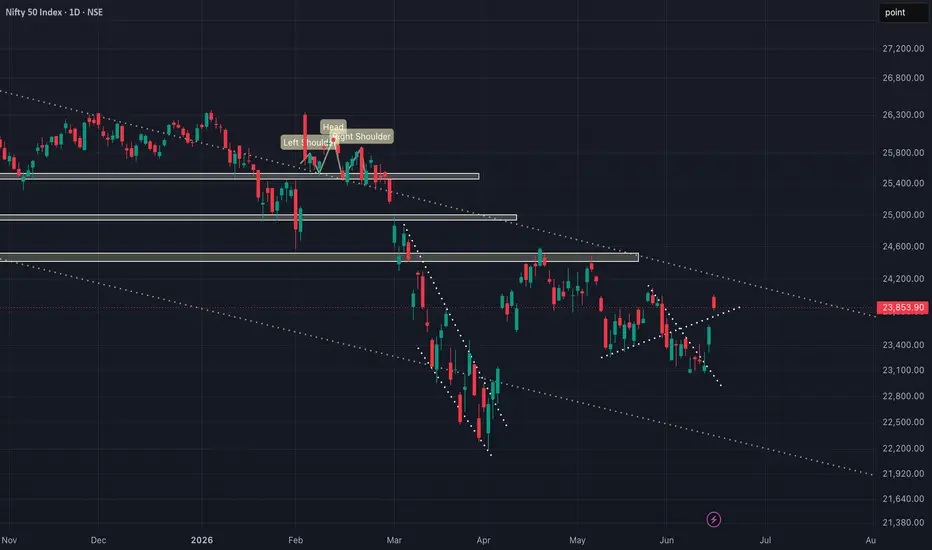
Nifty 1D Chart UpdateThe index has broken its trendline. Based on chart structure, a pullback toward the previous day’s candle high looks likely to fill the gap before the next move.
Watch this retracement zone closely for confirmation.
24,000 remains a major resistance level that could cap further upside.
Let’s observe how price reacts at these levels to gauge the next directional move.
Gold 4H Chart Update Price is currently testing a key zone. This level could act as a turning point:
If support flips into resistance, we may see rejection and downside movement.
If price breaks through resistance, it could open the path for bullish continuation.
Let’s watch closely how price reacts here for the next move.
The end of RUN! Resistance ahead !As we can see NIFTY is moving in GAPS, but we can expect NIFTY to remain sideways to volatile unless it breaks above previous daily mother candle's high and important psychological level of 24000. Additionally, we can see there are more resistances around 24250-24300 levels which would not let NIFTY remain bullish for a long time. Hence, we can expect NIFTY to remain sideways to negative between these levels until and unless it breaks above and sustains above given levels. So, plan your trades a
Nifty Intraday Analysis for 15th June 2026NSE:NIFTY
Progress in diplomatic talks between the US and Iran has boosted global market sentiment, paving the path for an upward trend which is expected to continue. However, if these negotiations fail to materialise into a formal agreement, markets could experience a sharp reversal.
The upward movement may lead to 23850 – 23900 resistance range and if the index crosses and sustains above this level then may reach near 24125 – 24175 range.
On the contrary, a downward moment may drag th
Banknifty Intraday Analysis for 15th June 2026NSE:BANKNIFTY
Progress in diplomatic talks between the US and Iran has boosted global market sentiment, paving the path for an upward trend which is expected to continue. However, if these negotiations fail to materialise into a formal agreement, markets could experience a sharp reversal.
The upward moment may lead the Index to 57400 – 57500 resistance range in upward momentum and if the index crosses and sustains above this level then may reach near 58100 – 58200 range.
On the contrary,
Finnifty Intraday Analysis for 15th June 2026 NSE:CNXFINANCE
Progress in diplomatic talks between the US and Iran has boosted global market sentiment, paving the path for an upward trend which is expected to continue. However, if these negotiations fail to materialise into a formal agreement, markets could experience a sharp reversal.
The upward movement may lead the Index to 26250 - 25300 resistance range and if the index crosses and sustains above this level then may reach near 26600 - 26650 range.
On the contrary, a downward mom
Midnifty Intraday Analysis for 15th June 2026NSE:NIFTY_MID_SELECT
Progress in diplomatic talks between the US and Iran has boosted global market sentiment, paving the path for an upward trend which is expected to continue. However, if these negotiations fail to materialise into a formal agreement, markets could experience a sharp reversal.
The upward movement may lead the Index near 14425 – 14450 resistance range and if the index crosses and sustains above this level then may reach 14625 – 14650 range.
On the contrary, a downward
SBI Life: Bullish Scenario - Wave (5) Targets ₹2400 – ₹2600
SBI Life appears to have completed a strong Wave (3) advance near ₹2150 after a five-wave structure. The ongoing decline is likely part of a corrective Wave (4) phase.
The stock is currently trading near the lower boundary of its long-term rising channel, which is acting as an important support zone.
A sustained move above ₹1950 may indicate the completion of the corrective phase and could lead to the start of Wave (5) . In such a case, the stock may move towards ₹2400–2600 over the
BUY TODAY SELL TOMORROW for 5%DON’T HAVE TIME TO MANAGE YOUR TRADES?
- Take BTST trades at 3:25 pm every day
- Try to exit by taking 4-7% profit of each trade
- SL can also be maintained as closing below the low of the breakout candle
Now, why do I prefer BTST over swing trades? The primary reason is that I have observed that 90% of the stocks give most of the movement in just 1-2 days and the rest of the time they either consolidate or fall
Trendline Breakout in MSTCLTD
BUY TODAY SELL TOMORROW for 5%
RESPITE as expected!As we can see NIFTY showed strong recovery which was well anticipated in our post which was due to US-IRAN negotiation. But, we can see NIFTY heading towards strong trendline resistance around 23750. So as long as we are below this level, we are still weak below that line technically. So, plan your trades accordingly and keep watching everyone.
Jay Bharat Maruti Ltd - Weekly ChartTechnical View
Jay Bharat Maruti has delivered a strong breakout above key resistance zone, supported by significant increase in trading volume the stock is currently trading at fresh multi-year highs, indicating improving momentum and renewed market participation. Sustaining above the breakout area will be crucial, as it can potentially transform the previous resistance into a strong support zone. The overall price structure remains bullish, characterized by higher highs and higher lows, whil
BTCUSD SHOWING A GOOD D UP MOVE WITH 1:10 RISK REWARD BTCUSD SHOWING A GOOD
UP MOVE WITH 1:10 RISK REWARD
DUE TO THESE REASON
A. its following a rectangle pattern that stocked the market
which preventing the market to move any one direction now it trying to break the strong resistant lable
B. after the break of this rectangle it will boost the market potential for break
C. also its resisting from a strong neckline the neckline also got weeker ald the price is ready to break in the outer region
all of these reason are indicating the same thing it
XAUUSD — EMA Bearish Trend, Sell From Fibonacci Value Zone
Fundamental Analysis
Gold remains under bearish pressure as the market focuses on key USD events this week, including the Federal Funds Rate, FOMC Economic Projections, FOMC Statement, and the FOMC Press Conference.
These events may create strong volatility for XAUUSD. If the Fed tone supports USD strength or keeps rate expectations tight, gold may continue to face selling pressure on recovery attempts.
Technical Analysis
On the 4H chart, XAUUSD is still moving inside a descending channel. EM
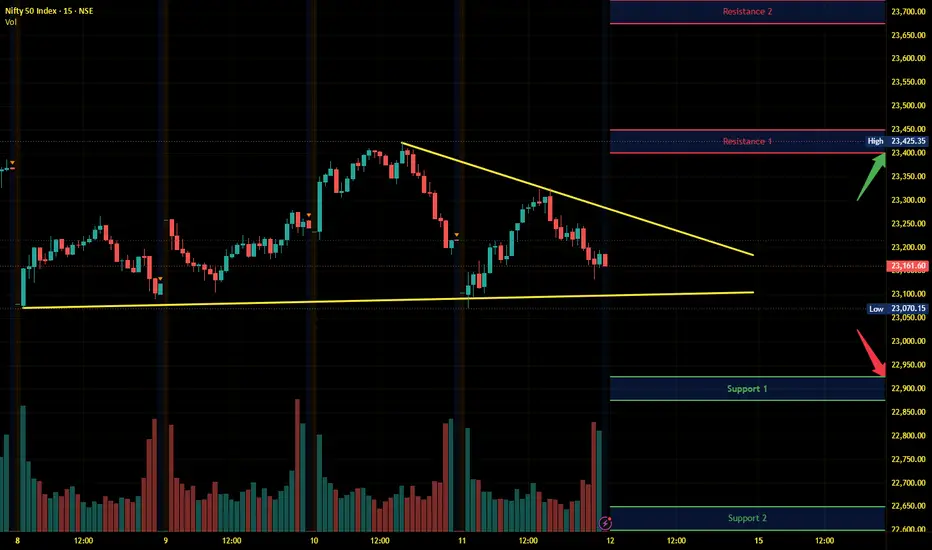
Nifty Intraday Analysis for 12th June 2026NSE:NIFTY
The proactive initiatives by the GoI and the RBI to attract FPIs have kept domestic sentiment positive. However, if the fresh escalation in the West Asia conflict persists, volatility is expected to continue, and the market will likely close in negative territory.
A downward moment may drag the Index to 22925 – 22875 support range in downward momentum and if this support is broken then index may tank near 22650 – 22600 range.
On the contrary, the upward movement may lead to 234