GANECOS: Trendline BO, Reversal Pattern, HWVE, Chart of the WeekGanesha Ecosphere Is About to Do Something It Has Never Done Before, and the Volume Proves It. Let's understand it in detail in the "Chart of the Week"
As per the Latest SEBI Mandate, this isn't a Trading/Investment RECOMMENDATION nor for Educational Purposes; it is just for Informational purposes only. The chart data used is 3 Months old, as Showing Live Chart Data is not allowed according to the New SEBI Mandate.
Disclaimer: "I am not a SEBI REGISTERED RESEARCH ANALYST AND INVESTMENT ADVISER."
This analysis is intended solely for informational purposes and should not be interpreted as financial advice. It is advisable to consult a qualified financial advisor or conduct thorough research before making investment decisions.
Price Action Analysis:
- Multi-year base zone: Horizontal demand zone (marked by the green) running from roughly ₹600 to ₹680. This zone acted as consolidation support as far back as mid-2022 and again served as a launch pad in early 2026, a classic multi-touch base.
- This base spans nearly 3.5 years of price memory, giving it exceptional structural validity. Every prior attempt to break it lower was rejected, confirming strong accumulation by informed participants at those levels.
- The recent swing low at ₹543 represents a brief undercut (a shakeout below the base), which in classical Wyckoff analysis is consistent with a "spring", a false breakdown designed to flush weak hands before a markup phase.
Technical Pattern:
- Descending broadening wedge / Falling channel: From the ₹2,484 peak, the stock carved out a well-defined falling channel (marked in yellow on the chart), with the upper resistance rail and a parallel lower support rail compressing price into a narrowing band. These channels typically resolve in a breakout in the direction opposite to the prevailing trend, in this case, bullish.
- Breakout confirmation: The most recent weekly candle has convincingly broken above the upper rail of this descending channel. The candle is a large-bodied bullish candle that engulfs multiple prior weekly candles, a classic breakout candle on a higher timeframe.
- The breakout candle closed at ₹1,110.15, well inside the channel rather than just touching the rail, which is a sign of genuine momentum and not a mere wick-based test.
Volume Spread Analysis:
- The weekly volume bar at the time of breakout printed 30.09 million shares, versus the 20-period average of just 2.45 million shares.
- That is approximately 12.3x the average volume, an extraordinary surge that is rarely seen at anything other than major inflection points.
- Volume is the fuel of a move. When price breaks a multi-month structure with 12x volume, it signals institutional conviction, not retail exuberance. Smart money does not accumulate quietly and then let retail break out; it breaks out itself.
- Historically, volume expansion of this magnitude on a weekly bar following a prolonged downtrend is one of the strongest reversal signals in technical analysis, akin to what Mark Minervini classifies as a volume dry-up followed by a volcanic explosion.
Support, Resistance, and Key Levels:
- Primary support (base zone): ₹600–₹680 (the green horizontal zone)
- Secondary support (recent breakout zone/channel upper rail): ₹900–₹950
- Immediate resistance: ₹1,200 — a psychological level and a prior area of supply visible in mid-2025 during the decline
- Major resistance: ₹1,400–₹1,500 — the mid-channel area from the prior rally
- Ultimate resistance (prior ATH zone): ₹2,400–₹2,484 — the previous high, which now represents the long-term target if the reversal thesis plays out
Sectoral Backdrop — Recycled PET / Circular Economy:
Regulatory Catalyst:
- The Government of India issued final guidelines mandating 40% recycled content in food-grade PET packaging effective from April 1, 2026, marking a significant step toward strengthening the country's circular economy framework.
- For rigid packaging, brand owners and packaging manufacturers have to ensure 30% of their packaging contains recycled plastics by 2026, rising to 40% by 2027, 50% by 2028, and 60% from 2029 onwards.
- Under the revised Plastic Waste Management (Amendment) Rules 2026, category-wise targets for recycled plastic usage have been introduced, with a phased increase over time, and the amendments also introduce enhanced compliance requirements, including mandatory labelling to indicate recycled content.
- This is a long-duration, non-cyclical regulatory tailwind that structurally forces demand for rPET — the exact product GANECOS manufactures. Unlike volume-driven demand cycles, compliance mandates create floor demand regardless of macroeconomic conditions.
Industry Size and Growth:
- Industry estimates suggest that 15–18 food-grade rPET recycling facilities have already been established across India, with a combined capacity of around 3 lakh metric tonnes and investments ranging between ₹9,000–10,000 crore.
- The industry has so far invested an estimated INR 75–80 billion in rPET infrastructure, with a planned capacity of 400,000 tonnes, of which 150,000 tonnes is already operational and authorised by FSSAI.
- The sector is structurally underpenetrated, given India's vast PET consumption, giving the leading recyclers a long runway for capacity-led growth.
Fundamental Backdrop:
Company Overview:
- Ganesha Ecosphere Limited primarily manufactures and sells recycled polyester staple fiber in India and internationally, offering rPET fibre in solid, hollow, conjugated, flame-retardant, short-cut, micro, and trilobal varieties.
- The company is the largest PET bottle recycling company in India, contributing to recycling over 16–18% of India's PET bottle waste, with 150,000+ MTPA of PET waste converted and 8+ billion PET bottles recycled in FY25.
Recent Financial Performance:
- Net profit of Ganesha Ecosphere declined 84% to ₹4.75 crore in Q3 FY26, while sales declined 10.20% to ₹357.22 crore versus ₹397.80 crore in Q3 FY25.
- Net profit fell to ₹0.50 crore in Q2 FY26, representing a near wipeout from the ₹27.11 crore earned in Q2 FY25.
- This earnings deterioration is the primary reason the stock corrected nearly 78% from its peak. The market was re-rating the business as margins compressed significantly. This is the fundamental backdrop that allowed the technical base to form.
Expansion Plans:
- The company has a ₹130 crore brownfield expansion and a ₹450 crore larger expansion planned, as revealed in the Q3FY26 earnings transcript.
- The company's foray into high-value plastics (HDPE, LDPE, PVC), technical and household textiles, and expanded bottle-to-bottle recycling, all of which carry superior margin profiles compared to standard rPSF.
Valuation and Risk Flags:
- The P/E ratio stands at 76.8x and P/B at 2.36x
- Promoters have pledged 29.8% of their holding, a non-trivial risk that warrants monitoring, as pledged shares can create forced selling pressure during downturns.
- The company has delivered a sales growth of only 10.5% over the past five years and has a low return on equity of 8.28% over the last 3 years. These are structural weaknesses that the new regulatory environment will need to meaningfully overcome for a sustained re-rating.
My 2 Cents:
- The technical breakout is clean, volume-confirmed, and occurs from a multi-year base — the three conditions I look for before calling a trend reversal with high conviction.
- The fundamental story has near-term earnings headwinds but an exceptionally strong long-duration regulatory tailwind. This creates the classic "bad news already in the price, good news coming" setup.
- The mandatory recycled content rules that went live on April 1, 2026, are a direct demand guarantee for GANECOS's core product, and the market has clearly front-run this development, as evident from the explosive volume.
- The promoter pledge and near-term earnings weakness are the two primary risks to monitor closely.
Full Coverage on my Newsletter coming next week.
Keep in the Watchlist and DOYR.
NO RECO. For Buy/Sell.
📌Thank you for exploring my idea! I hope you found it valuable.
🙏FOLLOW for more
👍BOOST if you found it useful.
✍️COMMENT below with your views.
Meanwhile, check out my other stock ideas on the right side until this trade is activated. I would love your feedback.
As per the Latest SEBI Mandate, this isn't a Trading/Investment RECOMMENDATION nor for Educational Purposes; it is just for Informational purposes only. The chart data used is 3 Months old, as Showing Live Chart Data is not allowed according to the New SEBI Mandate.
Disclaimer: "I am not a SEBI REGISTERED RESEARCH ANALYST AND INVESTMENT ADVISER."
This analysis is intended solely for informational purposes and should not be interpreted as financial advice. It is advisable to consult a qualified financial advisor or conduct thorough research before making investment decisions.  Long
Long
 Short
Short
XAUUSD loses momentum as rate-cut expectations fade
Gold is starting to lose upside momentum after the latest spike into the wave 5 high, and the current pullback now looks more than just a small intraday pause.
The latest shift in macro sentiment matters here.
After Trump’s recent comments, market pricing for a Fed rate cut before December dropped sharply, and that change is helping the dollar regain some support. For gold, that reduces part of the easing-driven tailwind and makes the current correction more technically meaningful.
For Kelly, this is no longer a chart in clean expansion mode.
It is a chart moving from impulse into correction.
Technical structure
From the chart, gold had been trending higher along the rising trendline and eventually completed a strong upside leg into the 4800 area, where the projected wave 5 top formed.
That top is important because price did not consolidate there for long.
Instead, it rejected quickly and dropped straight back into the lower structure, which is usually the first sign that the market is shifting from trend continuation into retracement.
The current selloff has already pushed price back under the immediate recovery shelf, and the market is now sitting near the first reaction band around 4555.
Below current price, the chart shows two key downside layers:
4520 area as the first short-term support / reaction zone
4482 support strong as the more important structural floor
If those levels fail to hold, the correction can extend toward the lower target area around 4280.
What the chart is saying
The move down from the top is not random.
It came after a completed upside sequence, a sharp rejection from the high, and a breakdown back through the rising support structure.
That usually tells us the market is no longer being driven by fresh upside momentum.
Instead, it is starting to rebalance and test how much of the prior rally can actually hold.
The 4655–4650 sell zone now becomes the first important ceiling.
If gold tries to rebound, that is the area where sellers may re-enter and defend the new lower-high structure.
As long as price remains below that zone, the current path still favors a broader correction rather than an immediate recovery back to the highs.
Kelly’s trade map
For Kelly, this is a correction-first chart unless buyers can reclaim lost structure quickly.
There are two scenarios that matter:
Bullish stabilization scenario
If gold holds around 4520 or 4482 and responds with stronger buying pressure, the market may try to build a temporary base before any deeper decline.
But even then, buyers still need to recover above 4650–4655 to weaken the current bearish pressure.
Bearish continuation scenario
If price fails to hold the first support band and rebounds remain capped below the sell zone, the chart opens more naturally toward the 4280 target area.
That would fit the idea of a broader correction after the completed wave structure at the top.
Kelly’s read
The key difference now is that gold is no longer trading as a momentum breakout chart.
It is trading as a post-expansion correction chart.
The fading rate-cut narrative gives this pullback more room to breathe, while the technical picture supports the idea that the market is unwinding after a completed upside sequence.
For Kelly, the focus is no longer on chasing strength.
It is on watching whether support can absorb the correction — or whether the loss of momentum turns into a deeper structural retracement.
Conclusion
Gold is correcting after a completed upside leg, and the latest macro shift is adding pressure to that retracement.
As long as price remains below 4650–4655, the chart stays vulnerable to further downside, with 4520 and 4482 as the first key supports, and 4280 as the deeper target if the correction expands.
The rally has already done its job — now the market is deciding how deep the reset needs to be.  Short
Short
Gold Stays Heavy Under Dollar PressureGold Stays Under Pressure as Dollar Strength Keeps the Medium-Term Bias Heavy
Gold remains in a fragile medium-term structure after the latest sharp selloff, with price still struggling to rebuild above key recovery levels.
The broader tone has turned heavier as the US dollar continues to recover, while spot gold has already seen a deep intraday drop, showing that defensive demand is being outweighed by macro pressure for now.
Trend Pulse
From a structural point of view, the chart still favours weakness.
The recent rebound from the lower zone is only a corrective recovery at this stage, not a confirmed bullish reversal. Price is holding above the immediate base for now, but it is still trading below the stronger overhead resistance cluster.
The wave structure on the chart also suggests that gold may still be working inside a broader bearish sequence, with the current bounce behaving more like a temporary recovery before the next major decision.
Key Price Territories
The technical map is quite clear here:
Immediate reaction level: around 4,587
First resistance: 4,530 - 4,588
Buy-zone liquidity: around 4,380 - 4,400
Deeper buy scalping zone: near 4,097
Psychological medium-term support: around 3,700
As long as price remains below the upper recovery zone, rallies may continue to face selling pressure.
If the market loses the 4,380 - 4,400 area again, then the structure opens the door for a deeper move toward 4,097, with the broader downside path still exposing the 3,700 region in the medium term.
Fundamental Layer
The macro backdrop is now adding pressure to gold rather than helping it stabilise.
The US dollar index has pushed back above the key psychological area, and that creates a more difficult environment for precious metals. At the same time, a sharp decline in spot gold shows that the market is not yet in a stable accumulation phase. Instead, capital is still reacting to stronger dollar momentum and a firmer macro tone.
In simple terms, the dollar recovery is reducing gold’s upside flexibility and making rebounds less convincing.
Structure Read
This is the key Jasper view:
Gold is not in a clean recovery trend yet.
It is in a bearish medium-term structure with corrective rebounds.
That means upside moves can still happen, especially into local resistance, but those rallies should be treated carefully unless price can reclaim the higher resistance band with strong follow-through.
For now, the market still looks more likely to:
rebound into overhead supply,
fail to sustain strength,
and remain exposed to another leg lower if support gives way again.
Jasper’s Take
Gold is trying to stabilise, but the broader medium-term picture still leans bearish while the dollar remains firm.
Resistance: 4,530 - 4,588
Buy-zone liquidity: 4,380 - 4,400
Deeper support: 4,097
Psychological downside zone: 3,700
The clean read here is simple:
gold may still produce short-term rebounds, but unless buyers reclaim higher resistance properly, the medium-term structure continues to favour downside pressure. Short 
XAUUSD — Triangle Break Favors 4830XAUUSD — Triangle breakout opens room for a wave 5 push toward 4830
Gold is starting to regain momentum after breaking out of the recent triangle structure, and that changes the short-term tone of the chart in an important way.
What had been a compressed phase is now turning into expansion.
For Kelly, this matters because triangle breaks often act as the final release point before the market pushes into the last leg of a broader move. In this case, the current breakout supports the idea that gold may be entering wave 5 higher, with the next objective sitting around 4830.
Technical structure
The chart had been trading inside a tightening triangle, showing hesitation after the previous advance.
That kind of pattern usually reflects temporary balance between buyers and sellers before the market chooses direction.
Now that price has pushed out of that compression, the structure becomes more constructive for the upside.
There are three technical reasons this breakout matters:
price has cleared the upper boundary of the triangle
the market is no longer respecting the short-term compression range
momentum is beginning to shift from consolidation back into expansion
This tells us the pause may be finished, and the next directional leg is starting to build.
Wave development
From a wave perspective, the recent triangle can be read as a consolidation before the final leg of the sequence.
That keeps the current move aligned with a possible wave 5 continuation.
If that read remains valid, then the breakout is not just a short-term bullish signal.
It becomes the trigger that suggests the market may now be moving into the final upside extension of the current structure.
The next upside target sits around 4830, which stands out as the projected completion zone for this wave path.
What matters next
For Kelly, the key is not to focus only on the breakout candle itself.
The more important question is whether price can hold above the broken triangle boundary and keep building from there.
If buyers defend the breakout area on any retest, the structure remains supportive of continuation higher.
That would keep the path open toward 4830.
If price falls back into the triangle and loses the breakout area too quickly, then the move would lose quality and the bullish wave count would become less reliable.
But for now, the market is still behaving like a breakout rather than a failed push.
Kelly’s read
This is a cleaner chart than before.
The triangle phase showed compression, but the breakout shifts the market back into directional mode.
For Kelly, this is the kind of setup where structure should lead the view.
As long as the breakout holds, gold still has room to continue higher and complete the final leg of the current bullish sequence.
Conclusion
Gold is breaking out of the triangle, and that opens the door for a wave 5 extension toward 4830.
The structure now favors continuation higher as long as price stays above the breakout base and avoids falling back into compression.
The triangle pause may be over — and gold now has room to finish the next upside leg. Long 
 Long
Long
XAUUSD Rebounds From FVG as Risk Sentiment Turns Supportive Gold Rebounds From FVG as Risk Sentiment Turns Supportive
Gold is trying to extend its recovery after reacting cleanly from the lower FVG demand zone, and the current structure suggests that buyers are beginning to regain short-term control.
After the sharp selloff earlier in the week, price found support around the 4,280 - 4,350 region and has now started rotating higher. The rebound is becoming more meaningful because it is no longer just a random bounce from oversold conditions. It is now building through structure, with a rising reaction leg and clear upside targets already coming into focus.
Trend Pulse
The chart shows that the market has shifted from liquidation into recovery.
The first important clue is the response from the lower FVG zone, which acted as a clean demand pocket and stopped the previous decline.
The second clue is the rising corrective leg now forming on the right side of the chart, with price holding above the short-term support base and pushing into the upper reaction area.
That does not mean gold has fully reversed the broader structure yet.
But it does suggest that the current phase is no longer dominated by straight-line weakness. Buyers are starting to build a recovery path.
Key Price Territories
The structure is fairly clear here:
Major support / FVG zone: 4,280 - 4,350
Secondary support: around 4,194
Current reaction area: around 4,490
First upside target: 4,602
Higher target: 4,678 - 4,679
As long as price remains above the current FVG support zone, the recovery structure stays active.
The nearest upside objective is the 4,602 level, and if momentum continues building, gold may extend further toward the 4,678 resistance zone.
Structural Read
This chart has started to show an important shift in behaviour.
Previously, gold was trading in a heavy decline with repeated downside breaks.
Now the market is reacting differently:
support is holding more cleanly
pullbacks are becoming more contained
price is beginning to climb through a short-term rising path
That tells us the market may be entering a corrective recovery phase, with the potential to retrace a larger portion of the previous selloff before the next major decision point appears.
Fundamental Layer
The broader backdrop can also help this rebound stay supported.
When market uncertainty remains elevated, gold tends to attract defensive flows.
At the same time, after a strong decline, any easing in immediate selling pressure can allow the metal to recover more sharply as traders rebalance positioning.
This is why the current technical rebound matters.
It is not just a local reaction from support. It is also happening in a backdrop where sentiment can still favour safe-haven demand if risk conditions remain unstable.
Jasper’s Take
Gold is reacting well from the lower FVG demand zone, and the current structure supports a continued recovery while price stays above the 4,280 - 4,350 base.
Support: 4,280 - 4,350
Deeper support: 4,194
First target: 4,602
Next target: 4,678 - 4,679
For now, the clean read is simple:
gold has shifted from selloff to recovery, and as long as support holds, the rebound still has room to expand higher. Long 
NIFTY CRASH TO 18500!!!I know what I'm going to say is huge and people might be mocking at this. This may or may not be right, but according to the chart, according to the trend line. That is broken right now in the Nifty. If you see in that chart, Nifty has given a breakdown of the trend line on a weekly or monthly basis, this is not something good at the given current geopolitical situation right now, and currently the Nifty is racing towards 18500 or 18800 levels, and these levels are to be achieved as far as the treandline breakdown is to be considered because that is the nearest support that we might get in Nifty after the 22000 levels are being broken, but the scary part is not just that if it. If it breaks the 18500 levels, then it might even go to 12000 levels 12 to 13000 levels. And this will occur only in the case of major geopolitical escalation that is, China, capturing of Taiwan or any other such big events. This may not happen if all the current situation that is us, Iran war goes into silence, if this Solved, then this might not occur, but according to the trend line, it might be giving us future prediction of the Nifty, along with the world geopolitical situation where it is heading towards, you can refer to the post about the geopolitical angle, which I have covered it in the previous post.  Short
Short
XAUUSD Rebounds From OB, but the Real Test Is Higher
Gold has started reacting from the OB buy zone, showing that selling pressure is no longer moving in a straight line.
After the recent flush into the 4,340 - 4,400 area, price is beginning to build a corrective rebound, but the broader structure is still not fully repaired.
Trend Pulse
The current reaction is technically valid because demand has responded from a key lower zone.
Still, the larger trendline structure remains in place, which means this move should be treated as a recovery leg first, not a confirmed bullish reversal.
As long as price holds above the current buy zone OB, the rebound path remains active.
Key Price Territories
Buy zone OB: 4,340 - 4,400
Preferred buy area: around 4,390
Current reaction area: 4,440 - 4,460
Buy retest zone: 4,540 - 4,580
Major overhead resistance: 5,150 - 5,200
Recent low: 4,100
The market is now trying to rotate upward from support, and the first important test sits around 4,540 - 4,580.
If price can build acceptance there, the rebound may extend further into the upper supply zone.
Fundamental Layer
The latest geopolitical tone is adding another layer of uncertainty to the market.
When tension around Iran rises again, gold can continue attracting defensive flows in the short term, especially after a sharp selloff.
That supports the rebound idea, but it does not automatically change the broader structure.
The market still needs to prove itself at higher resistance.
Trade Scenario
One actionable zone to monitor is 4,390, which sits inside the current OB demand area.
If price revisits this level and shows a stable reaction, it may offer a cleaner buy-from-support scenario for a corrective push higher.
In that case, the first upside focus remains 4,540 - 4,580, while a stronger continuation could open the way toward the higher resistance band.
But if 4,390 fails to hold cleanly, then the rebound structure weakens and the market may slip back toward the lower base before any stronger recovery can develop.
Jasper’s Take
Gold is reacting well from the lower OB demand zone, and that keeps the corrective upside path open.
But the bigger structure is still only in recovery mode for now.
Buy zone: 4,340 - 4,400
Preferred reaction level: 4,390
Retest zone: 4,540 - 4,580
Major resistance: 5,150 - 5,200
The clean read here is simple:
support has reacted, 4390 is a key buy-watch area, rebound is active, but the real decision comes higher. Long 
XAUUSD: New Bearish Leg in FocusXAUUSD: Recovery appears complete as gold resumes the next bearish leg
Hello everyone, here is my view on the current XAUUSD setup.
Market Analysis
Gold remains under pressure and the latest price action suggests that the recent recovery phase has already ended. Instead of developing into a broader reversal, the rebound was rejected inside overhead supply, and price is now starting to roll over into a new bearish leg.
From the chart structure, XAUUSD is still trading inside a medium-term descending channel, with the main trendline continuing to cap upside attempts. This keeps the broader market tone negative, even though short-term rebounds may still appear along the way.
The current rebound zone has already been tested, and price is now reacting below the 4440–4500 area. This region is important because it acts as a sell zone, where liquidity and previous resistance are overlapping. As long as gold stays below this supply area, sellers remain in control and the downside continuation scenario stays valid.
Higher up, the next notable resistance comes in around 4600–4620, which is another overhead supply zone and could serve as an additional sell area if price makes a deeper corrective bounce. On the downside, the 4300 area remains the first important liquidity zone to watch, while the broader bearish extension still points toward 4134 if momentum continues to build.
What matters most here is that gold has not broken the descending trend structure. Price is still trading below the major falling trendline, which means rallies should still be treated cautiously and mainly as opportunities for sellers to reposition.
Key Price Areas to Watch
Current price area: around 4442
Primary sell zone: 4440–4500
Secondary resistance / supply zone: 4600–4620
Liquidity support below: around 4300
Main bearish target: around 4134
My Scenario & Strategy
My preferred view is that the recent rebound has already completed, and gold is now starting a new move lower within the broader bearish structure.
As long as XAUUSD remains below the 4440–4500 resistance zone and continues trading under the descending trendline, I still favor selling rallies rather than looking for aggressive long positions. If price continues to weaken from this area, the first downside objective comes in around 4300. If bearish momentum expands further, the market may extend toward 4134.
If a deeper correction happens first, the 4600–4620 zone would become the next area to monitor for bearish rejection. Only a strong recovery above the main resistance structure would weaken the current bearish continuation view.
That’s the setup I’m watching for now. Thank you for reading, and always manage your risk carefully. Short 
XAUUSD — Gold is still in wave 2 recoverywhile the bigger impulsive leg has not started yet
Gold is continuing to recover from the recent low, but the current move is better read as a wave 2 rebound rather than a full bullish expansion.
That distinction matters, because wave 2 usually carries a corrective character: price can recover with decent momentum, but the move is still vulnerable until the next impulsive leg confirms itself.
For Kelly, this is an important stage.
The market is no longer collapsing, but it is not yet in the strongest part of the upside sequence either. What we are seeing now is a recovery structure trying to build a base before the next real decision point.
Technical structure
The sharp reaction from the lower buy liquidity zone around 4400–4420 created the first shift in short-term tone.
From there, gold established a recovery path with higher lows and started rotating back into the 4550–4560 retest liquidity area, which is now acting as the immediate support base for the current rebound.
This zone is important because it sits right under current price and represents the area buyers need to defend if the recovery is going to stay valid.
As long as gold continues to hold above this base, the corrective rebound in wave 2 remains intact.
Above the market, the next technical layers are clearly visible:
4690–4710 OB sell zone as the first major resistance
4900–4950 FVG as the next upside inefficiency area
5200 higher-timeframe OB as the larger medium-term reference if the recovery expands further
So structurally, price has room to continue higher in the short to medium term, but the market is still traveling through resistance overhead, which is why the current move should not yet be treated as a completed bullish reversal.
Wave count and market logic
From an Elliott-style view, the current recovery is more consistent with wave 2.
The reason is that the rebound is happening after a deep selloff and is now retracing back into prior imbalance and supply. That is typical wave 2 behavior:
price recovers from exhaustion, corrects part of the decline, and tests whether the market is ready to transition into a stronger leg later.
At this point, wave 2 can still continue stretching higher as long as price keeps respecting the recovery base.
That opens the way for a push toward the 4690–4710 OB zone, where the chart is more likely to face a meaningful decision.
Only after price proves it can move cleanly through those upper resistance layers would the case for a broader impulsive leg become stronger.
Until then, the current rebound should still be treated as a corrective build-up phase rather than a confirmed breakout sequence.
Why gold is still supported fundamentally
Gold is also not cooling off easily in the current environment.
War-related uncertainty and persistent inflation risk are both helping to keep the metal supported on dips.
That does not mean price can only move in one direction, but it does explain why the market is able to recover from liquidity zones instead of staying under heavy pressure for long.
In other words, the macro backdrop is helping the technical recovery stay alive while the chart builds through wave 2.
For Kelly, this combination matters.
When technical recovery aligns with a market environment that still favors defensive demand, the path of least resistance in the near term can remain to the upside — at least until the chart reaches stronger supply.
What matters next
The immediate focus is still on how gold behaves around the current 4550–4560 support-retest zone.
If price continues to hold there and prints another constructive push higher, then the next likely destination remains the 4690–4710 OB sell zone.
That is the first area where wave 2 may begin to slow down or meet heavier resistance.
If buyers manage to break above that zone with stronger follow-through, then the larger 4900–4950 FVG becomes the next technical magnet.
That would still fit the idea of wave 2 extending further before the market decides whether it is ready for the next major rotation.
On the downside, a loss of the current retest base would weaken the quality of the rebound and suggest that wave 2 is failing to mature properly.
But right now, the chart still favors continuation of the recovery phase rather than immediate rejection.
Kelly’s read
For Kelly, this is not a sell structure anymore, but it is also not yet the strongest bullish phase.
The better interpretation is that gold is in a corrective recovery wave, with price still trying to climb toward overhead inefficiencies and supply.
That means the chart deserves patience.
There is enough structure to respect the upside, but not enough yet to call it a full impulsive breakout.
As long as price holds above the current base, the market can continue working higher through wave 2.
The real test will come later, when gold reaches the OB sell zone and the upper FVG. That is where the next higher-timeframe decision will likely be made.
Conclusion
Gold is still in wave 2 recovery, and the current structure supports further upside as long as the 4550–4560 retest zone continues to hold.
The first major target remains the 4690–4710 OB zone, with room toward 4900–4950 if the rebound extends further.
For now, the market is not yet in wave 3 acceleration.
It is still building through the corrective phase — and that means the recovery can continue, but the strongest bullish leg has not started yet.
Gold is recovering with structure, but the real expansion still needs to be earned. Long 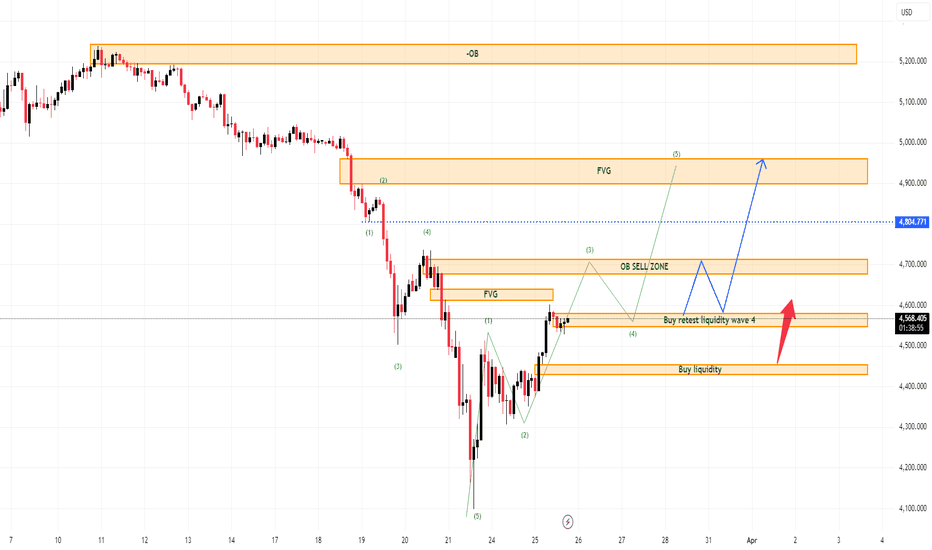
XAUUSD- Tries to Rebuild After the FlushGold Tries to Rebuild After the Flush, but Overhead Supply Still Holds the Key
Gold is attempting to recover after the recent liquidation move, with price reacting from the lower demand zone and starting to form a short-term rebound structure.
The chart is no longer in free fall, but it is also not in a confirmed reversal yet. For now, this still looks more like a recovery leg inside a damaged broader structure.
Trend Pulse
The broader structure remains heavy even though price has bounced from the recent low near 4,100.
What matters now is the reclaim path.
Gold is trying to rotate higher from the buy zone / OB around 4,380 - 4,420, but the market still faces a major descending trendline and multiple overhead supply layers.
That means the rebound can continue, but it must prove itself through resistance rather than simply by holding the low.
Key Price Territories
The chart now shows a clear roadmap for next week:
Immediate support / buy zone: 4,380 - 4,420
Current recovery pivot: around 4,550
First reaction resistance: 4,680 - 4,700
Higher resistance / liquidity zone: 5,150 - 5,200
As long as price holds above the recent reaction base, the market can continue building a corrective rebound.
But the real test sits higher, where previous sell-side liquidity and the descending trendline begin to overlap.
Macro Layer
The headline around the ECB is the kind of trigger that can immediately pull attention back to gold, because any renewed inflation scare or tighter policy expectations can reprice risk sentiment across markets.
That said, the official ECB communication available publicly does not show a pre-commitment to hike in April. Its recent messaging remains data-dependent and meeting-by-meeting, not a fixed promise of immediate tightening.
So for gold, the real implication is less about a guaranteed policy move and more about headline-driven volatility. If markets interpret the inflation backdrop as more dangerous, gold can attract flows on uncertainty. But if tighter-rate expectations dominate, upside can become less clean and more corrective. That fits the current chart well: rebound potential exists, but overhead resistance still matters more than the first bounce itself.
Structure Read
This is the key shift on the chart:
after a violent breakdown, price has moved into a reaction-from-demand phase.
That usually creates one of two outcomes:
a deeper recovery into overhead supply
or a weak bounce that fails under trendline resistance before the broader downtrend resumes
For now, the path drawn on the chart supports the idea that gold may continue recovering first, especially if political instability and inflation anxiety keep traders defensive. But unless price starts accepting above the higher resistance band, the move still reads as a rebound, not a fully restored uptrend.
Jasper’s Take
Gold has room for a stronger rebound after the recent flush, especially with the market reacting from a clear demand zone and with macro headlines adding fresh uncertainty.
But structurally, the chart is still not cleanly bullish.
The medium-term read is:
support has reacted
recovery is possible
but the real decision sits higher near overhead supply
Main levels to watch:
Buy zone: 4,380 - 4,420
Pivot: 4,550
Resistance: 4,680 - 4,700
Major upside test: 5,150 - 5,200
For now, gold looks like a market trying to recover from capitulation, not a market that has fully reversed trend.
The next real clue will come from how price behaves once it pushes into the upper liquidity zones. Long 
XAUUSD - Downtrend Prevails in the Long TermGold Remains in a Strong Downtrend as EMA Expansion Confirms Selling Pressure
Gold is still trading inside a clean bearish structure, and the current chart continues to support downside continuation rather than any meaningful reversal.
The most important signal here is the behaviour of the EMA ribbon.
The EMA 34, 89 and 200 are all opening wider and sloping lower, which shows that bearish momentum is not only active, but also expanding. This kind of alignment usually reflects a market where sellers remain in control and rebounds are more likely to be corrective than trend-changing.
Trend Pulse
Price is now moving well below the main EMA structure, while each lower high continues to form under dynamic resistance.
That tells us two things:
the market is respecting the bearish trend properly
upside reactions are still weak and being sold into
As long as gold remains below the descending EMA layers and below the marked sell zones, the cleaner side of the market still favors selling pressure.
Key Price Territories
The chart highlights two important overhead reaction levels:
First sell zone: around 4,318
Higher sell zone / resistance test: around 4,502
These are the main areas where rebound attempts may start losing strength again if price rotates upward for a retest.
On the downside, the broader weekly demand area remains much lower near the 3,900 region, which is also marked as the long-range swing buy zone on the chart. That means the current bearish leg may still have room to travel if momentum remains heavy.
Structure Read
This is not a chart showing balance.
This is a chart showing trend continuation.
The recent selloff is aggressive, the EMA ribbon is widening, and the market is still printing weak recovery attempts instead of stable accumulation. In this kind of environment, chasing upside too early becomes much riskier than waiting for price to retrace into resistance and following the dominant direction.
There is also a broader market logic behind this move.
When gold starts trending down this sharply, part of the capital that was parked in defensive positioning can begin rotating elsewhere, which reduces the strength of short-term recovery attempts and keeps pressure on the metal.
Jasper’s Take
Gold is still in a strong bearish phase, and the EMA expansion confirms that the trend remains healthy to the downside.
Trend bias: bearish
Sell zones: 4,318 and 4,502
Broader downside objective: near 3,900
For now, the cleanest approach remains the same:
favor sell-side setups on rebounds rather than trying to catch an early bottom.
Unless gold can reclaim the upper resistance layers with strong acceptance, the broader structure still points to continued weakness. Short 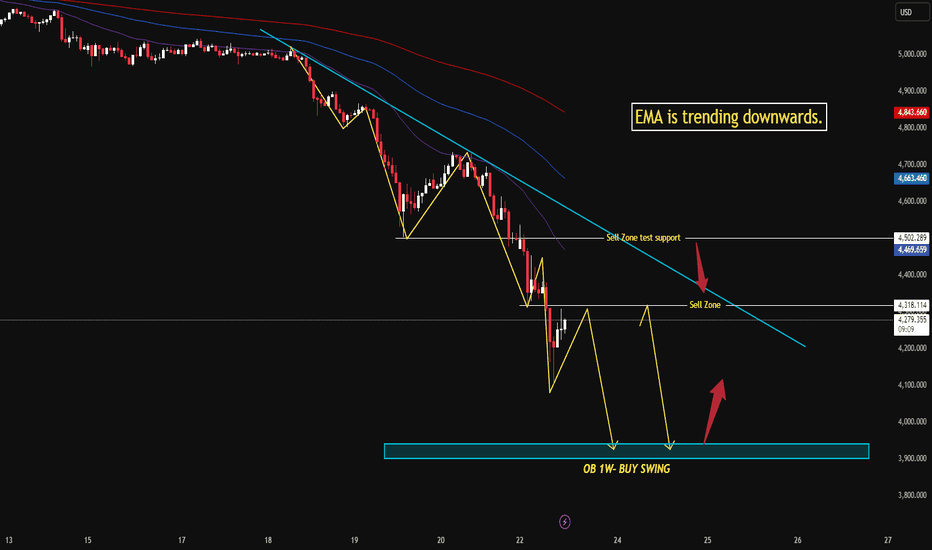
XAUUSD — Liquidity Retest in FocusXAUUSD — Retest Zone
Gold is trying to stabilize after the sharp breakdown, but the broader tone is still fragile.
The macro backdrop remains supportive for the USD as risk aversion returns, while higher oil prices and bond yields continue to limit room for a clean recovery in gold.
Technical structure
The key change on this chart is the break below the rising channel, which clearly damaged the previous bullish structure.
Since that breakdown, price has been reacting from the 4575–4595 area, marked as the nearest liquidity retest zone.
This zone may still produce a short-term bounce, but from a structural point of view, the market is still trading below the heavier overhead supply.
That means the current reaction is still a retest attempt, not yet a confirmed reversal.
The stronger liquidity sits much higher, around the 5000 area.
As long as gold remains below that supply band, the broader structure stays vulnerable.
Key zones
4575–4595: nearest liquidity retest / potential rebound area
5000 area: major overhead supply and stronger liquidity barrier
Kelly’s trade map
For Kelly, the main question is whether the 4575–4595 zone can create enough response to rebuild momentum, or whether the bounce will fade before reclaiming structure.
If buyers defend this zone well, gold may still produce a corrective rebound from current levels.
But unless price can push back into higher liquidity and hold above it, that rebound should still be treated as temporary.
In other words, the chart may bounce — but the market has not repaired the damage yet.
Conclusion
Gold is reacting from liquidity after a sharp breakdown, but the structure still needs proof.
As long as price stays below the broken channel and under the major supply zone above, the recovery remains limited. Long 
XAUUSD: Strong D1 Trendline Reaction Keeps 5260 Zone in Focus
Hello everyone, here is my view on the current XAUUSD setup.
Market Analysis
Gold is starting to show a stronger recovery tone after closing firmly above the rising D1 trendline, which is an important technical signal after the recent selloff. This reaction suggests that buyers are beginning to defend the higher-timeframe structure, and that the market may be preparing for a broader rebound rather than extending weakness immediately.
On the H2 chart, price is now trying to stabilize above the latest rebound base near the current zone around 4720–4730. This area becomes important because it sits just above the daily trendline reaction and may serve as the foundation for a medium-term recovery move.
From a broader technical perspective, the market is still trading under key overhead resistance, so the upside may not be completely smooth. However, as long as price continues to hold above the recent low and respects the higher-timeframe trendline support, the structure favors a recovery scenario with room to extend higher over time.
The first technical barrier comes in around 4736, followed by a stronger resistance zone near 4803. Above that, the next major level to watch is 4897, then the psychological area around 5000, while the longer-term upside objective remains near the 5260 region.
Key Price Areas to Watch
Current H2 buy zone: 4720–4730
Near-term resistance: 4736
Strong resistance: 4803
Next resistance: 4897
Major upside level: 5000
Long-term target: 5260s
My Scenario & Strategy
My preferred scenario is to continue looking for buy opportunities around the current price zone, as long as gold remains supported above the daily trendline reaction. If buyers maintain control, XAUUSD may continue recovering toward 4736 first, then 4803 and 4897. If bullish momentum becomes stronger on the higher timeframe, the market could eventually extend toward the 5260 area in the longer run.
At the same time, I would stay flexible for scalping opportunities around the marked resistance and support levels, especially as price approaches 4736, 4803, and 4897, where short-term reactions may appear before the larger move continues.
However, if price loses the recent rebound base and falls back below the daily trendline support, the recovery structure would weaken, and the bullish scenario would need to be reassessed.
That’s the setup I’m watching for now. Thank you for reading, and always manage your risk carefully. Long 
XAUUSD: Key Daily Support in Focus After Fed Holds Rates Steady
Hello everyone, here is my view on the current XAUUSD setup.
Market Analysis
Gold is now trading near a very important daily support area after the latest downside extension. Fundamentally, the market has just absorbed the March FOMC outcome, where the Fed kept the federal funds rate unchanged and still projected one rate cut in 2026, even while raising its inflation and growth expectations. This tells us the policy path remains cautious, but not aggressively restrictive enough to fully remove support from gold in the bigger picture.
From a technical perspective, XAUUSD is currently testing a major reaction zone around 4,700–4,630, which also aligns closely with the rising trendline support on the daily chart. This area stands out as a key decision point, because it combines horizontal demand with dynamic trend support inside the broader structure.
Looking at the chart, gold has been moving inside a large contracting triangle after the strong impulsive rally earlier this year. The recent selloff has pushed price back toward the lower half of that formation, while the upper descending boundary continues to cap the broader recovery attempts. For now, price remains under pressure in the short term, but it is also approaching a zone where buyers may begin to respond again.
If this support cluster holds, gold could form a rebound from the current base and rotate back toward 4,850, followed by the more important resistance area near 5,001. A stronger recovery from this region would suggest that the recent decline is only a pullback inside the larger consolidation structure rather than the start of a deeper breakdown.
On the other hand, if price fails to defend the 4,700–4,630 area and breaks cleanly below trendline support, the technical picture would weaken further and open the door for a broader correction.
Key Price Areas to Watch
Current support zone: 4,700–4,630
Trendline support: lower daily rising trendline
First rebound area: 4,850
Major resistance: 5,001
Structure invalidation: daily weakness below 4,630
My Scenario & Strategy
As long as XAUUSD holds above the 4,700–4,630 support region, I will continue to watch for a bullish reversal signal from this base. A confirmed rebound from trendline support could bring gold back toward 4,850 first, and then potentially toward 5,001 if momentum improves.
However, if price breaks and sustains below 4,630, the recovery scenario would weaken significantly, and the market could enter a deeper correction phase before establishing a new base.
That’s the setup I’m watching for now. Thank you for reading, and always manage your risk carefully. Long 
XAUUSD- Wave 5 Is Nearly DoneXAUUSD (H1) — The downtrend is still dominant, but the better setup may soon shift from selling to reversal trading
Gold is still trading inside a very clear bearish sequence on H1.
The chart continues to print lower highs and lower lows, and the latest breakdown shows that sellers are still controlling the broader move. From a structural point of view, this is still a market under heavy pressure, not a market that has completed reversal confirmation.
However, the chart is now entering a different stage of the trend.
The sell side is still dominant, but the easy short entries are no longer as clean as they were earlier in the move.
Structure reading
Looking at the chart, the bearish flow has already developed through a fairly complete impulsive decline.
The market moved from a larger consolidation block near the 5000–5040 region, then broke sharply lower and continued printing a fresh sequence of lower swing points.
The wave labels on the chart also suggest that the move is already deep into a 5-wave decline, with the current leg likely approaching the later stage of that sequence.
That matters because once wave 5 becomes extended, the risk starts to change:
trend direction may still be bearish
but fresh sell entries become less efficient
and the probability of a corrective rebound begins to increase
So the chart is still bearish, but not in the same “high-quality short entry” condition as before.
Key technical zones from the chart
1. Upper supply / recovery cap around 484x–485x
This is the first recovery ceiling marked on the chart.
If gold starts to rebound from current lows, this is the nearest area where short-term supply may appear again.
For now, this zone is still acting as a technical cap.
A bounce into this area without strong follow-through would still look corrective.
2. Recent sell liquidity around 4803
This dotted horizontal level is important because it marks the recent sell-side liquidity reference.
Price has already moved through that area and is now trading below it, which confirms that the structure has weakened further.
Unless the market can reclaim that level with strength, the current breakdown remains valid.
3. FVG sell scalping zone around 474x
This is the lower orange zone shown on the chart.
Under normal trending conditions, such an area can still offer a reaction or short-term rejection, but the problem now is timing.
Because price is already extended into the lower part of the structure, Kelly does not see this as an attractive place to chase the sell side aggressively.
The move has already traveled far, which means reward-to-risk for fresh shorts is no longer ideal.
4. Current low area around 468x
This is where the market is now trading after the latest strong breakdown candle.
When price reaches this kind of stretched location after an impulsive fall, the market often enters one of two phases:
a final exhaustion push lower
or a technical rebound before the next larger corrective sequence begins
That is why the next opportunity may no longer come from trend-chasing, but from waiting for a reversal structure.
Why Kelly does not prefer a fresh sell here
This is the most important part of the chart.
Yes, the structure is still bearish.
Yes, sellers are still in control.
But the sell entry now is late.
The earlier short opportunities came from:
rejection below broken support
retest of supply
continuation from cleaner lower highs
Now price is already far below those better entry zones.
Selling here means entering after extension, when the downside may still continue but the quality of positioning has clearly dropped.
For Kelly, that is not ideal trading.
A correct bias does not automatically mean a correct entry.
What Kelly is watching next
The chart itself already hints at the next likely transition:
after the 5-wave decline completes, the market may begin an ABC corrective phase.
That does not mean gold becomes bullish immediately.
It means the first cleaner setup may come from a smaller-timeframe reversal structure, not from another late sell.
What Kelly wants to see now is:
price stops printing aggressive impulsive sell candles
a lower timeframe base begins to form
the market creates a higher low
broken intraday resistance gets reclaimed
a reversal pattern appears before any long idea is considered
In other words, the buy is not here yet — but the market may be getting closer to preparing one.
Scenario map
Main scenario
Gold may complete the final portion of wave 5, then begin a corrective rebound.
If that happens, the next move could develop as an ABC structure, with the first upside reaction likely aimed back toward the nearby recovery zones.
Secondary scenario
If sellers still force one more breakdown from current levels, the move may become a final exhaustion leg.
But even in that case, Kelly would still avoid chasing that weakness too late and would rather wait for the post-extension reversal pattern.
Kelly’s read
This chart is still bearish in structure, but no longer attractive for fresh aggressive selling.
That distinction matters.
For Kelly, the market has moved from a trend-following sell phase into a wait-for-reversal-preparation phase.
The bias remains down, but the better opportunity ahead may come from patience on the lower timeframe, not from selling after the move is already stretched.
Conclusion
Gold is still sitting in a clear bearish H1 structure, and the 5-wave decline appears close to completion.
The sell side still controls direction, but the entry quality for new shorts has deteriorated sharply after the latest extension.
That is why Kelly is no longer focused on chasing the downtrend here.
The better plan is to wait for the smaller timeframe to build a proper reversal structure. If wave 5 finishes as expected, the next meaningful move may come in the form of an ABC corrective rebound.
The trend is still bearish — but the next clean trade may belong to the patient buyer, not the late seller. Long 
XAUUSD -Wave 3 pressure is building as USD demand firms again Wave 3 pressure is building as USD demand firms again
Gold remains under pressure as the market moves deeper into a bearish impulsive structure, with price now showing signs that wave 3 lower is still in progress.
The macro backdrop is also not helping gold stabilize.
Going into the FOMC decision, the USD is entering with a firmer base. Earlier dollar-hedging flows seen in early February have largely been reversed, while demand for USD cash and short-duration instruments has stayed positive. On top of that, Middle East tensions and shifting expectations around Fed rate cuts are continuing to support defensive dollar flows.
For Kelly, that matters because gold is no longer trading in a clean safe-haven vacuum.
Right now, the stronger USD tone is adding pressure to an already fragile chart structure.
Technical structure
From the chart, gold has already broken down from the previous sell liquidity area and is now trading below the key selling zone around 496x–500x.
That breakdown is important because it confirms the market is no longer just ranging — it is expanding lower.
The current decline also fits the idea of an impulsive bearish sequence, with price likely developing wave 3, which is typically the strongest part of the move.
If that reading holds, then the current small rebounds should still be treated as temporary pauses rather than signs of reversal.
The first major downside area now sits around the important support near 485x, where price may attempt a short-term reaction.
If selling pressure remains strong and that floor does not hold, the chart opens further toward the deeper rejection zone around 468x, which stands out as the next liquidity destination.
What matters next
For Kelly, the key point is not whether gold can bounce intraday.
Wave 3 conditions often still allow sharp technical rebounds, but those rebounds usually fail unless the market can reclaim broken structure.
That is why the main focus stays on:
whether price can recover back above the 496x key selling zone
or whether every bounce continues to get capped below that area
As long as gold remains below the broken supply band, the broader pressure still points lower.
Kelly’s read
This is still a chart where structure leads and emotion should stay out of the way.
The macro side is supporting the USD, while the technical side is showing a bearish expansion phase rather than stabilization.
For now, the cleaner interpretation is that gold is still working through wave 3 lower, with 485x as the next support test and 468x as the deeper extension zone if sellers keep control.
Conclusion
Gold is trading inside a bearish phase that looks increasingly consistent with wave 3 continuation.
A firmer USD backdrop, fading Fed cut expectations, and positive defensive dollar flows are all reinforcing that pressure.
Unless buyers can reclaim the broken 496x–500x structure, rallies are still likely to be treated as temporary pullbacks inside a market that remains vulnerable to another leg lower.
For Kelly, this is not a reversal chart yet — it is still a trend-pressure chart. Short 


