XAUUSD H1: DXY Surges to 100.28XAUUSD H1: DXY Surges to 100.28, Gold Loses Short-Term Support as Bearish Pressure Builds
Gold is showing a clear loss of momentum after the DXY surged to 100.28 during the European session, reinforcing renewed strength in the US Dollar. As the Dollar strengthens, gold is coming under heavier selling pressure, and the chart now reflects a market that is no longer in balance. On the H1 timeframe, price has started to slip below key short-term support, while the recent bullish structure is weakening, suggesting that downside pressure is expanding more clearly.
This is no longer just a temporary pullback. A stronger Dollar usually creates a double layer of pressure on gold: it weakens gold from a valuation perspective and also reduces short-term speculative demand. That is exactly what current price action is starting to reflect.
Fundamental backdrop
The main driver behind this move is the sharp rise in the DXY to 100.28, which confirms that USD strength is being reestablished. When the Dollar gains momentum like this, gold usually becomes less attractive in the short term, especially when price is already struggling to break higher.
In simple terms, the Dollar rally is acting as a catalyst for further weakness in gold. That is why price failed to hold nearby support and is now beginning to rotate lower from an important technical area.
Technical analysis on H1
Looking at the chart, gold is now trading below the key sell zone at 5127 - 5139, which was already marked as the ideal area for short entries. This is an important technical detail because it confirms that price reacted precisely from resistance, and sellers are currently in control.
The EMA structure is also turning more negative:
EMA 34: 5122.711
EMA 89: 5143.221
EMA 200: 5150.824
Price is now trading below the EMA 89 and EMA 200, while rebounds are being capped around the EMA 34 area. This kind of alignment suggests that upside recovery is weak and the short-term structure is shifting more clearly in favor of the bears.
Another key point from the chart is the invalidation level for the bearish setup. The bearish view only weakens if price can reclaim and hold above 5150.824. For now, price remains below that level, which means the downside scenario is still active.
In addition, the rising short-term trendline has lost its ability to support price effectively. Once gold slipped away from that structure, the market opened the door for a broader move into lower reaction zones.
Key price zones
Near resistance
5127 - 5139: primary sell zone
5150.824: bearish invalidation level if price closes back above it
5193.274: higher resistance and recovery level if buyers regain control
Downside reaction zones
5059.560: first critical reaction zone
4996.224: next downside target
4956.500: deeper support
4904.945: support cluster near psychological resistance
4850
4780 - 4800: major strong support zone
Trading scenario
Primary scenario: Prefer Sell positions while price remains below resistance
This remains the higher-probability setup because price has already reacted from the 5127 - 5139 sell zone and continues to trade below the key EMA cluster.
Entry zones
Sell 1: 5127 - 5139 if price retests resistance and prints bearish rejection
Sell 2: 5143 - 5150 if price pushes deeper into EMA 89 / EMA 200 but fails to close above
Sell breakout: if H1 closes below 5059, wait for a weak retest before entering continuation shorts
Stop loss
Above 5152 for the closer sell setup
More conservative: above 5193
Take profit
TP1: 5059
TP2: 4996
TP3: 4956
TP4: 4904
TP5: 4850
TP6: 4780 - 4800
Alternative scenario: recovery invalidates the bearish bias
The bearish setup would weaken if gold reclaims 5150.824 and secures a firm H1 close above that level. In that case, the current decline could turn into nothing more than a short-term flush before price rotates back toward 5193.
However, that is not happening yet. For now, every rebound should still be viewed as a potential selling opportunity, rather than an early reason to shift bullish.
Conclusion
XAUUSD is now under growing bearish pressure as the DXY rally to 100.28 strengthens the Dollar and directly weighs on gold. From a technical perspective, price has already reacted from the sell zone at 5127 - 5139, remains below the EMA 89 and EMA 200, and is opening room for a deeper move into lower reaction zones.
As long as gold stays below 5150.824, the market remains tilted toward a bearish continuation scenario. For now, the more favorable approach is to sell rallies into resistance, rather than trying to catch a bottom too early.  Short
Short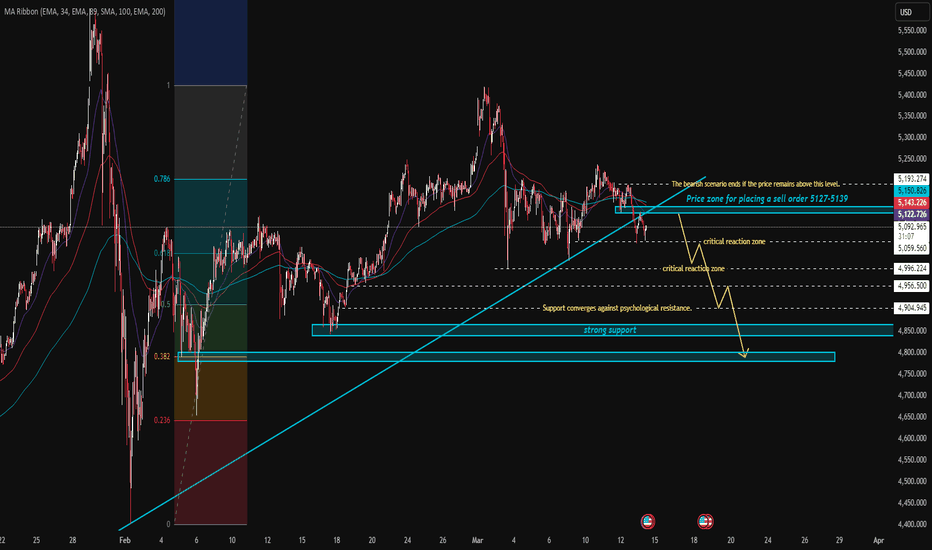
XAUUSD (H4) — Wave 5 Down Isn’t Done YetGold still hasn’t cleared the noise: wave 5 lower remains on the table, and the safest trigger is a break of the lower trendline
The market is in a difficult phase right now. Political tension and tariff pressure are pulling capital in different directions, the USD is seeing cross-currents, and gold is no longer behaving like a clean safe-haven asset. That is why price action looks noisy: wide swings, weak follow-through, and low confidence in each bounce.
For Kelly, this is not the kind of market to anticipate aggressively. This is the kind of market where structure has to lead.
Technical structure
On H4, gold is still compressed inside a larger structure with:
a descending trendline above acting as dynamic resistance
a rising trendline below acting as the last support line for the current recovery structure
The key point is that price has not produced a real bullish breakout. Every recovery leg is still getting capped below the descending trendline, and the projected path on the chart continues to support the idea that the market may still be completing a wave 5 decline.
There are three zones that matter most here:
Resistance / support-retest sell area around 5,126
This is the nearest pivot. If price cannot reclaim and hold above it, sellers are still controlling the short-term flow.
Buy scalping zone around 5,02x – 5,05x
This area can still produce a short-term bounce, but it is not enough on its own to confirm a larger reversal.
High liquidity zone around 4,90x
This is the deeper liquidity pocket, and the area Kelly sees as a realistic destination if wave 5 lower continues to play out.
In other words, the structure is not bullish enough yet to justify an aggressive long bias. The market may still owe one more push lower if the lower trendline gives way.
Kelly’s trade map
Kelly does not want to buy early just because price is sitting near support.
The reason is simple: when trend is unclear, support can easily turn into a trap.
So today’s map is straightforward:
If price continues to stay capped below 5,126 and below the descending trendline, the path still leans lower
If price breaks the rising lower trendline clearly, that becomes the safer confirmation that wave 5 lower is continuing
In that case, the next pull zones sit around 5,02x, then deeper toward 4,90x
Until the lower trendline actually breaks, the market is still technically inside compression, and any aggressive short taken too early can get snapped back.
Entry idea
Preferred scenario: wait for the lower trendline break, then sell confirmation
This is the safer Kelly setup.
Entry idea
Wait for a clear H4 break below the rising lower trendline, then watch for a failed pullback to confirm the short.
Execution concept
Sell after price breaks the lower trendline and retests it without reclaiming
Or sell if price keeps getting rejected clearly below 5,126
Stop loss
Above the nearest swing high or above the pullback rejection high after the breakdown.
Targets
TP1: 5,02x
TP2: 4,95x
TP3: 4,90x high liquidity zone
Secondary scenario: technical bounce first, then continuation lower
If price does not break the lower trendline immediately, gold may still produce a narrow technical rebound first.
In that case:
5,126 remains the key reference
if price fails to reclaim and hold above that area, the rebound should still be treated as a support/resistance retest before another leg lower
Kelly does not prefer buying here, because the reward-to-risk is less attractive than waiting for a confirmed breakdown structure.
Conclusion
Gold is no longer behaving like a one-directional safe-haven trade, which is why the structure has become much noisier. On H4, the more realistic path is that the market may still be working through wave 5 lower, but the safer way to engage is not to sell early — it is to wait for a break of the lower trendline and then confirm sell-side continuation.
Until that happens, every rebound should still be treated as a technical bounce inside a structure that remains vulnerable to another move lower. Short 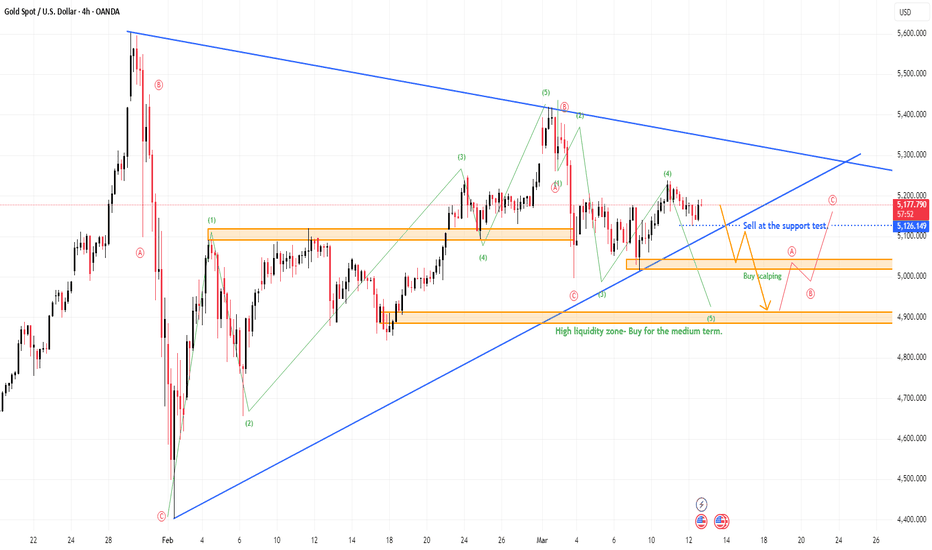
XAUUSD Builds Pressure for a BreakoutGold Remains Compressed in a Tight Range, but the EMA Structure Still Favors a Bullish Breakout
Gold is now trading in a contracting price range, with price squeezed between a descending trendline from the recent highs and a rising trendline from the latest swing low. This kind of structure usually signals that the market is approaching a decisive move. At this stage, the key is not to anticipate too early, but to wait for a clear confirmation candle breaking the trendline before validating the next directional move.
From a macro perspective, US monetary policy remains the main driver behind gold’s hesitation. The Federal Reserve is tasked with maintaining price stability and supporting maximum employment, and its primary tool is interest rate policy. When inflation stays above the Fed’s 2% target, higher rates tend to support the US Dollar and create pressure on gold. On the other hand, when inflation cools or labor conditions weaken, the Fed may lean more dovish, which usually reduces pressure on bullion. For now, this backdrop explains why gold has not broken out decisively yet, even though the technical structure remains constructive.
Technical Outlook on H1
Looking at the chart, price is still holding above the EMA 34, EMA 89, and EMA 200, currently around:
EMA 34: 5172.140
EMA 89: 5166.172
EMA 200: 5161.218
This is an important signal. As long as price remains above this EMA cluster, the market still carries a bullish underlying bias. In other words, gold may not have broken out yet, but buyers are still defending the structure and preventing a short-term breakdown.
The most important feature on this chart is the current compression zone. Price is tightening between the descending resistance trendline and the EMA support base below, which places the market at a decision point. A confirmed breakout above the trendline could trigger a stronger upside expansion toward the next liquidity zones. If price fails and breaks lower instead, gold may first sweep lower liquidity before rebuilding momentum.
Key Price Zones
Near support
5172 - 5161: EMA 34/89/200 cluster, the main support holding the bullish structure
5126: nearby sell-side liquidity zone
5096 - 5100: major buy zone and strong liquidity support
Resistance
5210
5239
5260
Extended upside targets
5335
5360 - 5380: major higher resistance zone
Trading Scenarios
Primary scenario: Buy on a confirmed breakout above the descending trendline
This remains the preferred scenario, because price is still trading above the EMA cluster and the bullish structure has not been broken.
Confirmation conditions
An H1 candle closes clearly above the descending trendline
Price holds above the 5210 area
The breakout candle shows a solid body and is not heavily rejected
Entry zones
Buy breakout: 5210 - 5215 after a confirmed H1 close above the trendline
Buy retest: 5200 - 5205 if price breaks out first and then retests the breakout zone
Stop loss
Below 5188 for a tighter breakout entry
More conservatively below 5160
Take profit
TP1: 5239
TP2: 5260
TP3: 5335
TP4: 5360 - 5380
Secondary scenario: Price sweeps lower liquidity first, then resumes higher
If gold cannot break the trendline immediately, the market may dip lower first to collect liquidity before attempting another upside move.
Zones to watch
5126
5096 - 5100
These are stronger demand zones, especially if price shows a clear bullish reaction such as a rejection wick, false breakdown, or reversal candle on H1.
Entry zones
Buy 1: 5128 - 5135 if price holds the 5126 area and rebounds
Buy 2: 5098 - 5105 if price sweeps deeper into the major buy zone and prints a reversal signal
Stop loss
Below 5088
Take profit
TP1: 5170
TP2: 5210
TP3: 5239
TP4: 5260
Invalidation of the Bullish Scenario
The bullish setup would weaken significantly if:
H1 closes below the 5161 - 5172 EMA cluster
Price breaks the rising support trendline
And fails to reclaim the EMA zone on the next rebound
If that happens, gold could extend lower toward the 5096 - 5100 support zone before forming a new structure.
Conclusion
XAUUSD is still trapped in a tightening range, but that does not signal weakness by itself. In fact, the fact that price remains compressed while still holding above EMA 34, EMA 89, and EMA 200 suggests that the underlying bullish structure is still intact.
The right approach here is to wait for a clean breakout confirmation above the trendline before chasing momentum, or stay patient for a deeper liquidity sweep into lower support for a better long entry. As long as price continues to hold above the EMA base, gold still has the potential to extend toward 5239, 5260, and eventually 5335 and 5360 - 5380. Long 
 Education

XAUUSD (H1) — CPI stayed steady USD lost momentum, and Gold is still building a continuation structure to the upside
US CPI held steady at 2.4% in February, right in line with expectations. That matters because it did not give the USD a fresh bullish catalyst. Instead, the market is reading it as a “no new hawkish shock” print, which keeps pressure off Gold in the short term.
At the same time, the chart is already showing something important: Gold is not trading like a market preparing to break down. It is holding its rising support structure, defending demand, and continuing to build a path toward the upper liquidity zone.
This is where many traders get trapped. They focus only on macro headlines, while price is quietly holding the bullish map.
Technical structure
On the H1 chart, Gold is still moving inside a rising support structure, with the key base sitting around the FVG buying zone + trendline support near 5140–5157. That zone has already proven itself more than once, and every successful retest keeps the short-term bullish structure intact.
Above current price, the market is climbing through a very clear reclaim ladder:
5223–5225
This is the first important reclaim area. Price has already reacted around this zone, and holding above it keeps the recovery leg active.
5260.766
This is the next continuation checkpoint. If price accepts above this area, momentum usually improves.
5279.185
This is the upper reclaim line before the real test of supply.
Then above all of that sits the key decision area:
5301–5305
This is the liquidity selling zone + descending trendline. It is the most important upside test on the chart. If Gold reaches this zone, the market will have to decide: reject and rotate lower, or break and unlock continuation higher.
So structurally, the chart is still bullish in the short term — but it is a step-by-step bullish structure, not a runaway breakout yet.
Kelly’s trade map
I’m not interested in buying randomly in the middle of the move.
For Kelly, the map remains simple:
As long as Gold keeps defending the 5140–5157 base, the continuation structure remains valid
As long as reclaim levels keep getting paid one by one, buyers stay in control
The real decision happens only when price reaches 5301–5305
That means the current market is still best treated as a buy-the-retest environment.
If price continues holding above the trendline base, the bullish path remains:
5225 → 5260 → 5279 → 5301–5305
If price reaches the upper liquidity sell zone and cannot accept above it, then a reaction pullback becomes normal. But until the base breaks, that pullback would still be treated as a correction inside a bullish continuation map — not a confirmed bearish reversal.
Entry idea
Bullish continuation scenario
This remains the preferred scenario while price stays above the FVG base.
Entry idea
Buy pullbacks into 5150–5160 after confirmation on M15/H1.
The cleanest trigger is a retest that holds, followed by rejection wicks or a higher-low formation.
Stop loss
Below 5140
Targets
TP1: 5225
TP2: 5260
TP3: 5279
TP4: 5301–5305
This is the ideal “structure trade”: buy the defended base, let price reclaim levels, and reduce risk as each upside checkpoint is paid.
Tactical reaction scenario
If price reaches 5301–5305 and prints a clear rejection, that area can produce a sharp reaction because it combines liquidity and descending trendline resistance.
That would not automatically change the full bullish structure. It would simply mean the market is reacting at supply before deciding whether to break later.
Gold is still respecting the bullish map. CPI did not give the USD a fresh impulse, and the chart continues to favor buying pullbacks while the 5140–5157 base holds.
For now, the structure stays constructive — and unless that base breaks, the upside continuation toward 5260 → 5279 → 5301–5305 remains the cleaner path. Long 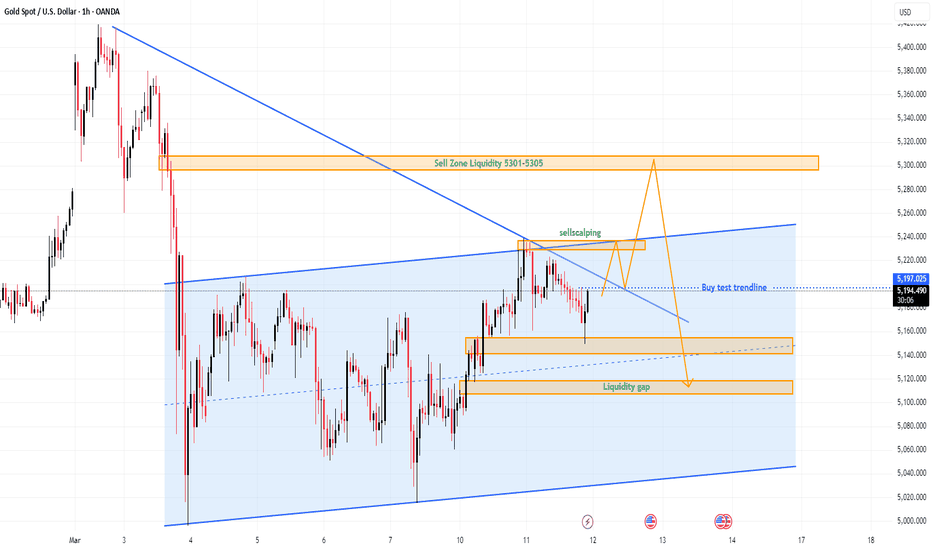
XAUUSD H1: DXY Loses Momentum at 99.7While Gold Holds Firm Above EMA Support and Prepares for a Potential Upside Extension
Gold is entering a very important phase, where the fundamental backdrop remains mixed, yet the technical structure is still holding up well. The failure of the DXY to sustain strength around 99.7, following the sharp collapse in oil prices, has slightly eased pressure on gold. However, the larger macro headwind still comes from the Federal Reserve, as real policy rates remain positive, meaning the environment is not yet ideal for gold to rally aggressively in a straight line.
Even so, the market is not showing clear signs of weakness. Instead, gold is behaving like a market with underlying strength: holding above key EMA support, absorbing selling pressure, and preparing for a possible move into higher liquidity zones.
Technical Outlook on H1
On the chart, price is still trading around the EMA 34, EMA 89, and EMA 200 cluster, located at:
EMA 34: 5185.252
EMA 89: 5164.811
EMA 200: 5159.288
This EMA cluster is acting as a critical dynamic support zone. The repeated pullbacks into this area followed by rebounds suggest that buyers are still defending the structure effectively.
At the same time, price remains compressed beneath a descending trendline from the recent high, while the EMA cluster continues to support from below. This creates a tightening range, and such conditions often lead to a clearer breakout move once the market resolves direction.
Key Price Zones
Support
5185 - 5165: EMA 34 and EMA 89 support zone
5159: EMA 200, the main structural support for the short-term uptrend
Resistance
5205 - 5222: immediate resistance zone
5259: key breakout expansion level
5278: next liquidity target
Extended upside targets
5336
5376
Trading Scenario
Primary scenario: Prefer Buy positions while price holds above the EMA cluster
As long as gold remains above the 5185 - 5165 zone, the bullish continuation scenario remains valid.
Entry zones
Buy 1: 5182 - 5188 if price makes a shallow pullback and reacts positively from EMA 34
Buy 2: 5168 - 5175 if price dips deeper into EMA 89 and prints a bullish confirmation candle
Buy breakout: wait for an H1 close above 5205 - 5210, then look for a retest entry
Stop loss
Below 5158
More conservative: below 5148
Take profit
TP1: 5222
TP2: 5259
TP3: 5278
TP4: 5336
TP5: 5376
Invalidation
The bullish setup will be invalidated if an H1 candle closes decisively below the EMA cluster, especially below 5159 - 5165. In that case, gold may shift into a deeper correction rather than continuing higher immediately.
Conclusion
At this stage, gold has not shown a confirmed bearish reversal. While the Fed remains a macro headwind, price action on the chart still supports a constructive outlook. Gold is holding above EMA 34, EMA 89, and EMA 200, which keeps the market biased toward a bullish continuation scenario.
For now, the more favorable strategy is to look for buying opportunities on pullbacks or after a confirmed breakout, as long as price does not close sharply below the key EMA support zone. Long 
Education

XAUUSD (H1) -Two trendlines, one decision zone Gold is building a step-by-step recovery toward 5,30x
Gold isn’t moving in a straight line today — it’s moving like a market that’s preparing. The sharp drop in crude oil helped risk sentiment stabilize and made it harder for the USD to stay strong. With DXY slipping below 99, gold gets a short-term window to grind higher.
But this is still a data-sensitive day. Existing Home Sales and ADP can quickly change USD momentum, so the cleanest approach is to trade structure and liquidity reactions, not the headline.
Technical structure
On H1, price is trapped between two forces:
A rising trendline underneath that is lifting the base
A descending trendline overhead that still caps the recovery
This creates a squeeze where gold typically does one of two things: it either climbs level-by-level and breaks out, or it runs into supply at the top of the squeeze and rotates back to the base.
The important detail is where the base is coming from. The current recovery is being built from an FVG demand pocket that aligns with the rising trendline. When gold respects a demand pocket like this, it often climbs in “stairs” through reclaim levels.
That reclaim ladder is clear on your chart:
5,225 → 5,260 → 5,279
Above those sits the main decision area:
5,305–5,330
This zone is stacked with liquidity and lines up with the descending trendline, which is why it’s the most likely place for a sharp reaction.
Kelly’s trade map
I’m not chasing price in the middle of the squeeze. I’m only interested in two locations:
The base, where demand is defending and risk is easy to define
The sell-side liquidity zone near 5,30x, where breakout or rejection will reveal the next leg
This is a step-by-step market. If gold wants to trend higher, it will reclaim levels and hold them on retests. If it can’t, the market will rotate back into the base and test whether buyers are real.
Entry idea
Bullish continuation
Bias stays constructive while the FVG base holds.
Entry
Buy a pullback into 5,150–5,165 after confirmation on M15/H1
Confirmation can be a clean rejection wick from the base or a higher-low break after retest
Stop loss
Below 5,135
Targets
TP1 5,225
TP2 5,260
TP3 5,279
Extension 5,305–5,330 if price breaks and holds into the liquidity sell zone
Execution note
Once TP1 is hit, reduce risk. Let structure decide whether the market can pay the next step.
Tactical sell reaction at the decision zone
This is not a trend reversal call. It’s a reaction trade if supply shows up clearly.
Entry
Sell only after a clean H1 rejection inside 5,305–5,330
Stop loss
Above 5,335
Targets
TP1 5,279
TP2 5,260
TP3 5,225
Deeper pullback 5,160–5,140 if selling expands
If gold reaches 5,305–5,330, do you expect a clean breakout and hold, or a rejection that sends price back to retest the base first? Long 
 Long
Long
 Education

DXY (D1) — “Trendline Break ConfirmedUSD is back in control, and the next leg could be strong”
DXY has just delivered a clean technical shift: price broke the descending trendline and is now holding above the breakout area. This kind of move is often more than a short-term bounce — it usually signals a regime change, where the market starts re-pricing USD strength on a medium-term horizon.
With political tension rising, risk appetite tends to tighten. In those environments, capital often rotates into defensive positioning — and the USD typically benefits first. That “safe-haven bid” adds fuel to a breakout structure like this.
What the chart is saying
The downtrend line has been broken, and the breakout candle shows strong intent.
The most important confirmation is not the spike — it’s whether price can stay above the broken trendline and build higher lows.
The overhead supply zone (highlighted area) becomes the next natural magnet. If momentum stays firm, that zone is where DXY is likely to be pulled.
Macro tone supporting USD
Boston Fed President Susan Collins reiterated that for the Fed to cut rates again, it needs clear evidence that inflation is moving lower. She also stated she does not see an urgent need to shift policy stance.
In simple terms: this reinforces a “patient Fed” narrative. When markets stop pricing aggressive cuts, USD usually gains support.
Combine that with geopolitical uncertainty, and the backdrop leans constructive for DXY on the medium-term view.
Medium-term scenarios
Primary scenario: hold above the breakout and continue higher
If DXY holds above the broken trendline (no sustained daily closes back below it), the structure favors continuation toward the supply zone overhead. A successful retest of the trendline — touch and bounce — often becomes the launchpad for the next push.
Retest scenario: dip first, then resume
A pullback into the trendline is not bearish by itself. If that retest is defended and price quickly reclaims, it usually strengthens the trend rather than weakens it.
Invalidation
If DXY falls back below the broken trendline and starts printing weak daily closes beneath it, the breakout loses quality and the market can slip back into consolidation.
Cross-market note (useful for gold traders)
A stronger DXY often puts pressure on gold in the short term. If DXY continues to hold above the breakout and pushes higher, it’s reasonable to expect gold to stay choppy or corrective until USD momentum cools.  Long
Long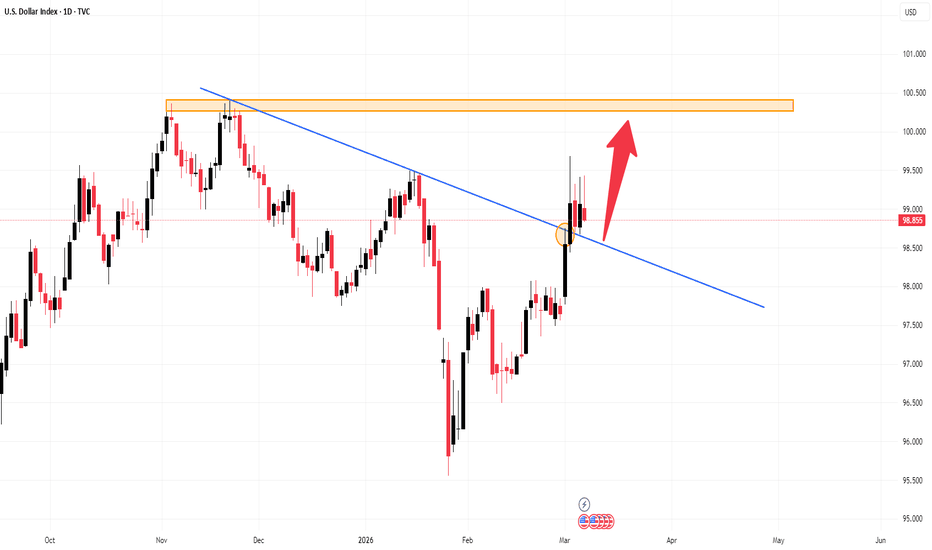
XAUUSD (H1) — NFP Day Sell remains the main plan while price stays below the descending trendline
Today is an NFP session, and gold often whipsaws both sides before the real direction shows up. So instead of guessing tops/bottoms, the focus is on levels + reaction.
On H1, the structure is still under pressure: price remains below the descending trendline, and the bounces so far look like technical pullbacks within a short-term bearish phase.
Key zones on the map
Sell zone (primary focus)
Around 5,150 – 5,165 (supply + close to the descending trendline).
This is the area to watch for a clean rejection to follow the main bias.
Mid support / scalp buy area (reaction zone)
Around 4,960 – 4,980
This can produce a technical bounce, but it’s not a preferred swing-buy area if selling pressure stays strong.
Main buy zone (after the flush)
Around 4,800 – 4,820
This is where a stronger reaction is more likely, suitable for looking for a proper rebound after liquidity is cleared.
Trading scenarios
Primary scenario: Sell the retest
If price pulls back into 5,150 – 5,165 and shows weakness (upper wick / rejection close / failure to hold above the zone)
→ Look for SELL
→ Target 1: 5,000
→ Target 2: 4,960 – 4,980
→ Target 3: 4,800 – 4,820
No-sell scenario: acceptance above the zone
If price closes and holds above the sell zone and breaks the descending trendline
→ Avoid forcing shorts and wait for a retest to reassess direction.
NFP note (risk control)
During the release window, it’s safer to reduce size, avoid jumping in at the exact print, and wait for a confirmed candle close to avoid getting swept.
Takeaway
Sell is the main point today — but only if price retests 5,150–5,165 and rejects. If the market dumps hard, the key reactions to watch are 4,960–4,980, and especially 4,800–4,820 for a higher-quality bounce after the flush.
Which NFP path do you expect: retest higher then drop, or straight dump to grab liquidity first? Short 
 Education

Education

Education

 Education

 Education

 Education

Education

Education


