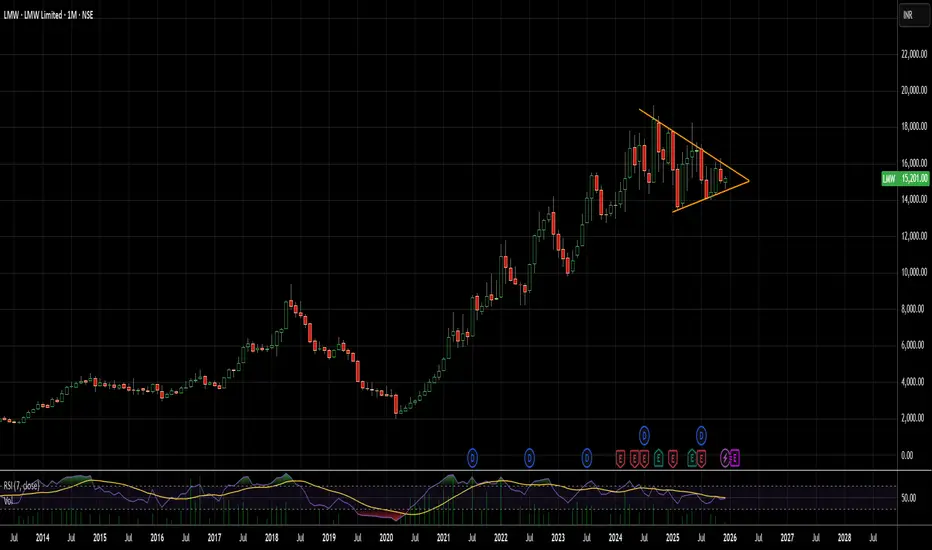
Three Faces of Consolidation: How the Same Rally have 3 FacesThis post is educational and observational in nature based on historical price action. It is not a forecast or a trading recommendation.
Setup: The Bullish Rally
This chart begins with a strong bullish rally, the foundation from which three separate consolidation structures went on to form at different points along the stock's journey.
Pattern One: The Triangle
Following the initial rally, price consolidated into a triangle pattern, converging highs and lows compressing into a tighter range as the market paused to absorb the prior move.
Pattern Two: Inverse Head and Shoulders on a Slanted Trendline
After another rally, price formed an inverse head and shoulders pattern, a reversal structure built from a low, a deeper low, and a higher low. What makes this instance distinct is that its neckline was not a flat horizontal breakout level, but a slanted counter trendline instead, with a symmetrical triangle also forming along this same slanted structure. This combination shows how a reversal pattern can develop against an angled reference line rather than the more commonly seen horizontal one.
Pattern Three: The Parallel Channel
Following the next rally, price settled into a parallel channel, contained between two consistent, roughly equidistant boundaries, reflecting a more evenly structured consolidation phase compared to the converging patterns seen earlier.
 Long
Long
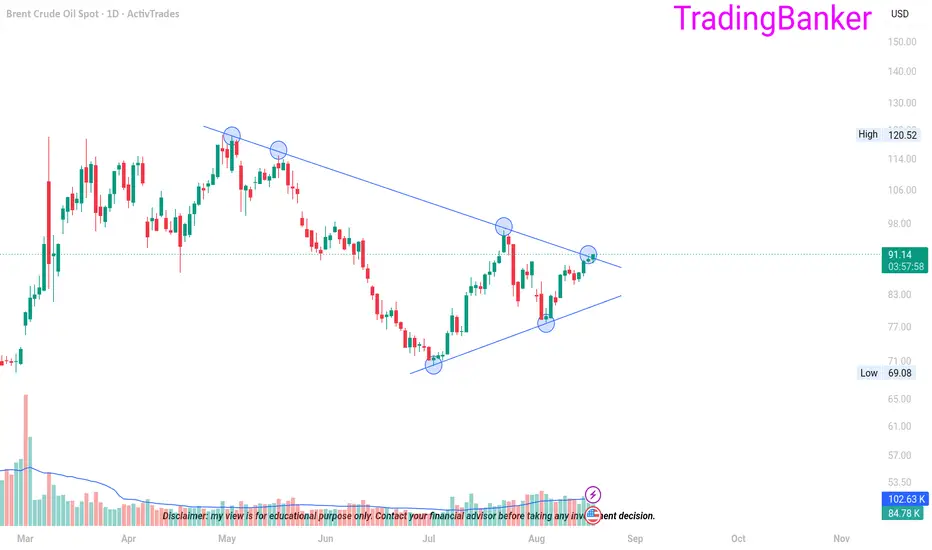
CRUDE OIL: SYMMETRIC TRIANGLE — BREAKOUT OR BREAKDOWN?Symmetric Triangle • Volatility Compression • Breakout / Breakdown Plan
1. The Technical Setup
Crude Oil is approaching a potentially important decision point. The 4H chart shows a textbook-style Symmetric Triangle: lower highs are creating descending resistance, while higher lows are creating rising support. The two boundaries are converging as price moves into a narrower range.
What is a Symmetric Triangle? It is a consolidation pattern representing temporary equilibrium between buyers and sellers. Neither side has established sustained control. As the range contracts, the market eventually attempts to resolve that balance through an upside breakout or downside breakdown. The pattern itself does not predict the direction.
2. What the Chart Is Showing
• May–June: Crude Oil experienced significant volatility and wide price swings.
• August onward: volatility contracted and price shifted into a much narrower, sideways range.
• Recent sessions: noticeable volume contraction accompanied the narrowing price range.
• Current structure: price is moving close to the converging triangle boundaries, increasing the importance of the next confirmed expansion.
3. Trading Principle
Do not predict the direction—react to confirmation. The plan is to wait for the upper angular resistance or lower angular support to break, then use 1H and 4H candle closes to progressively confirm the move.
4. Risk-Managed Trading Plan
Lets say maximum risk allocated to the complete triangle setup: $1,000. The $1,000 is not deployed at once. The first directional attempt—whether breakout or breakdown—has a maximum risk of $500.
Confirmation Action Risk
1H candle close -> Enter first tranche after confirmed breakout/breakdown ->$250
4H candle close ->Add second tranche if the move remains confirmed ->+$250
First directional attempt -> Maximum risk ->$500
Opposite confirmed setup If first attempt fails, repeat the same 1H + 4H framework Up to $500
Complete setup Maximum combined risk across both directions $1,000
5. If the First Breakout / Breakdown Fails
A failed breakout is not automatically a reversal trade. If the initial directional attempt is stopped out, wait for the market to subsequently provide a confirmed signal in the opposite direction. Only then can the remaining $500 directional risk be deployed using the same $250 + $250 confirmation framework.
ATTEMPT 1 → $250 (1H) + $250 (4H) → FAIL → OPPOSITE CONFIRMATION → $250 (1H) + $250 (4H)
6. The Hard Risk Limit
If both directional attempts fail, the setup is finished. No third attempt, no revenge trade, no increase in position size, and no attempt to recover losses. The predefined maximum loss remains $1,000 for the entire triangle setup.
7. Reward Framework
Target: approximately 1:6 risk-to-reward. The objective is not to make every trade profitable. A large R:R allows a successful expansion to potentially compensate for several controlled losing attempts. The stop must remain predefined; the R:R should never be created by widening risk.
8. Final Checklist
• Wait for the upper or lower triangle boundary to break.
• Require a 1H candle close for the first $250-risk tranche.
• Require 4H confirmation before deploying the additional $250.
• If the first direction fails, wait for a genuine opposite-side confirmation (fake BO/BD).
• Maximum $500 risk per directional attempt; maximum $1,000 for the entire setup.
• If both directions fail, stop trading the pattern.
• Never increase risk because the market has moved against the position.
CAPITAL PRESERVATION > PREDICTION
I do not need to know which way Crude Oil will break. I only need to be prepared for both possibilities and control risk.
Educational purpose only. not a recommendation
 Long
Long
 Long
Long
The Golden Rest Zone: Where Rallies Pause After the ClimbThis post is educational and observational in nature based on historical price action. It is not a forecast or a trading recommendation.
The Fibonacci Retracement Tool
The Fibonacci retracement tool is used here by anchoring it from the lowest point of the swing to the topmost point of that same swing, measuring the full move from bottom to top. This tool maps out key levels within that range, most notably 50% and 61.8%, which together form what is often referred to as the golden zone, one of the more closely watched retracement areas in technical analysis.
The Observation
A recurring behavior on this chart, and one seen across many stocks after a strong rally from a swing low to a swing high, is that price often pauses and consolidates for an extended period specifically within this 50% to 61.8% zone. Rather than retracing shallowly or falling all the way back to the origin of the move, the market frequently settles right within this golden area before deciding its next direction.
The Symmetrical Triangle Pattern
Within this golden zone, a symmetrical triangle pattern has formed. This is a consolidation structure defined by converging lower highs and higher lows, compressing price into a progressively tighter range. Its presence here, sitting precisely within the golden retracement zone, adds another layer of structural context to this pause in the broader move.
The Bigger Picture
This chart highlights how a mathematically derived zone like the Fibonacci golden area can also become the physical location where a price based pattern like a symmetrical triangle forms. Recognizing that consolidation after a strong rally often gravitates toward this specific retracement range is a useful observation for understanding how rest phases in the market tend to take shape.  Long
Long
Long 
 Long
Long
History May Not Repeat, But Patterns Clearly DoAll price action shown in this chart is historical and older than three months. This post is purely educational and observational in nature. It is not a forecast or a trading recommendation.
The First Instance: 2008 to 2014
Between 2008 and 2014, this stock formed a symmetrical triangle pattern on the monthly timeframe. The eventual breakout in 2014 coincided with price reclaiming the 50 day exponential moving average on the same timeframe, with the triangle breakout and the EMA reclaim occurring together.
The Pattern Returns: 2022
Following a substantial rally in the years after, a strikingly similar symmetrical triangle structure formed again in 2022. Once again, this consolidation appeared after an extended upmove, echoing the same setup that had played out roughly a decade earlier.
The Pattern Returns Again: 2024
The same sequence repeated once more in 2024, a symmetrical triangle breakout aligning again with support being taken at the 50 day exponential moving average on the monthly timeframe. Three separate instances, years apart, each showing the same structural fingerprint.
The Bigger Observation
This chart is not about predicting whether the same outcome will occur a fourth time. It is about recognizing something more fundamental, that while history as a specific outcome may never truly repeat itself, the patterns and structures the market tends to form clearly do recur. The same triangle formation, the same moving average interaction, showing up across three distinct periods on the same chart, is a reminder that price action often rhymes even when the underlying story around it is completely different each time.
 Long
Long
Nifty Bank Weekly Analysis [24 - 28 August, 2026]Probable Price Structure and Scenario Analysis for the Nifty Bank NSE:BANKNIFTY Index. The analysis is restricted to the week of 24 - 28 August, 2026.
🟢 Bullish Scenario
Presently, there is no bullish scenario. Firstly, for a bullish setup, the price must give a sustainable breakout above 58000. Then a weak bullish target will be 58500. There will be strong resistance at 58500. Next, if the price decisively breaks out above 58500, then strong bullish sentiment would emerge. The probable bullish targets above 58500 would be - 59000, 59500, and 60000.
🔴 Bearish Scenario
Presently, there is no bearish scenario. The price is perfectly indecisive. The first sign of bearishness will emerge if the price gives a sustainable breakdown below 57000. A weak bearish target below 57000 would be 56500. There will be strong support at 56500. Next, if the price breaks down below 56500, then strong bearishness will emerge. The probable bearish targets below 56500 would be - 56000, 55500, and 55000.
🟡 No Trading Zone (NTZ): (58000 - 57000).
⏺ Range of Consolidation (ROC): (58500 - 56500).
Here, 57500 is the median of the ROC. The median works like a trading session sentiment evaluator. The price trading above the median would offer bullish sentiment, while the price trading below the median would trigger bearish sentiment within the ROC.
● Event
There is no major event or holiday this week. But geopolitical issues are omnipresent and beyond our control.
● Intraday, Weekly, and Monthly Bias
Establish bias with respect to the opening price (of the particular session - Intraday, Weekly, and Monthly). If the price sustains above the opening price, then don't think of shorting. Look for bullish trades only. On the contrary, if the price sustains below the opening price, then don't think of going long. Look for bearish trades in that case.
● Disclaimer + End Note
- All the analyses would fail in the case of a major gap up, gap down, or price structure anomaly. Thus, practice PRAGMATISM in the live session.
- Trade only if there is a set-up. Remember, not trading is an extension of the trading activity.
- Mark your points. Trade your points. Price is GOD. Anything can happen in the markets. Thus, trade what you see, not what you believe.
- Always PRACTICE RISK MANAGEMENT. Always PROTECT YOUR CAPITAL. Be RESPONSIBLE.
- Be Strategic. Be Courageous. Be Patient. Be Wise.
- Every day is a new day. Thus, do not carry the baggage of past successes or failures. Leave the gardens of winning and losing. Establish yourself in equanimity. Always think from a new perspective.
- Let the joy of trading drive your effectiveness, not greed or fear. Believe in Possibilities.
Happy Trading!  Long
Long
HINDUSTAN UNILEVER — Testing Triangle Support, Bullish SetupOverview
Hindustan Unilever is trading at 2,077, down 0.72%, now testing the lower boundary of its 2-year symmetrical triangle. This is the same triangle covered in our earlier post, where price was watching the upper resistance zone; instead, price has drifted down and is now testing support at the opposite end of the same structure.
Pattern Explanation
The triangle's upper resistance line connects the October 2024 high (2,988) down through the September 2025 secondary high, converging toward the lower support line, which connects a series of rising lows since late 2024. Price is now testing this lower support again near current levels, trading below the 200 EMA (2,238.5), reflecting the recent weakness. This support zone has held on prior tests and remains the key level for a bullish reversal setup.
Trade Setup
Entry: Buy near current levels (2,070–2,090), on strength off triangle support
Stop Loss / Invalidation: Close below 2,000
Target 1: 2,175
Target 2: 2,238.5 (200 EMA)
Target 3: 2,325
Target 4: 2,408
Target 5: 2,480 (Triangle Upper Resistance)
Key Levels
Triangle Support / Entry Zone: 2,000–2,090
Invalidation: Close below 2,000
Target 1: 2,175
Target 2: 2,238.5
Target 3: 2,325
Target 4: 2,408
Target 5: 2,480
Beginner's Lesson
In a symmetrical triangle, support and resistance testing can happen many times before the eventual breakout. A stock testing the lower boundary isn't necessarily bearish, it's simply price checking whether buyers will defend that zone again, just as it earlier tested the upper boundary and pulled back. Watching how price reacts right at this support, rather than assuming which way the triangle eventually breaks, is the key skill here.
Conclusion
HINDUNILVR is testing important triangle support, with the invalidation clearly marked below 2,000. A bounce from here with strength would support a bullish case through a staged target ladder up to the 2,480 zone. A close below 2,000 would invalidate this setup and suggest a deeper breakdown.
This is for educational purposes only and not investment advice. Please do your own research or consult a financial advisor before making any trading decisions.  Long
Long
HAL - Symmetrical Triangle Coiling on Weekly ChartOverview
Hindustan Aeronautics has been consolidating inside a large symmetrical triangle since its July 2024 high of 5,674.75, with price now compressing right into the apex around the 4,320–4,385 zone. This is the first time we're covering the defense/aerospace space, and the multi-timeframe setup here — both weekly and daily charts showing the same structure — makes it a notable one to watch.
Pattern Explanation
On the weekly chart, a descending resistance line connects the July 2024 high down through lower highs to the current Resistance Zone at 4,737.60, while a rising support line connects the March 2025 low near 3,046.05 up through higher lows to the current Support Zone at 3,600.25. These two lines are converging, and price is now sitting almost exactly at the 50-week EMA (4,320.96) — a tight coiling right at this average that often precedes a decisive directional move once the triangle resolves. The 200-week EMA (3,474.54) sits well below, closer to the triangle's support boundary, giving a longer-term reference if the pattern resolves lower.
On the daily timeframe, the same structure is visible at finer resolution: price is pinned closely between its own daily EMAs (4,339.93 and 4,344.59), confirming this is a genuine multi-timeframe consolidation rather than noise on a single chart. The daily chart also shows the same descending resistance and rising support lines converging toward the same zone, reinforcing the weekly picture.
Key Levels
Resistance (Triangle Upper Boundary): 4,737.60
Support (Triangle Lower Boundary): 3,600.25
Current Consolidation Zone: 4,320–4,385
50-week EMA: 4,320.96
200-week EMA: 3,474.54
Major Reference High: 5,674.75
Major Reference Low: 3,046.05
Scenarios
If resistance breaks: A close above 4,737.60 would suggest the triangle is resolving bullishly, with the prior swing highs near 5,000–5,200 as a reasonable first reference and the July 2024 high (5,674.75) as a longer-term marker.
If support breaks: A close below 3,600.25 would suggest the triangle is resolving bearishly, with the 200-week EMA (3,474.54) as an immediate reference and the 3,046.05 zone as the next major level below.
Beginner's Lesson
A symmetrical triangle is one of the more neutral chart patterns — unlike an ascending or descending triangle, it doesn't inherently favor one direction. The value of spotting one isn't predicting which way it breaks, but recognizing that the compression itself signals decreasing volatility and an approaching decisive move. Here, the added detail of price consolidating right at the 50-week EMA on the weekly chart, and near dual EMAs on the daily, adds extra weight to this specific zone as the one to watch.
Conclusion
HAL is coiling tightly inside a well-defined symmetrical triangle across both weekly and daily timeframes. As always, wait for a confirmed close beyond either boundary before drawing directional conclusions, and manage risk according to your own plan.
Not investment advice. For educational purposes only. Please consult your financial advisor before making any trading decisions. NIFTY – Wave 4 Triangle | D-Wave Liquidity Sweep & Wave ENIFTY is currently in Wave 4, where a potential triangle formation appears to be developing.
In Elliott Wave theory, a triangle consists of five waves:
A → B → C → D → E
At present, my interpretation is that Wave D is in progress.
The key level I am watching is the previous high at 26,373.20.
If price breaks above 26,373.20, takes the liquidity resting above this high, and subsequently shows rejection/weakness, I will consider this as a potential buy-side liquidity sweep completing Wave D.
Following the completion of Wave D, the next expected phase would be Wave E.
Based on the current structure, I am watching the 23,070.15 area as an important potential Wave-E zone.
If the A-B-C-D-E triangle structure completes as anticipated, the larger structure could then transition toward Wave 5.
Key Levels
🔴 26,373.20 — Previous high / Buy-side liquidity
🟡 23,070.15 — Potential Wave-E zone
🔵 After A-B-C-D-E completion → Potential Wave 5
My approach is based on:
Elliott Wave + Liquidity Sweep + Key Levels + Price Confirmation
I am not trying to predict every move. I am interested in how price reacts when it reaches important liquidity and structural levels.
Level → Liquidity → Confirmation
Disclosure
I am not a SEBI-registered Investment Adviser or Research Analyst. This post represents my personal technical/chart analysis for educational and informational purposes only and should not be considered personalized investment advice, a recommendation to buy or sell securities, or a guarantee of future price movement. Please conduct your own research and make independent decisions according to your risk profile.
#NIFTY #ElliottWave #LiquiditySweep #TechnicalAnalysis #MarketStructure The Midpoint Nobody Watches: Equilibrium, Flip Zones, PatternsThis post is educational and observational in nature based on historical price action. It is not a forecast or a trading recommendation.
Flip Zone (Green)
A price level that once acted as resistance and, after being broken and sustained above, converted into support. This shift in role is what defines a flip zone.
Equilibrium Point
The midpoint calculated between the biggest swing low and the biggest swing high on the chart. This level divides the overall range into two equal halves and is often used as a reference point to gauge whether price is trading in the upper or lower half of a larger structural move.
Symmetrical Triangle Pattern
A consolidation pattern formed between converging lower highs and higher lows, compressing into a tighter range over time. In this case, the pattern formed directly between the flip zone and the equilibrium point, sitting within that broader structural context rather than in isolation.
The Bigger Picture
This chart brings together three layers of context, a flip zone marking a change in level behavior, an equilibrium point marking the midpoint of the larger swing, and a symmetrical triangle forming in the space between them. Studying where a pattern forms relative to the broader range it sits within, rather than looking at the pattern alone, offers a much deeper read of the chart's structure.  Long
Long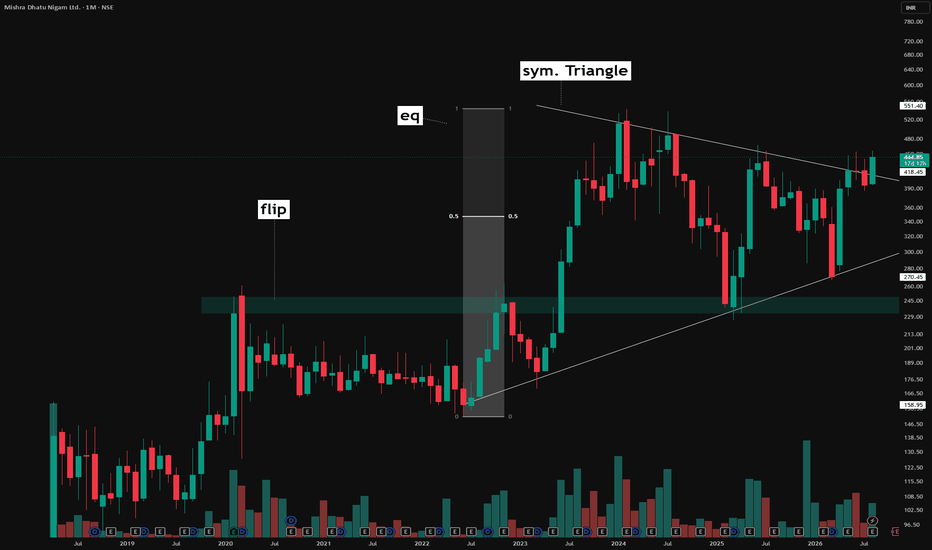
Bank Nifty Daily Chart Analysis: Ascending Triangle Formation
Pattern Overview
On the daily (1D) timeframe, the Bank Nifty index is currently consolidating within a classic Ascending Triangle pattern. This is generally considered a bullish continuation pattern, indicating a potential upward breakout after a period of consolidation.
Key Technical Observations:
Horizontal Resistance (Top Line): The upper trendline highlights a clear and stubborn resistance zone. The price has tested this ceiling multiple times but has faced consistent selling pressure, creating a flat top. This indicates a strong supply zone.
Ascending Support (Bottom Line): The lower trendline connects a series of higher lows. This is a strong bullish indicator, showing that buyers are stepping in at increasingly higher prices. The buying pressure is steadily building up, squeezing the price against the upper resistance.
Market Psychology:
The structure of this pattern reveals a tightening battle between buyers and sellers. While sellers are successfully defending the horizontal resistance, buyers are becoming more aggressive, refusing to let the price drop to previous lows. This upward pressure narrows the trading range and compresses volatility as the price approaches the apex of the triangle.
What to Watch For (Potential Scenarios):
Bullish Breakout: A decisive daily candle close above the horizontal resistance line, ideally accompanied by high volume, would confirm the breakout. This would signal that buyers have finally absorbed the supply, potentially leading to a sharp upward rally.
Pattern Invalidation: If the price faces rejection at the resistance and breaks below the ascending support line, the bullish setup becomes invalid. This could trigger a short-term correction or further sideways momentum.
Conclusion:
The index is currently in a tight squeeze, preparing for its next major move. Traders should watch closely for a high-volume breakout above the resistance zone before taking aggressive long positions, while maintaining strict risk management below the ascending trendline.
(Disclaimer: This analysis is for educational purposes only and does not constitute financial advice. Always perform your own due diligence before trading.)
 Long
Long
NIFTY 50: Bulls Absorbing Sell Pressure | ₹24,520 Holds, 25,100+NIFTY 50 – Bulls vs Bears: Pressure Building
Nifty has been showing a clear battle between selling pressure and dip-buying pressure over the last few sessions.
After the sharp move up, multiple rounds of selling have emerged, including strong bearish candles and short-term sell-offs. However, each meaningful decline has been met with buying interest around the ₹24,520–₹24,550 zone, suggesting that the bulls are continuing to absorb the selling pressure.
The recent price action is forming a converging structure, with the descending upper trendline representing the supply zone and the rising lower trendline showing continued support from buyers.
The repeated attempts by the bears to push the index lower have so far been absorbed by the bulls.
🎯 Bullish View
As long as ₹24,520 holds, my bullish view remains intact.
A sustained move above the upper resistance/trendline could trigger the next leg higher, with ₹25,100+ as the primary target zone.
⚠️ View Negation
₹24,520 is the key level to watch.
A decisive break and sustain below ₹24,520 would negate the current bullish view. In that case, the setup will need to be reassessed/revised based on the new price action.
📚 This analysis is shared strictly for learning and educational purposes and is not a buy/sell recommendation.  Long
Long
 Long
Long
AUROPHARMA Ascending Triangle Breakout📊 Aurobindo Pharma Ltd.: Daily Technical Snapshot – Ascending Triangle Breakout
📊 STWP Technical Analysis
________________________________________
MARKET STRUCTURE SNAPSHOT | NSE: AUROPHARMA | DAILY
Closing Price: 1,658.00 (+69.10 | +4.35%)
Core Trend: Uptrend
Market State: Ascending Triangle Breakout
Price Structure: Price has broken above the horizontal resistance zone of an Ascending Triangle, supported by a rising trendline, strong bullish candle and above-average volume. The breakout indicates an attempt to move into a higher trading range.
________________________________________
OPERATIONAL PRICE GRID & KEY REFERENCE LEVELS
Model Reference Level: 1,662.40
Hard Invalidation Level: 1,564.80
Structural Risk: 97.60 (5.87%)
Resistance Levels: R1 1,686.97 | R2 1,715.93 | R3 1,769.47
Support Levels: S1 1,604.47 | S2 1,550.93 | S3 1,521.97
Range Structure: Low 1,416.10 | High 1,769.47
Higher Timeframe Observation Zones: 1,716 | 1,769 | 1,850
________________________________________
MOMENTUM, PARTICIPATION & CPR DATA
Volume Profile: 2.00 Million Shares
Volume Character: High Relative Participation
Current Bias: BREAKOUT CONFIRMATION / BUY ON PULLBACKS
CPR State: Bullish Zone | CPR Sideways (Wide)
Today's CPR: Pivot 1,602.50 | Top 1,595.70 | Base 1,609.30
Tomorrow's CPR (Projected): Pivot 1,633.40 | Top 1,645.70 | Base 1,621.20
________________________________________
💡 STWP QUICK READ
Price has broken above an Ascending Triangle resistance.
Strong volume supports the breakout.
Buyers remain in control above the breakout zone.
Momentum remains firmly bullish, though extended.
Watch for sustained acceptance above the breakout area.
________________________________________
📚 EDUCATIONAL OBSERVATION
Aurobindo Pharma has delivered a notable Ascending Triangle breakout after several weeks of price compression. The pattern developed through a series of higher lows while price repeatedly encountered resistance around the same horizontal zone. This combination reflected increasing buying pressure as buyers gradually accepted higher prices.
The latest session has pushed price decisively above the upper boundary of the formation, accompanied by a strong bullish candle and increased participation. This gives the breakout greater technical significance compared with a move occurring on weak volume.
The overall technical picture suggests that buyers are attempting to establish a new higher trading range.
Momentum remains constructive. RSI at 65.27 indicates strong bullish momentum, while ADX at 27.03 suggests that the developing trend has meaningful strength. ROC at +8.22% confirms positive price acceleration, while the CCI at +233.75 reflects strong buying pressure. The Stochastic at 97.07 shows highly extended momentum, which means short-term consolidation or pullbacks remain possible even while the broader structure remains bullish.
Volume expanded to 2.00 million shares, approximately double the 20-day average of 1.00 million shares, representing a participation ratio of around 2.00x. Such above-average volume indicates increased market participation and adds credibility to the Ascending Triangle breakout.
The projected Central Pivot Range (CPR) has shifted higher, with tomorrow's Pivot at 1,633.40 and the projected CPR extending from 1,621.20 to 1,645.70. The upward shift in CPR supports the improving price structure, although sustained acceptance above the breakout zone remains important.
Immediate attention remains on 1,686.97 and 1,715.93, followed by 1,769.47 as the next major resistance zone. Sustained trading above the breakout area could strengthen the developing trend and bring higher-timeframe observation zones into focus. On the downside, 1,604.47 becomes the first important support, while 1,564.80 remains the structural invalidation level.
________________________________________
🏢 BUSINESS & FUNDAMENTAL UPDATE
Aurobindo Pharma remains a major Indian pharmaceutical company with a strong presence across generic medicines, active pharmaceutical ingredients (APIs), specialty products and international markets. Its diversified product portfolio, manufacturing capabilities and global presence provide a constructive long-term business backdrop. Continued focus on complex generics, specialty pharmaceuticals and international expansion remains important to the company's growth trajectory. Aurobindo Pharma delivered a strong Q1 FY27, with consolidated revenue rising approximately 16% YoY to 9,150 crore and net profit increasing 25.2% YoY to 1,032 crore. EBITDA grew around 20%, with the EBITDA margin improving to approximately 21%. The performance was supported by broad-based growth, particularly across its Europe and US businesses. Management also maintained a double-digit revenue growth outlook for FY27, while continuing investments in biosimilars and specialty products. The strong quarterly performance provides a constructive fundamental backdrop to the stock's current technical breakout.
________________________________________
📖 Educational Note
The Ascending Triangle generally develops when price repeatedly encounters resistance at a similar level while successive lows move higher. This reflects increasing demand and compression between buyers and sellers. However, the pattern becomes more meaningful when the breakout is accompanied by strong participation and sustained price acceptance above resistance. Support and resistance levels should be treated as observation zones rather than predictive targets. Chart patterns, price action, momentum indicators, volume analysis and CPR are educational tools that help market participants understand evolving market structure within a disciplined risk-management framework.
________________________________________
⚠️ Disclaimer
This analysis is provided strictly for educational and informational purposes.
This is not financial, investment or trading advice and should not be considered a recommendation to buy or sell any security.
Stock market investments are subject to market risks, including the possible loss of capital.
Past performance, historical observations, chart patterns and technical indicators do not guarantee future results.
Please conduct your own research and consult a SEBI-registered investment adviser before making investment decisions.
STWP assumes no responsibility or liability for any financial loss arising directly or indirectly from the use of this information.
 Long
Long