Triangle
ESCORTS is very bearish after the breakdown
DESCENDING TRIANGLE :
Due to the breakdown from descending triangle pattern the stock has become very bearish till the target price is reached
TESTED STRONG SUPPORT-RESISTANCE ZONE :
The stock has reversed from strong resistance level recently which was earlier tested several times as a strong support
TARGET LEVEL :
the price has a target level of 3196
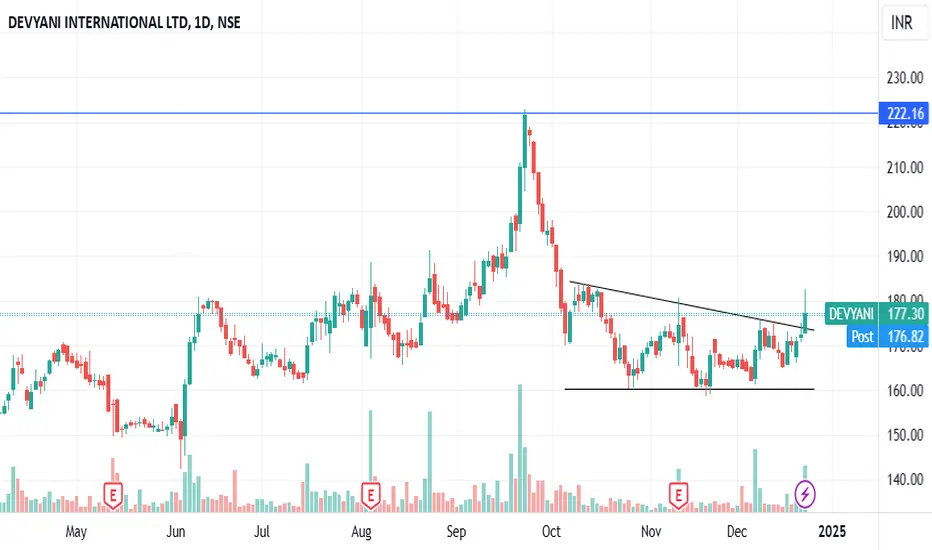
Bullish Breakout on Indian Renewable Energy LtdThe stock of Indian Renewable Energy (NSE: INDIANRE) is showing strong bullish momentum, with a breakout above the descending trendline that has been acting as resistance for several weeks.
Key observations:
Trendline Breakout: The price has successfully closed above the descending trendline, signaling a potential trend reversal.
EMA Support: The stock is trading above the 200 EMA (currently at ₹190.05), confirming a shift in long-term sentiment to bullish.
Volume Spike: A significant
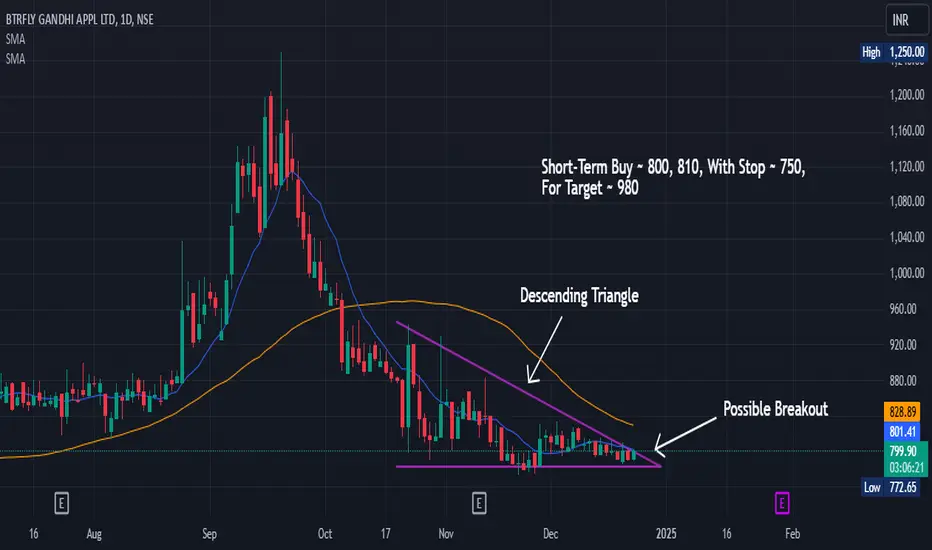
2 Potential Swing trading stocks for 23 December MarketsI daily make educational content videos for swing / positional trading
Both are Potential swing trading ideas that are not active yet. I have explained the setup, pattern, and line-making behind them with a solid plan. Let's see if the plan gets activated.
POONAWALLA : bearish after breaking out of descending triangle
BREAKOUT from DESCENDING TRIANGLE pattern -
price has recently broken out of descending triangle pattern with strong confirmation ie large red candlestick
REVERSAL from 50D & 100D SMA MULTIPLE times -
price has also reversed from 50D & 100D sma several times over the past few weeks. Also 50D & 100D have come very close to each other while price was taking reversal from them indicating even more strong downward pressure
TARGET -
307.05
SBI : Consolidation in a TriangleSBI is consolidating in a Triangle Pattern.
It has 2 Options
Breakout Above : Close above 860 then buy it with stoploss of 820 tgt 1030
Breakdown Below : Close below 770 then sell it with stoploss of 830 tgt 605
in current scenario where Banknifty is struggling to close above 51350 and
very likely to breakdown.
In this SBI will not be spared n it will go along down with it.
wait for the decisive close.
Put Stoploss on closing basis.
(In Trading Time it may go above/below stoploss But c
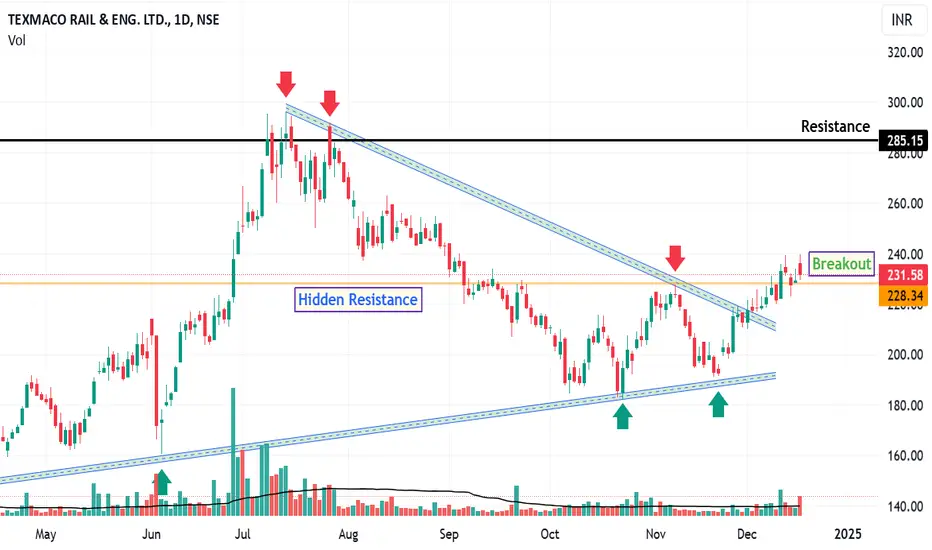
TEXRAIL: Technical Signals Point to 20% PotentialThe chart provides a comprehensive overview of the key breakout levels and potential upward movement scenarios.
symmetrical triangle Breakout
RSI is above 60 and showing an upward trend
Surpass the hidden resistance and establish it as support
Disclaimer: The information contained in this technical analysis report is intended solely for informational and educational purposes. It should not be interpreted as financial advice or a recommendation to buy or sell any security. I
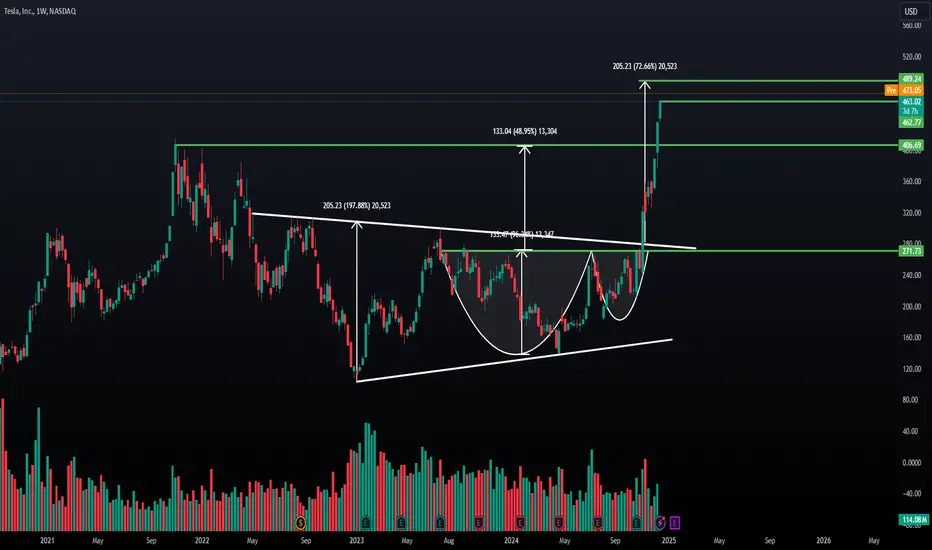
TSLA - WKLY- CnH-Symmetrical Triangle This chart shows Tesla's price on a weekly timeframe with key technical features:
1. **Cup and Handle Pattern**:
- A bullish reversal pattern formed over the past months, with two rounded bottoms resembling a "cup" shape and a minor consolidation area.
- The breakout above the resistance level confirms the pattern.
2. **Measured Move Targets**:
- **First Target**: $406.69, reached with a 48.95% move.
- **Second Target**: $489.24 for symmetrical triangle reflecting a 72.66% r
CHALETHi,
Ascending triangle has been break with high volume so chances is very high that price will move upper side.
below day closing of previous swing low is Stop loss
This idea is for Educational purpose and paper trading only. Please consult your financial advisor before investing or making any position. Facts or Data given above may be slightly incorrect. We are not SEBI registered.
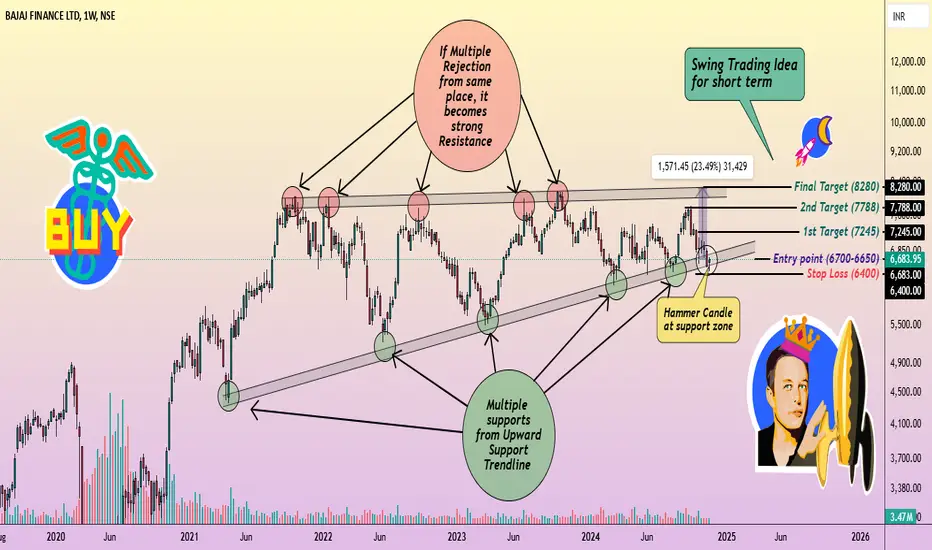
Hammer Candlestick Pattern on support zone in Bajaj FinanceHello Everyone, i hope you all will be doing good in your life and your trading as well. Today i have brought a short term swing Trading Idea in Bajaj finance. Stock have formed hammer candlestick pattern on perfect support zone, Bajaj finance stock is trading inside the triangle pattern and chances are very high that we can see this towards upper resistance of triangle pattern which i plotted on chart above. Overall i feel stock should rise from here and no double over the period if we can see
Analyzing morepen laboratories _12th DEC 24BULLISH BREAKOUT :
TECHNICAL OVERVIEW - The stock chart of Morepen Laboratories Ltd. on a daily timeframe, showing a breakout from a descending triangle pattern. This technical breakout, accompanied by higher trading volumes, suggests a bullish momentum in the stock price, as the resistance line has been breached decisively. The 50-day Simple Moving Average (SMA) below the price indicates a positive trend, further supporting the likelihood of upward movement. Traders may consider this breakout