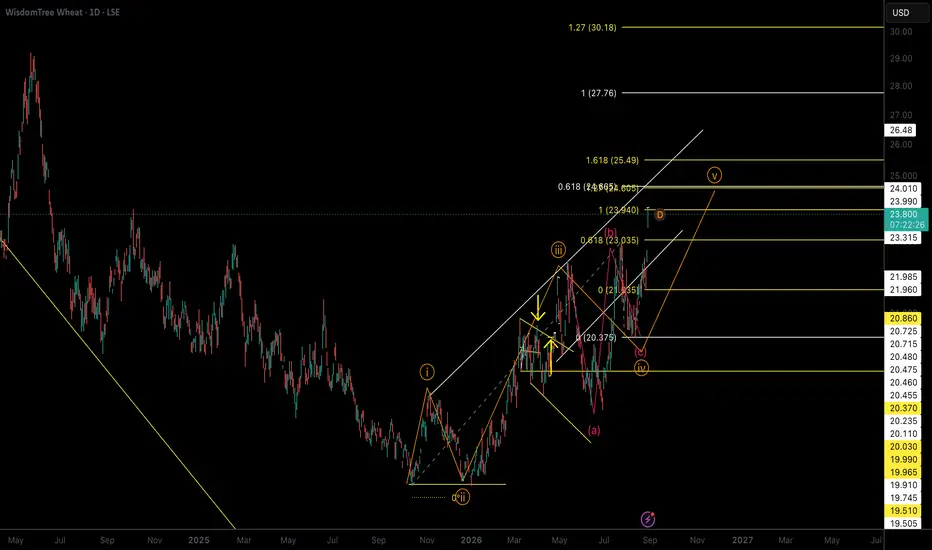
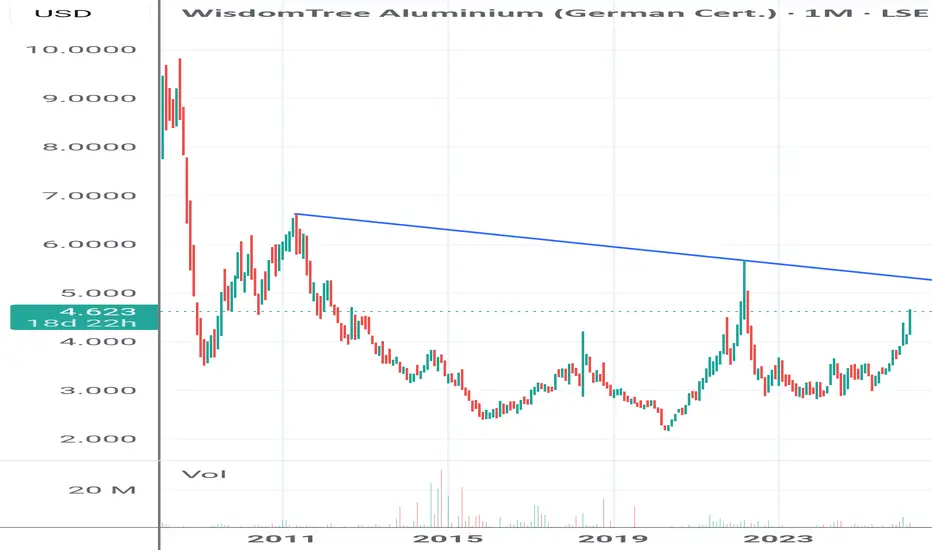
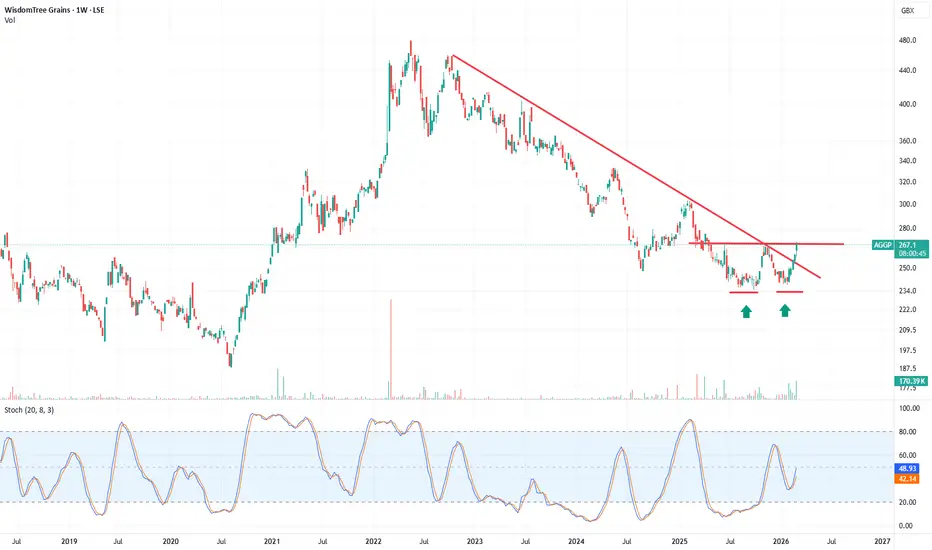
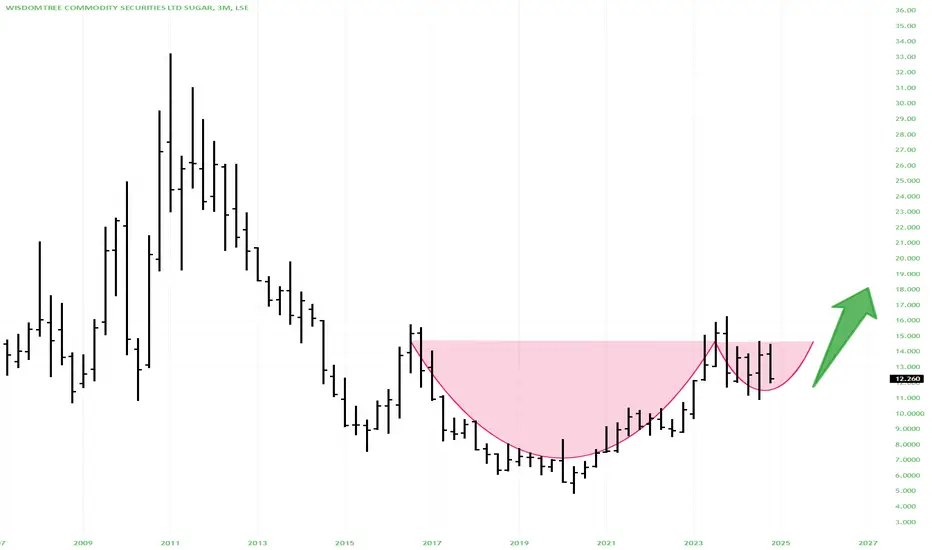
$WEATOverall AMEX:WEAT very bullish the real tell was that 4th wave as a running flat c=0.618 a (not shown fro clarity but c pulling up well short of 100% ext of a )so 5th wave standard target 24.5 but that may only be one of 5 so pullbacks to be bought . Fits in well with macro picture Hormuz fertiliz
Key stats
Fund info
Home page
Inception date
Sep 27, 2006
Structure
Limited Recourse Debt Obligations
Replication method
Synthetic
Primary advisor
WisdomTree Management Jersey Ltd.
ISIN
GB00B15KXV33
FIGI
BBG000R4CNQ9
Identifiers
ISIN GB00B15KXV33
WisdomTree WTI Crude Oil is designed to enable investors to gain an exposure to a total return investment in crude oil by tracking the BloombergrnCrude Oil Subindex (the Index) and providing a collateral yield.
Classification
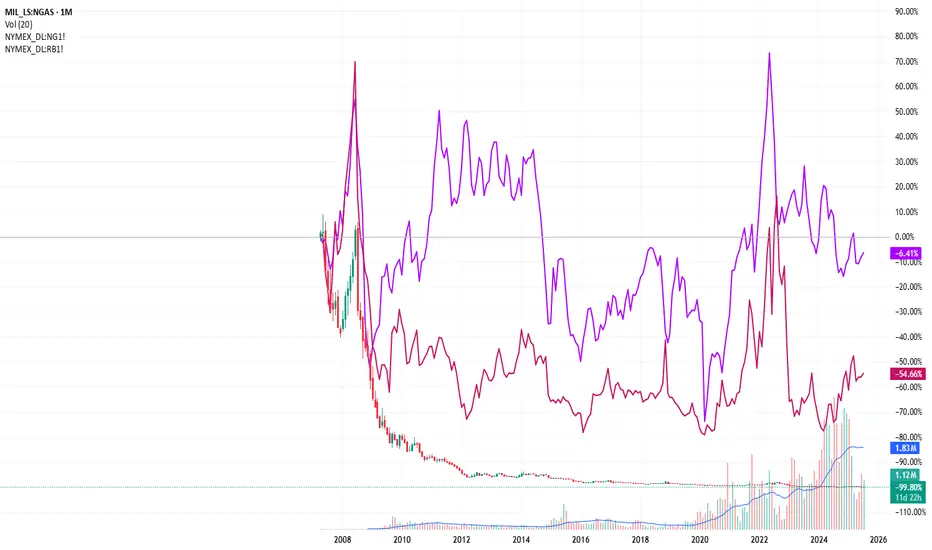
The New Era of Natural Gas: How AI Infrastructure and Global SupTechnical Analysis
1. Harmonic Pattern Recognition:
The AB=CD Setup
The primary structural logic is based on the AB=CD harmonic pattern, which is used to identify potential trend exhaustion and reversal points.
Point A to B: This represents the initial impulsive move upward from the local
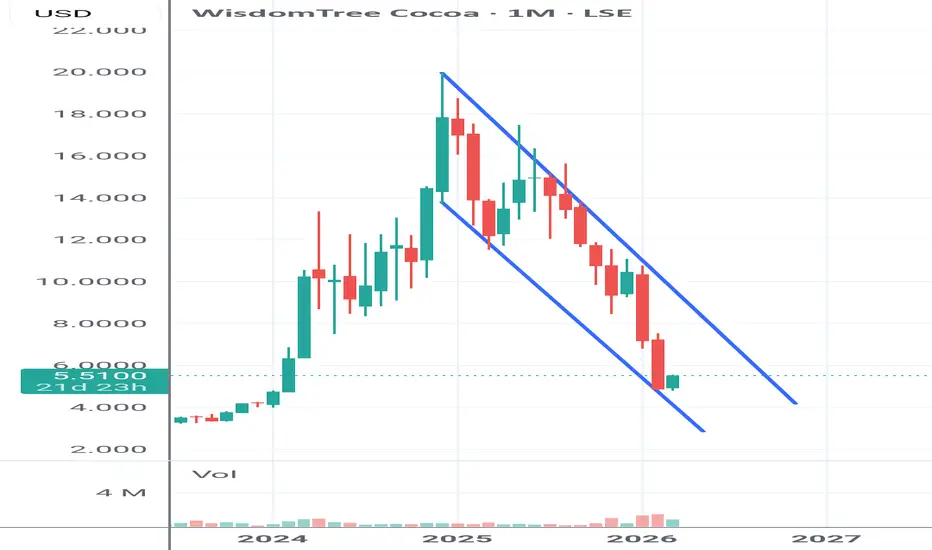
Cocoa - Long - WisdomTree Cocoa (Ticker: COCO)WisdomTree Cocoa (Ticker: COCO)
Description: This is the primary unleveraged ETC for cocoa exposure.
Listings: Available on the London Stock Exchange (LSE) in USD and the Borsa Italiana (Milan) in EUR.
Structure: A synthetic ETC backed by swaps that tracks the Bloomberg Cocoa Subindex.
Down from it
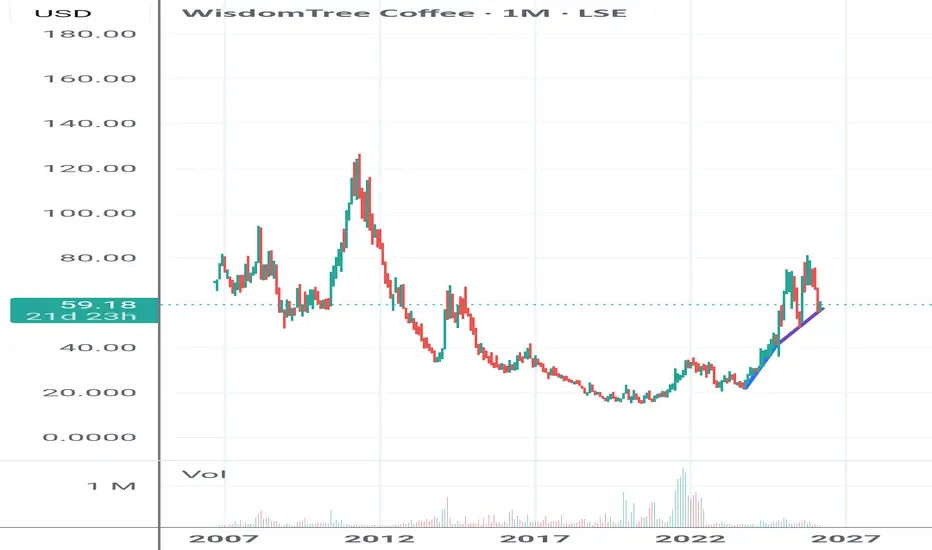
Coffee - Long - WisdomTree Coffee (Ticker: COFF)WisdomTree Coffee (Ticker: COFF)
Primary Listing: London Stock Exchange (LSE) (USD).
Alternative Listings: Also traded on Borsa Italiana and Euronext (often under ticker OD7B in EUR).
Description: This is the most common unleveraged ETC for coffee exposure, tracking the Bloomberg Coffee Subindex.
G
time for soft commodities?all the countries have alternative plans to deal with the moves in oil prices but not much to do when the fertiliser markets get squeezed. on top of the move in oil prices the increasing fertiliser cost will have to push the soft commodity prices higher at least to a level where farmers can keep on
See all ideas
Summarizing what the indicators are suggesting.
Oscillators
Neutral
Oscillators
Neutral
Summary
Neutral
Summary
Neutral
Summary
Neutral
Moving Averages
Neutral
Moving Averages
Neutral
Displays a symbol's price movements over previous years to identify recurring trends.
Frequently asked questions
An exchange-traded fund (ETF) is an investment product that holds a basket of assets such as stocks, bonds, futures, or other instruments, and trades on an exchange like a regular stock.
Why investors use ETFs:
– Easy way to gain exposure to sectors like stocks, bonds, real estate, or crypto
– Lower barrier to entry compared to buying individual assets
– Can help reduce volatility through diversification
Explore the largest ETFs: they are considered the most trusted and secure and will help you start your journey on the ETF markets.
Why investors use ETFs:
– Easy way to gain exposure to sectors like stocks, bonds, real estate, or crypto
– Lower barrier to entry compared to buying individual assets
– Can help reduce volatility through diversification
Explore the largest ETFs: they are considered the most trusted and secure and will help you start your journey on the ETF markets.
Markets don't sleep, here's what's going on with CRUD at the moment:
– REG - WisdomTree Comm Secs - Publication of a Prospectus
– REG - WisdomTree Comm Secs - Half-year Financial Report
– REG - WisdomTree Comm Secs - Update to credit support arrangements
See more updates in real-time with our News Flow.
– REG - WisdomTree Comm Secs - Publication of a Prospectus
– REG - WisdomTree Comm Secs - Half-year Financial Report
– REG - WisdomTree Comm Secs - Update to credit support arrangements
See more updates in real-time with our News Flow.
CRUD net asset value (NAV) is 15.65 EUR. It represents the total value of the fund's assets less liabilities.
Other key metrics:
– CRUD AUM — 523.50 M EUR
– CRUD discount/premium to NAV — 0.15%
– CRUD expense ratio — 0.49%
Explore more funds in our list of largest ETFs.
Other key metrics:
– CRUD AUM — 523.50 M EUR
– CRUD discount/premium to NAV — 0.15%
– CRUD expense ratio — 0.49%
Explore more funds in our list of largest ETFs.
To put today's price into context, compare CRUD's performance across different time periods:
– 1 day — −3.11%
– 1 week — −11.90%
– 1 month — −2.59%
CRUD's all-time low was 1.672 EUR on Apr 28, 2020, while its all-time high was 55.890 EUR on Jul 4, 2008.
For a deeper look at market activity, explore the ETF Heatmap and the CRUD price chart.
– 1 day — −3.11%
– 1 week — −11.90%
– 1 month — −2.59%
CRUD's all-time low was 1.672 EUR on Apr 28, 2020, while its all-time high was 55.890 EUR on Jul 4, 2008.
For a deeper look at market activity, explore the ETF Heatmap and the CRUD price chart.
The safest way to buy CRUD is through a reliable broker. Create an account, fund it, and place a buy order.
You can trade CRUD directly from TradingView:
– Choose a broker: Explore our supported trading partners and pick one that fits your needs
– Compare options: View available brokers side by side to evaluate fees and features
– Connect your account: Open Supercharts, click “Trade”, select your exchange, and log in
– Start trading: Place orders directly from the chart
Tip: If you’re new to trading, try paper trading first — it lets you practice strategies in real market conditions without risking funds.
You can trade CRUD directly from TradingView:
– Choose a broker: Explore our supported trading partners and pick one that fits your needs
– Compare options: View available brokers side by side to evaluate fees and features
– Connect your account: Open Supercharts, click “Trade”, select your exchange, and log in
– Start trading: Place orders directly from the chart
Tip: If you’re new to trading, try paper trading first — it lets you practice strategies in real market conditions without risking funds.
WisdomTree WTI Crude Oil expense ratio is 0.49%. It represents the annual cost of managing the fund, expressed as a percentage of its assets.
Other key metrics:
– CRUD AUM — 523.50 M EUR
– CRUD NAV — 15.65 EUR
– CRUD discount/premium to NAV — 0.15%
Explore more ETFs with highest expense ratio and find even more stats in the ETF Screener.
Other key metrics:
– CRUD AUM — 523.50 M EUR
– CRUD NAV — 15.65 EUR
– CRUD discount/premium to NAV — 0.15%
Explore more ETFs with highest expense ratio and find even more stats in the ETF Screener.
Before making an investment decision, it's important to understand how the ETF works and whether it aligns with your goals and risk tolerance. Consider factors such as:
– The ETF's holdings
– Whether it is passively or actively managed
– Whether it uses leverage
– Its costs, performance, and other characteristics relevant to your strategy
You can also use technical analysis to assess current market conditions. Our summary Technical Ratings for CRUD are:
– Today — sell
– 1 week — buy
– 1 month — buy
For a deeper analysis, explore other CRUD technicals and follow the latest ETF news.
– The ETF's holdings
– Whether it is passively or actively managed
– Whether it uses leverage
– Its costs, performance, and other characteristics relevant to your strategy
You can also use technical analysis to assess current market conditions. Our summary Technical Ratings for CRUD are:
– Today — sell
– 1 week — buy
– 1 month — buy
For a deeper analysis, explore other CRUD technicals and follow the latest ETF news.
CRUD trades at a premium (0.15%).
Premium/discount to net asset value (NAV) expresses the difference between the ETF's price and its NAV value.
– A positive percentage indicates a premium, meaning the fund trades at a higher price than the calculated NAV.
– A negative percentage indicates a discount, suggesting the ETF trades at a lower price than NAV.
You can find more funds in the list of highest premium to NAV.
Premium/discount to net asset value (NAV) expresses the difference between the ETF's price and its NAV value.
– A positive percentage indicates a premium, meaning the fund trades at a higher price than the calculated NAV.
– A negative percentage indicates a discount, suggesting the ETF trades at a lower price than NAV.
You can find more funds in the list of highest premium to NAV.
CRUD follows the Bloomberg WTI Crude Oil Multi-Tenor 4 Week TR.
ETFs usually track some benchmark seeking to replicate its performance and guide asset selection and objectives.
Indices usually act as such benchmarks by tracking a group of companies or specific sectors, giving a broad view of market performance.
ETFs usually track some benchmark seeking to replicate its performance and guide asset selection and objectives.
Indices usually act as such benchmarks by tracking a group of companies or specific sectors, giving a broad view of market performance.
The fund's management style is passive, aiming to replicate the performance of the Bloomberg WTI Crude Oil Multi-Tenor 4 Week TR by holding the same assets in similar proportions.
What it means:
– Index tracking: Mirrors the composition and weight of the underlying index
– Low turnover: Fewer trades compared to active funds
– May be more cost-efficient: Passive approach typically results in lower fees (expense ratio)
Combine this knowledge with other metrics:
– CRUD AUM — 523.50 M EUR
– CRUD NAV — 15.65 EUR
– CRUD expense ratio — 0.49%
Explore more details in the Profile section.
What it means:
– Index tracking: Mirrors the composition and weight of the underlying index
– Low turnover: Fewer trades compared to active funds
– May be more cost-efficient: Passive approach typically results in lower fees (expense ratio)
Combine this knowledge with other metrics:
– CRUD AUM — 523.50 M EUR
– CRUD NAV — 15.65 EUR
– CRUD expense ratio — 0.49%
Explore more details in the Profile section.
Today, CRUD trades at 15.064 EUR.
For broader market analysis, dive into the technicals on the CRUD price chart and read the latest CRUD news:
– REG - WisdomTree Comm Secs - Publication of a Prospectus
– REG - WisdomTree Comm Secs - Half-year Financial Report
– REG - WisdomTree Comm Secs - Update to credit support arrangements
For broader market analysis, dive into the technicals on the CRUD price chart and read the latest CRUD news:
– REG - WisdomTree Comm Secs - Publication of a Prospectus
– REG - WisdomTree Comm Secs - Half-year Financial Report
– REG - WisdomTree Comm Secs - Update to credit support arrangements
CRUD assets under management (AUM) is 523.50 M EUR. It represents the total market value of all assets held by the fund.
Other key metrics:
– CRUD NAV — 15.65 EUR
– CRUD expense ratio — 0.49%
– CRUD premium/discount to NAV — 0.15%
Explore more funds in our list of largest ETFs. For deeper analysis, check the ETF Screener.
Other key metrics:
– CRUD NAV — 15.65 EUR
– CRUD expense ratio — 0.49%
– CRUD premium/discount to NAV — 0.15%
Explore more funds in our list of largest ETFs. For deeper analysis, check the ETF Screener.
CRUD fund flows account for −720.23 M EUR, showing the net amount of money entering or leaving the fund over 1 year. Many traders use it to get insight into investors' sentiment and evaluate whether it's time to buy or sell the fund.
Other key metrics:
– CRUD AUM — 523.50 M EUR
– CRUD discount/premium to NAV — 0.15%
– CRUD expense ratio — 0.49%
For broader market analysis, read the latest market news and read the ETF trading ideas.
Other key metrics:
– CRUD AUM — 523.50 M EUR
– CRUD discount/premium to NAV — 0.15%
– CRUD expense ratio — 0.49%
For broader market analysis, read the latest market news and read the ETF trading ideas.
No, CRUD isn't leveraged, meaning it doesn't use borrowings or financial derivatives to magnify the performance of the underlying assets or index it follows.
No, CRUD doesn't pay dividends to its holders.
CRUD shares are issued by WisdomTree, Inc.
CRUD started trading on Sep 27, 2006. The launch date marks the fund's first day on the exchange and the start of its publicly available price history.
The age of a fund can be useful when evaluating its track record, as older funds typically provide more historical data for analyzing performance across different market conditions.