GLAND has explosively broken out of a multi-year macro base1. The Macro Perspective: The Deep Washout and Multi-Year Accumulation
I am taking a LONG bias on Gland Pharma Limited (GLAND) on the weekly (1W) timeframe.
When analyzing pure market structure, the most powerful and sustainable secular trends are born from grueling, exhaustive accumulation phases. Look at the massive structural development spanning this entire chart. After a massive historical markdown phase, the stock spent over two years locked in a brutal macro accumulation base. This prolonged sideways grinding acts as a massive washing machine—it completely exhausts and washes out weak, impatient retail traders, allowing strong-handed institutional buyers to quietly absorb all available liquidity at heavily discounted prices.
2. The Educational Setup: The Ultimate Structural Ceiling and Launchpad
To understand the sheer technical validity of this macro breakout, look at the precise mechanics aligning right before the launch:
The Absolute Concrete Ceiling: By adjusting our horizontal resistance line to the absolute peak of the structural highs at 2,094.65, we define the ultimate macro battlefield. Sellers repeatedly swatted the price down from this exact pivot point over the last two years, creating a heavy, undeniable historical supply zone.
The 20 SMA Defense: Notice how the price behaved beneath this ultimate ceiling over the last few months. Instead of suffering another deep collapse, institutional buyers aggressively stepped in, reclaiming the weekly 20 SMA (the middle blue line of your Bollinger Bands) and establishing a series of higher lows. By chopping sideways right below the massive resistance and letting the moving average catch up, the stock created a perfect, tightly coiled structural launchpad.
3. Current Price Action: Volatility Expansion and Pure Markup
Look at the most recent weekly candle on the far right. The high-level pressure cooker has absolutely exploded. Buyers have stepped in with massive conviction, printing a powerhouse of a green weekly expansion candle backed by a heavy institutional volume spike. This single vertical thrust has effortlessly obliterated the 2,094.65 multi-year ceiling, pushing the price well into the 2,300s. Furthermore, the price has violently pierced and is riding entirely outside the upper Bollinger Band, snapping the bands wide open. By decisively clearing this ultimate accumulation block, GLAND has officially initiated a highly aggressive new secular markup phase into pure price discovery.
4. The Trade Plan: Entries, Targets, and Risk Management
Entry Strategy: Macro momentum is exceptionally strong right now near 2,331.00. Chasing a massive vertical weekly candle closing entirely outside the upper Bollinger Band always carries a severe risk of an agonizing short-term mean-reversion pullback as the stock naturally breathes. The highest-probability, lowest-risk entry involves stepping down to a daily timeframe and waiting for the initial vertical excitement to cool off. Look to place limit orders to catch a potential structural pullback to perfectly retest the 2,050.00 to 2,120.00 broken resistance zone. Letting old historical resistance prove itself as a concrete new support floor offers a phenomenal risk-to-reward ratio.
Take Profit (Targets): Because the stock is breaking out of a massive multi-year structure, we use a measured move strategy based on the depth of the macro base. By taking the core depth of this consolidation (roughly 800 points from the ~1,300 structural floors up to the 2,094.65 absolute ceiling) and projecting it upward from the breakout point, our primary structural macro target sits comfortably in the 2,850.00 to 2,900.00 zone. The ultimate psychological round number of 2,500.00 will act as the immediate macro magnet.
Invalidation (Stop Loss): An explosive macro breakout thesis is completely invalidated if the stock crashes back deep inside the old consolidation boundaries. A hard stop loss should be placed safely below the breakout zone and the rising weekly 20 SMA, around the 1,750.00 to 1,850.00 level. A definitive weekly close completely back below the moving average would confirm a massive failed breakout and a severe macro bull trap.
5. Time Horizon:
Because this technical setup is built on a 1-Week chart capturing a massive structural phase transition and an ultimate macro base breakout, this is a medium-to-longer-term position trade designed to capture a secular markup phase over the coming months. Let the macro trend run!  Long
Long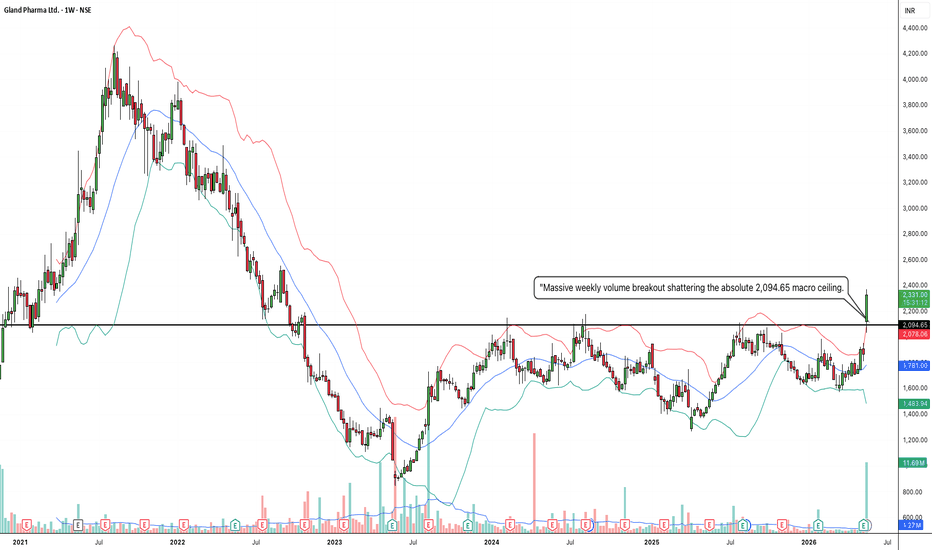
AVALONhas explosively broken out of a massive ascending triangle1. The Macro Perspective: The Institutional Staircase
I am taking a LONG bias on Avalon Technologies Limited (AVALON) on the weekly (1W) timeframe.
When analyzing pure market structure, the most powerful and sustainable breakouts occur in alignment with an established macro trend. Look at the massive structural development on this chart. The defining feature is the steep, unbroken ascending trendline (the lower solid black line). Every single time the stock experienced a pullback, institutional buyers aggressively stepped in exactly at this dynamic support line. They refused to let the secular bull trend break, consistently printing higher lows and indicating massive, systemic accumulation over the long term.
2. The Educational Setup: The Squeeze and The Ceiling
To understand the sheer strength of this current breakout, look at how the price systematically squeezed historical resistance to form a textbook "Ascending Triangle":
The Concrete Ceiling: The stock's recovery was heavily capped by a formidable horizontal resistance line at 1,264.45. Sellers repeatedly defended this extreme high, creating a clear supply ceiling.
The High-Level Squeeze: Notice how the pullbacks became shallower over time, riding the ascending trendline and the 20 SMA (the middle blue line of your Bollinger Bands). By pressing up against the flat horizontal ceiling while simultaneously forming higher lows, the stock acted like the ultimate pressure cooker. It gracefully transferred shares from impatient retail traders to strong-handed institutional buyers, storing immense kinetic energy as the structure tightened.
3. Current Price Action: Riding the Upper Band into Blue Sky
Look at the most recent weekly candles on the far right. The high-level pressure cooker has absolutely exploded. Buyers have effortlessly shattered the 1,264.45 macro ceiling with a massive, full-bodied green momentum thrust, pushing the price well past the 1,400 mark. Furthermore, notice how the price has violently pierced the upper Bollinger Band, forcing the bands to rapidly expand upward. By decisively clearing this extreme resistance zone, AVALON has officially entered "Blue Sky Territory" (pure price discovery). All historical overhead supply has been completely eliminated.
4. The Trade Plan: Entries, Targets, and Risk Management
Entry Strategy: Momentum is exceptionally strong right now near 1,464.40. Chasing a massive vertical expansion candle that is riding outside the weekly Bollinger Bands always carries a higher risk of an immediate intraday or daily mean-reversion pullback as the stock breathes. The highest-probability, lowest-risk entry involves stepping down to a daily timeframe and waiting for the dust to settle. Look to place limit orders to catch a potential structural pullback to perfectly retest the 1,260.00 to 1,300.00 breakout zone. Letting that heavy historical resistance prove itself as a new, indestructible support floor offers a phenomenal risk-to-reward ratio.
Take Profit (Targets): Because the stock is breaking out of a massive macro structure into pure price discovery, we use measured targets based on the depth of the pattern. By taking a conservative depth of the ascending triangle (roughly 600+ points from the ~646 mid-base up to the 1,264.45 ceiling) and projecting it upward from the breakout line, our primary structural macro target sits comfortably in the 1,850.00 to 1,900.00 zone. The immediate psychological milestone will be the 1,500.00 mark.
Invalidation (Stop Loss): A trade thesis is only valid if the new market structure holds. A hard stop loss should be placed safely below the breakout line and the rising 20 SMA, around the 1,100.00 to 1,150.00 level. A definitive weekly close completely back inside the triangle and breaking below the ascending trendline would invalidate the immediate continuation thesis and signal a severe macro bull trap.
5. Time Horizon:
Because this technical setup is built on a 1-Week chart capturing a massive structural phase transition and volatility expansion, this is a medium-to-longer-term position trade designed to capture the explosive new markup phase. Let the new trend run!  Long
Long
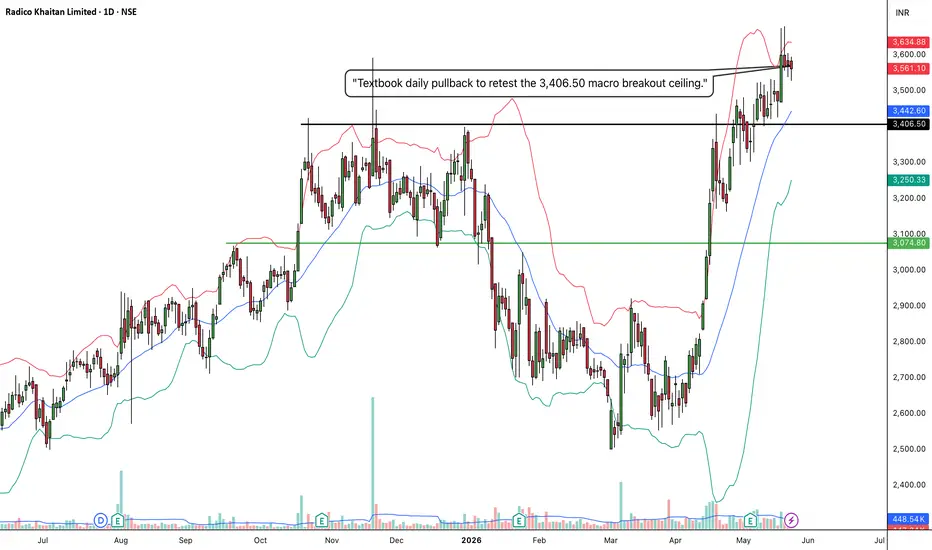
RADICO: Daily Break & Retest1. The Macro Perspective: The Massive Accumulation Cup
I am taking a LONG bias on Radico Khaitan Limited (RADICO) on the daily (1D) timeframe.
When analyzing pure market structure, sustainable long-term trends do not move in a straight line; they breathe through cycles of expansion and compression. Look at the extensive structural development displayed across Screenshot 2026-05-23 at 17.07.29.jpg. After a major markup phase that topped out in late 2025, the stock underwent an extensive corrective digestion phase, dropping down toward the 2,500–2,600 area. This deep correction washed out weak retail hands and allowed institutional buyers to absorb liquidity at a steep discount. Over the last few months, the stock has systematically carved out a massive rounding recovery, marching back up the right side of the base to challenge key historical supply.
2. The Educational Setup: Neckline Clearance and Volatility Squeeze
To understand the technical validity behind this massive breakout structure, we examine the clear horizontal parameters and dynamic indicators acting across the chart:
The Major Resistance Ceiling: The absolute horizontal line to watch is the solid black line drawn at 3,406.50. This level has historically acted as a major roadblock where sellers aggressively blocked further upward expansion, establishing a key macro neckline.
The Bollinger Band Springboard: Notice how the price action behaved leading up to the breakout. As the price climbed back to the 3,406.50 ceiling, the Bollinger Bands expanded and the price began riding the upper band. Following that initial vertical surge, the stock has entered a tight consolidation phase, allowing the rising daily 20 SMA (the middle blue line of your Bollinger Bands, currently near 3,442.60) to catch up and act as a dynamic cushion.
3. Current Price Action: The Ultimate Retest Confirmation
Look closely at the most recent daily candles on the far right of the chart. After an explosive momentum thrust that launched the price to local highs near 3,634.88, the stock is executing a highly controlled, shallow pullback. To amateur retail traders, these minor red candles look like a failed rally. To structural price action traders, this is a textbook "Break and Retest" pattern. The stock is pulling back to perfectly test the 3,406.50 breakout line and the daily 20 SMA from above. By holding its ground here, that old, heavy historical resistance is officially being flipped into a brand-new, indestructible structural launchpad.
4. The Trade Plan: Entries, Targets, and Risk Management
Entry Strategy: We are currently sitting directly inside the highest-probability "golden entry" zone. Chasing the initial vertical breakout candle is always dangerous due to mean-reversion risks, which is exactly why we wait for pullbacks like this. The lowest-risk entry involves scaling into long positions within the current 3,400.00 to 3,460.00 digestion range, looking for a strong daily reversal candle to confirm that buyers are aggressively defending this newly claimed support floor.
Take Profit (Targets): Because the stock is clearing a major macro base to target fresh multi-year highs, we use a measured move strategy. By taking the depth of the rounding base (roughly 850 points from the ~2,550 floor up to the 3,406 breakout neckline) and projecting it upward, our primary structural macro target sits comfortably in the 4,200.00 to 4,250.00 zone over the coming weeks. Near-term psychological targets rest at 3,800.00 and 4,000.00.
Invalidation (Stop Loss): A break-and-retest thesis is completely invalidated if the price fails to defend its new floor and slips back into the core of its older base. A hard stop loss should be placed safely below the recent swing low and the green structural line, specifically around the 3,040.00 to 3,080.00 zone. A definitive daily close completely back below 3,050 would act as a major warning sign of a failed macro breakout and a severe bull trap.
5. Time Horizon:
Because this technical setup is engineered on a 1-Day chart capturing a clean range breakout and an immediate structural retest, this is a high-alpha swing trade designed to capture a rapid momentum continuation over the coming days and weeks. Let the markup phase run!  Long
Long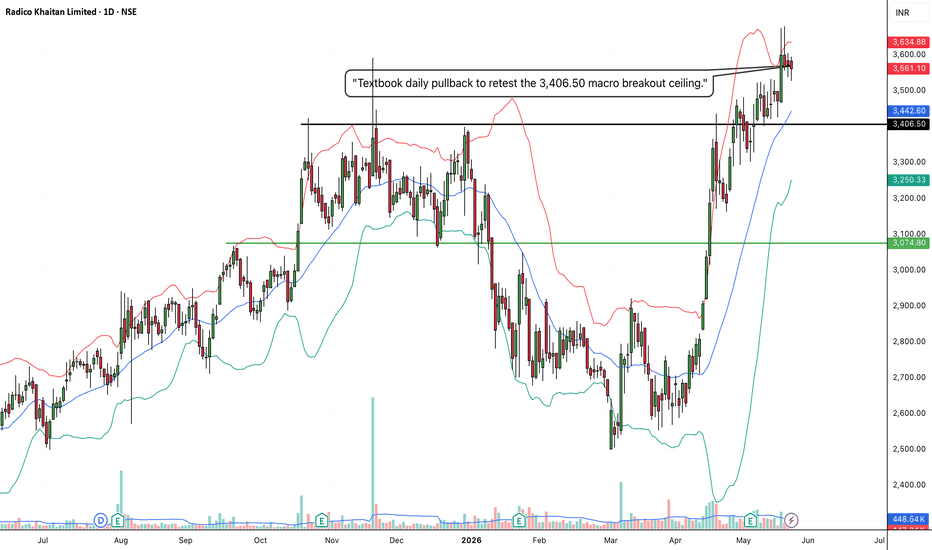
SHILPAMED: Monthly Macro Base Breakout1. The Macro Perspective: The Multi-Year Consolidation Base
I am taking a LONG bias on Shilpa Medicare Limited (SHILPAMED) on the absolute macro monthly (1M) timeframe.
When analyzing pure market structure on a monthly chart, we are looking at the footprint of long-term institutional accumulation. Look at the staggering structural development displayed across Screenshot 2026-05-26 at 14.44.51.jpg. After a major rally through mid-2024, the stock entered a broad, multi-year horizontal range. This corridor has been rigidly bounded by a rock-solid accumulation floor at 288.85 and a formidable overhead resistance ceiling at 471.55. This multi-year consolidation served as a massive liquidity vacuum, thoroughly exhausting weak retail hands while strong-handed institutional portfolios methodically absorbed all floating supply.
2. The Educational Setup: Dynamic Support and Volatility Compression
To understand the absolute technical validity behind this macro breakout, look closely at how perfectly the price structure interacted with its core boundaries right before launching:
The 20 SMA Cushion: Notice the deep corrective swing that occurred in late 2025 into early 2026. The downward pressure stopped dead in its tracks exactly at the rising monthly 20 SMA (the middle blue line of your Bollinger Bands, currently sitting at 381.28). Institutional capital heavily defended this moving average, refusing to let the primary bull trend break.
The High-Level Squeeze: Following that dynamic defense, buyers immediately pushed the price right back up to the 471.55 ceiling. Notice how the price action began coiling tightly against this horizontal resistance line. This high-level compression represents immense kinetic energy storing under the surface—a classic volatility squeeze before a massive structural expansion.
3. Current Price Action: Entering Pure Price Discovery
Look at the most recent monthly candle on the far right of the chart. The technical pressure cooker has officially exploded. Institutional buyers have stepped in with undeniable conviction, printing a massive, full-bodied green expansion candle that has surged up to 500.35 (+23.04%). This vertical thrust has decisively obliterated the 471.55 multi-year ceiling, pushing the price into clear price discovery territory. Furthermore, the price has pierced the upper Bollinger Band, confirming a textbook shift out of a low-volatility accumulation phase and into a highly explosive, high-volatility secular markup trend.
4. The Trade Plan: Entries, Targets, and Risk Management
Entry Strategy: Macro momentum is exceptionally strong right now with the stock trading near 500.35. Because the monthly candle is extended and pushing hard against the upper Bollinger Band, chasing the vertical move immediately carries a short-term mean-reversion risk on lower timeframes. The highest-probability, lowest-risk entry strategy involves stepping down to the weekly or daily timeframe and waiting for the initial vertical excitement to cool off. Look to scale into long positions or place limit orders to catch a potential structural pullback to perfectly retest the 460.00 to 475.00 broken resistance zone. Letting old macro resistance prove itself as a concrete new support floor offers a phenomenal risk-to-reward ratio.
Take Profit (Targets): Because the stock is clearing a major multi-year structure to launch into uncharted sky territory, we use a measured move strategy based on the depth of the base. By taking the core depth of this consolidation range (roughly 183 points from the 288.85 floor up to the 471.55 ceiling) and projecting it upward from the breakout point, our primary structural macro target sits comfortably in the 650.00 to 660.00 zone. Intermediate profit-taking milestones rest at the psychological round numbers of 550.00 and 600.00.
Invalidation (Stop Loss): An explosive macro breakout thesis is completely invalidated if the price fails to hold its newly claimed structural floor and collapses back inside the base boundaries. A hard stop loss should be placed safely below the monthly 20 SMA cushion, specifically around the 360.00 to 380.00 level. A definitive monthly close completely back below 370.00 would act as a severe warning sign of a failed macro breakout and a major bull trap.
5. Time Horizon:
Because this technical setup is built on a 1-Month chart capturing a massive structural phase transition and a multi-year base breakout, this is a longer-term position trade designed to capture a secular markup phase over the coming months and quarters. Let the macro trend run!  Long
Long
COSMOFIRST: Massive W-Bottom Base and Textbook Confluence Retest1. The Macro Perspective: The Washout and the W-Bottom
I am taking a LONG bias on Cosmo First Limited (COSMOFIRST) on the daily (1D) timeframe.
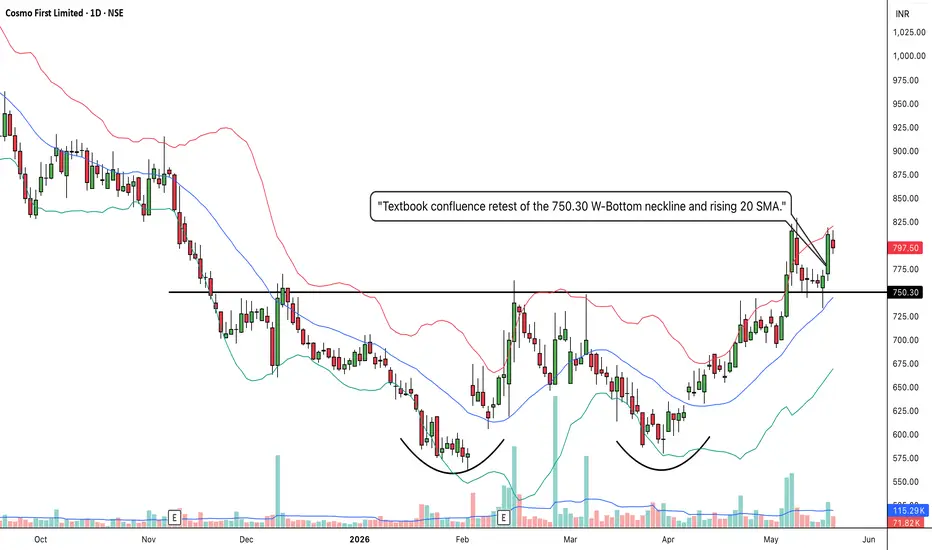
When analyzing pure market structure, the most reliable reversals are born from deep, agonizing accumulation phases. Look at the structural development on the lower half of this chart. After suffering a brutal markdown phase that dragged the price into the 500s and completely washed out weak hands, heavy institutional capital stepped in. I have explicitly drawn the two massive accumulation bowls at the bottom of the chart. This forms a textbook "W-Bottom" or Double Bottom structure. Instead of bleeding lower, strong-handed buyers aggressively defended these lows, systematically absorbing overhead supply to build a concrete macro foundation.
2. The Educational Setup: Conquering the Neckline
To understand the sheer strength of this current setup, look at how the price transitioned from accumulation back into a markup phase:
The Resistance Lid: For months, the ultimate ceiling of this base was defined by the solid black resistance line at 750.30. This was the "Neckline" of the W-Bottom.
The Breakout: Recently, buyers aggressively shattered this 750.30 ceiling with a massive momentum thrust, pushing the price all the way up to test the dashed 824.65 macro resistance. This definitive breakout officially signaled the end of the markdown phase and the birth of a new trend.
3. Current Price Action: The Ultimate Confirmation
In technical analysis, breaking a major resistance line is only half the battle. The most lucrative entries occur when a stock proves it can defend its newly claimed territory. Look at the most recent candles on the far right. After hitting 824.65, the stock took a healthy, necessary breather. It pulled back to perfectly test the 750.30 line from above. Furthermore, notice how the rising 20 SMA (the middle blue line of your Bollinger Bands) perfectly intersected with that horizontal line. This is a "Confluence Retest." By printing a strong green candle right off this intersection, that old, heavy resistance ceiling has officially been flipped into an indestructible structural launchpad.
4. The Trade Plan: Entries, Targets, and Risk Management
Entry Strategy: We are currently sitting right in the "golden entry" zone near 797.50. The highest-probability, lowest-risk entry involves stepping in right here as the stock launches off the structural retest of the 750.00 to 760.00 confluence zone. Letting that newly broken macro neckline and the rising 20 SMA prove themselves as a concrete floor offers a phenomenal risk-to-reward ratio before the next momentum expansion.
Take Profit (Targets): The immediate structural hurdle is the recent swing high at the dashed 824.65 line. Once that stepping stone is cleared, we use measured targets based on the depth of the macro base. By taking the depth of the W-Bottom (roughly 200 points from the ~550 floor up to the 750.30 neckline) and projecting it upward, our primary structural macro target sits beautifully in the 940.00 to 950.00 zone.
Invalidation (Stop Loss): A break-and-retest thesis is only valid if the new floor holds. A hard stop loss should be placed safely below the 750.30 neckline and the 20 SMA, around the 715.00 to 725.00 level. A definitive daily close completely back inside the old accumulation bowl would invalidate the immediate reversal thesis and signal a severe bull trap.
5. Time Horizon:
Because this technical setup is built on a 1-Day chart capturing a massive structural W-Bottom completion and a textbook confluence retest, this is a medium-term swing trade designed to capture the explosive new markup phase. Let the new trend run!  Long
Long
PFC: The Ultimate Bear Trap, Box Breakout, and Textbook Retest1. The Macro Perspective: The Digestion Box
I am taking a LONG bias on Power Finance Corporation Limited (PFC) on the weekly (1W) timeframe.
When analyzing pure market structure, massive momentum runs require massive digestion phases. Look at the structural development on the left side of this chart. After a historical parabolic run-up, the stock naturally exhausted itself. But instead of entering a multi-year bear market, institutional buyers established a massive horizontal consolidation zone (a Box) to digest the gains. For months, the price chopped violently between the solid black floor at 348.40 and the solid black ceiling at 423.55. This sideways action acts as a "washing machine," frustrating impatient retail traders and allowing heavy capital to quietly absorb shares.
2. The Educational Setup: The Bear Trap (Spring)
To understand the sheer strength of this current setup, look closely at what happened at the bottom of the box before the breakout:
The Shakeout: Notice how the price broke below the 348.40 floor? To an amateur, this looked like a catastrophic breakdown, triggering mass panic selling and stop-losses.
The Reversal: However, institutional capital used that exact liquidity to buy aggressively at a discount, forming a V-shaped recovery right back into the box. In structural trading, this is called a "Bear Trap" or a Wyckoff "Spring." It is the ultimate confirmation of heavy institutional demand. Once the weak hands were flushed out, the stock marched relentlessly straight to the top of the box.
3. Current Price Action: The Confluence Retest
Look at the right side of the chart. The stock successfully shattered the 423.55 box ceiling, tested the mid-level dashed pivot at 472.91, and is now experiencing a healthy corrective pullback. Look at the current weekly candle. It is pulling back to perfectly retest the 423.55 breakout line from above. Furthermore, notice the middle blue line of your Bollinger Bands (the 20 SMA) sitting right at 413.41. The price is perfectly wedged between major horizontal support and dynamic moving average support. This is a textbook "Break and Retest"—flipping a massive historical ceiling into a brand-new, indestructible launchpad.
4. The Trade Plan: Entries, Targets, and Risk Management
Entry Strategy: We are currently sitting directly in the "golden entry" confluence zone. The highest-probability, lowest-risk entry involves stepping down to a daily timeframe and waiting for bullish reversal candles to form exactly in this 415.00 to 425.00 area. Letting that newly broken box ceiling and the rising 20 SMA prove themselves as a concrete floor offers a phenomenal risk-to-reward ratio before the next momentum expansion.
Take Profit (Targets): Our structural targets are crystal clear. The immediate hurdle is reclaiming the recent swing high at the dashed 472.91 line. Once that stepping stone is cleared, the ultimate macro target is a full retest of the massive red historical all-time high ceiling sitting way up at 543.35.
Invalidation (Stop Loss): A break-and-retest thesis is only valid if the new floor holds. A hard stop loss should be placed safely below the 20 SMA and back inside the top half of the box, around the 385.00 to 395.00 level. A definitive weekly close completely back inside the middle of the old accumulation box would invalidate the immediate continuation thesis and signal a failed breakout.
5. Time Horizon:
Because this technical setup is built on a 1-Week chart capturing a massive box breakout, a confirmed bear trap, and a structural retest, this is a medium-to-longer-term position trade designed to capture a major markup phase back toward all-time highs. Let the macro trend run!  Long
Long
RPRX: Explosive Macro Breakout and Multi-Year ReversalThe Setup (Bias): I am taking a LONG bias on Royalty Pharma plc (RPRX) on the macro monthly (1M) timeframe.
The "Why" (Technical Reasons): 1. Historic Structural Reversal: Zooming out to the monthly timeframe reveals the true magnitude of this turnaround. After a prolonged downtrend into a clearly defined accumulation box at the lows, the price has mounted a massive V-shaped/rounding recovery. It has now forcefully broken out, cleanly slicing through the heavy macro resistance ceiling at 46.71.
2. Volatility Expansion: By applying Bollinger Bands, we can see a beautiful volatility expansion. The upper band is opening up rapidly as the price rides it higher, confirming that this breakout is backed by extreme momentum and aggressive institutional buying pressure. Sellers have been completely absorbed.
Trade Plan (Entry & Exits): * Entry: Momentum and position traders can look for entries near the current extended market price of 49.54 to capture the aggressive phase transition. A safer, lower-risk approach would be waiting for the momentum to cool and placing limit orders to catch a potential monthly pullback to retest the 46.71 breakout zone, letting that old macro ceiling prove itself as a new floor.
Take Profit (Target): With the stock breaking out into fresh territory with this much monthly momentum, the trend can carry it significantly higher. The next major psychological milestones are the 55.00 level, followed by 60.00.
Stop Loss: Placed safely below the middle of the recent monthly structural climb, around the 38.00 to 40.00 level. A monthly close back below the 46.71 structural level would be an early warning sign of a failed macro breakout.
Duration: Because this analysis is built on a massive 1-Month chart capturing a macro trend reversal and continuation, this is a long-term position trade designed to play out over the coming months to years.  Long
Long
ANGELONE: Daily Box Breakout1. The Macro Perspective: The High-Level Accumulation Box
I am taking a LONG bias on Angel One Limited (ANGELONE) on the daily (1D) timeframe.
When analyzing pure market structure, explosive vertical moves must eventually be digested. Look at the extensive structural development displayed on this chart. Following a massive, nearly vertical markup phase that initiated in late March, the stock naturally became overextended and needed to breathe. Instead of collapsing and surrendering those gains, heavy institutional capital stepped in to build a solid high-level floor. For several weeks, the stock has been locked in a tight horizontal accumulation box, absorbing retail profit-taking while methodically transferring shares into strong hands in anticipation of the next major markup phase.
2. The Educational Setup: Bollinger Band Compression and the 20 SMA Springboard
To understand the technical validity behind this breakout structure, we examine the clear horizontal parameters and dynamic indicators acting across the chart:
The Rectangle Consolidation: Notice the black box drawn on the chart. The price chopped sideways, tightly bounded by a structural floor near 293.00 and a heavy overhead resistance ceiling around 330.00. This multi-week consolidation zone acted as a textbook liquidity vacuum.
The 20 SMA Catch-Up: Look at how beautifully the price structure utilized the rising daily 20 SMA (the middle blue line of your Bollinger Bands, currently near 316.14). During the sideways chop, the moving average was allowed to catch up to the price, eventually acting as a dynamic rising cushion that coiled the price action tightly against the box's upper ceiling. This tightening represents classic volatility compression.
3. Current Price Action: Volatility Expansion and Range Clearance
Look at the most recent daily candle on the far right of the chart. The technical pressure cooker has officially blown its lid off. Buyers have stepped in with massive conviction, printing a stellar, full-bodied green expansion candle that has effortlessly cleared the 330.00 box resistance ceiling, currently trading near 339.35. Furthermore, the candle has violently pierced and begun riding outside the upper Bollinger Band, backed by a noticeable expansion in volume. This confirms that the stock has officially transitioned out of compression and into a high-volatility vertical markup phase.
4. The Trade Plan: Entries, Targets, and Risk Management
Entry Strategy: Momentum is incredibly strong right now with the price trading out in the open. Chasing a massive vertical daily expansion candle closing outside the upper Bollinger Band always carries an inherent risk of a short-term lower-timeframe mean-reversion pullback. The highest-probability, lowest-risk entry involves letting the immediate excitement settle. Look to scale into long positions or place limit orders on a structural retest of the broken 325.00 to 330.00 box ceiling zone. Letting old historical resistance prove itself as a concrete new support floor provides an exceptional risk-to-reward ratio.
Take Profit (Targets): Because the stock is breaking out of a high-tight flag / rectangle structure, we use classical measured moves. By taking the depth of the initial vertical pole or the depth of the box (roughly 37 points from the 293 floor to the 330 ceiling) and projecting it upward, our primary structural macro target sits comfortably in the 365.00 to 370.00 zone.
Invalidation (Stop Loss): An explosive breakout thesis is completely invalidated if the asset fails to hold its newly claimed structural floor. A hard stop loss should be placed safely below the daily 20 SMA and back inside the core of the accumulation base, specifically around the 305.00 to 310.00 level. A definitive daily close completely back below 300.00 would act as a massive warning sign of a failed breakout and a severe bull trap.
5. Time Horizon:
Because this technical setup is engineered on a 1-Day chart capturing a clean range breakout and an immediate structural phase transition, this is a high-alpha swing trade designed to capture a rapid momentum continuation over the coming days and weeks. Let the markup phase run!  Long
Long
ASTRAMICRO: Weekly Macro Base Breakout1. The Macro Perspective: The Multi-Year Accumulation Phase
I am taking a LONG bias on Astra Microwave Products Limited (ASTRAMICRO) on the weekly (1W) timeframe.
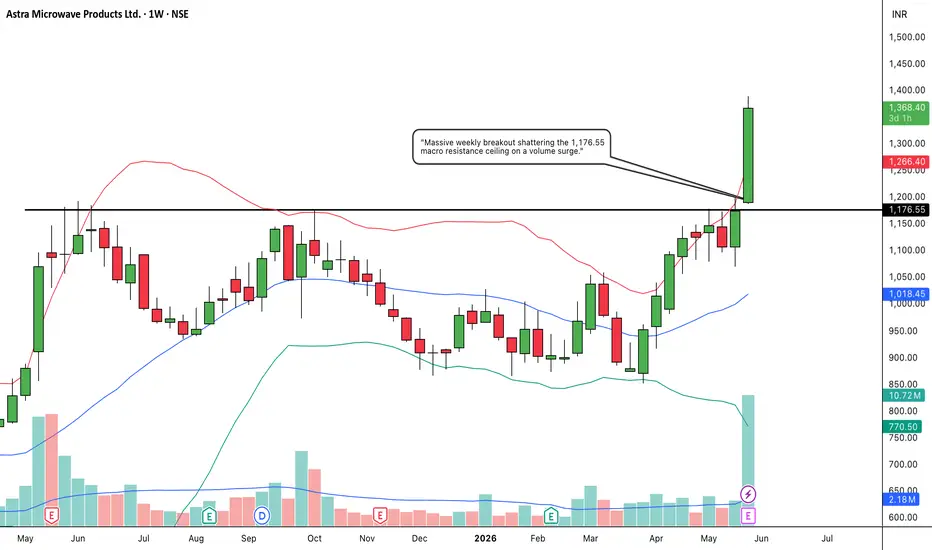
When analyzing pure market structure, the most powerful and sustainable trends are born from prolonged high-level consolidation patterns. Looking at the structural development in Screenshot 2026-05-26 at 14.35.15.jpg, the stock has spent roughly a year building a massive macro base. After a previous secular markup phase that topped out in mid-2025, the price entered a broad accumulation and digestion cycle. Sellers repeatedly defended the overhead ceiling, shaking out impatient retail traders, while strong-handed institutional portfolios quietly absorbed the floating supply at progressively higher structural support levels.
2. The Educational Setup: Dynamic Support and Volatility Compression
To understand the technical validity behind this macro launch, we look at the interaction between horizontal levels and dynamic indicators:
The Major Neckline Ceiling: The critical overhead barrier is marked by the solid black horizontal line at 1,176.55. This level represents the absolute peak of historical supply where major selling pressure previously capped every attempt at upward continuation.
The 20 SMA Springboard: Notice how the price action behaved during the corrective phases across late 2025 and early 2026. The stock consistently found heavy institutional defense near the rising weekly 20 SMA (the middle blue line of your Bollinger Bands, currently sitting at 1,019.32). By establishing a rock-solid structural floor here and compressing tightly right below the 1,176.55 resistance, the asset formed a perfectly coiled springboard. Volatility compression of this scale on a weekly timeframe always precedes an explosive expansion phase.
3. Current Price Action: Entering Pure Price Discovery
Look at the most recent weekly candle on the far right of the chart. The technical pressure cooker has officially blown its lid off. Institutional buyers have stepped in with massive conviction, printing an absolute powerhouse of a green weekly expansion candle that has vaulted the stock up to 1,385.70 (+17.94%). This vertical thrust has completely decimated the 1,176.55 multi-year ceiling on an unmistakable institutional volume surge (the towering volume bar below). The price has violently pierced and is riding entirely outside the upper Bollinger Band, snapping the bands wide open. By clearing this massive consolidation block, ASTRAMICRO has officially entered uncharted "Blue Sky Territory" where all historical overhead supply is gone.
4. The Trade Plan: Entries, Targets, and Risk Management
Entry Strategy: Macro momentum is exceptionally strong with the stock trading at 1,385.70. Chasing a vertical weekly candle that closes entirely outside the upper Bollinger Band carries an inherent risk of a short-term, lower-timeframe mean-reversion pullback. The highest-probability, lowest-risk entry strategy involves waiting for the initial vertical excitement to settle. Look to scale into long positions or place limit orders to catch a potential structural pullback to perfectly retest the 1,175.00 to 1,220.00 broken resistance zone. Letting old historical resistance prove itself as concrete new support provides an unmatched risk-to-reward ratio.
Take Profit (Targets): Because the stock is breaking out of a massive multi-year base into pure price discovery, we use a classical measured move strategy based on the depth of the consolidation structure. Projecting the depth of this macro base upward from the breakout point targets a primary structural macro zone between 1,480.00 and 1,520.00. The ultimate psychological milestone of 1,500.00 will act as a powerful macro magnet.
Invalidation (Stop Loss): An explosive breakout thesis is completely invalidated if the asset fails to hold its newly claimed floor and collapses back inside the base boundaries. A hard stop loss should be placed safely below the rising weekly 20 SMA cushion, around the 980.00 to 1,020.00 level. A definitive weekly close completely back below 950 would act as a severe warning sign of a failed macro breakout and a major bull trap.
5. Time Horizon:
Because this technical setup is engineered on a 1-Week chart capturing a massive structural phase transition and an ultimate lifetime high breakout, this is a longer-term position trade designed to capture a secular markup trend over the coming months. Let the macro trend run!  Long
Long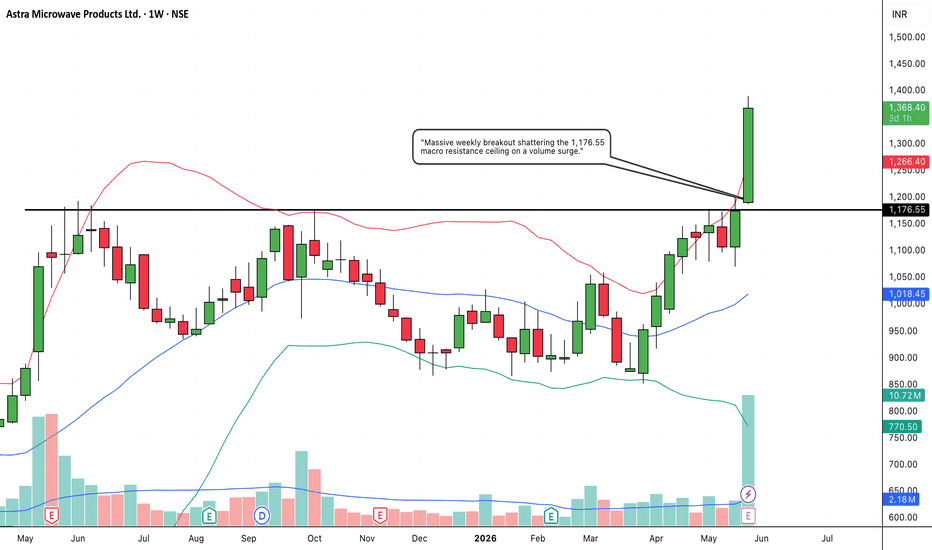
GRANULES: Weekly Macro Cup Breakout1. The Macro Perspective: The Deep Washout and Rounding Base
I am taking a LONG bias on Granules India Limited (GRANULES) on the weekly (1W) timeframe.
When analyzing pure market structure on a macro level, the most powerful and sustainable trends emerge from deep, well-rounded accumulation structures. Look at the comprehensive development displayed in Screenshot 2026-05-23 at 17.10.58.jpg. After hitting a major structural peak in mid-2024, the stock entered a long, grueling digestion cycle that washed out weak hands down toward the 400-425 zone. Instead of collapsing into a permanent downtrend, institutional capital heavily stepped in to absorb supply. Over the last two years, the stock has beautifully carved out a massive, symmetrical rounding accumulation base (Cup formation), methodically shifting shares from weak retail hands to strong-handed institutional portfolios.
2. The Educational Setup: Reclaiming Key Pillars and Neckline Squeeze
To understand the sheer technical validity behind this massive structural breakout, we look at the confluence of dynamic indicators and key price parameters across the chart:
The 20 SMA Springboard: Notice how cleanly the price action behaved on the right side of the rounding curve. Once the stock recovered from its macro lows, it decisively reclaimed the rising weekly 20 SMA (the middle blue line of your Bollinger Bands, currently near 624.79). This moving average was aggressively defended during every minor weekly dip, serving as a dynamic rising launchpad for the macro markup phase.
The Ultimate Ceiling: The defining boundary for this entire multi-year pattern is the solid black horizontal neckline drawn at 717.75. This level marks the final major structural roadblock where sellers historically stepped in to halt the bull run. As the price climbed back to this line, it compressed heavily against the resistance, coiling the spring with immense kinetic energy beneath the surface.
3. Current Price Action: Volatility Expansion and Blue Sky Entry
Look closely at the most recent weekly candles on the far right of the chart. The technical pressure cooker has officially blown its lid off. Buyers have stepped in with massive conviction, printing a sequence of powerful green expansion candles that have completely shattered the 717.75 multi-year ceiling. The stock has printed fresh lifetime highs up near 754.75 and is currently holding strong. Furthermore, the price has violently pierced and begun riding outside the upper Bollinger Band, forcing the band boundaries to snap wide open. This represents a classic structural transition from low-volatility compression into a high-volatility macro markup phase, clearing out all historical overhead supply.
4. The Trade Plan: Entries, Targets, and Risk Management
Entry Strategy: Macro momentum is exceptionally strong. Chasing a vertical weekly run entirely outside the upper Bollinger Band carries a minor risk of a short-term mean-reversion pullback on lower timeframes. The highest-probability, lowest-risk entry involves letting the immediate breakout excitement cool off. Look to scale into long positions or place limit orders to catch a potential structural retest of the broken neckline zone between 710.00 and 725.00. Letting old historical resistance prove itself as a concrete new support floor offers an exceptional risk-to-reward ratio.
Take Profit (Targets): Because the stock is breaking out of a massive multi-year rounding structure into unchartered blue-sky territory, we use a measured move strategy based on the depth of the base. By taking the core depth of the Cup (roughly 300 points from the ~417 structural floor up to the 717.75 ceiling) and projecting it upward from the breakout point, our primary macro target sits comfortably in the 1,000.00 to 1,020.00 zone. Intermediate psychological profit milestones rest at 850.00 and 900.00.
Invalidation (Stop Loss): An explosive macro breakout thesis is completely invalidated if the price fails to defend its newly claimed floor and collapses back inside the base. A hard stop loss should be placed safely below the rising weekly 20 SMA and the mid-curve structural pivots, specifically around the 610.00 to 630.00 level. A definitive weekly close completely back below 600 would act as a severe warning sign of a failed macro breakout and a major bull trap.
5. Time Horizon:
Because this technical setup is engineered on a 1-Week chart capturing a massive structural phase transition and a clean multi-year rounding breakout, this is a longer-term position trade designed to capture a secular markup phase over the coming months and quarters. Let the macro trend run!  Long
Long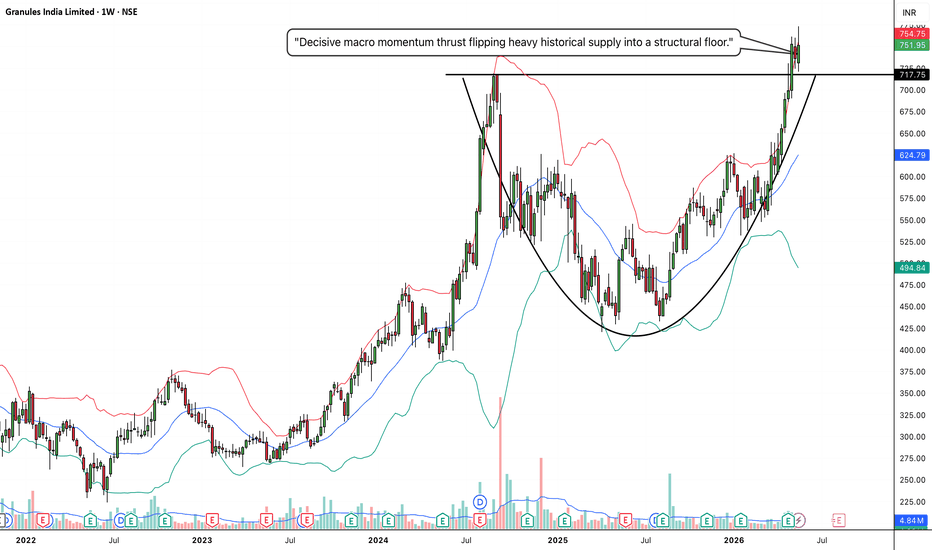
JBCHEPHARM: Weekly ATH Breakout1. The Macro Perspective: The High-Level Accumulation Base
I am taking a LONG bias on JB Chemicals & Pharmaceuticals Limited (JBCHEPHARM) on the weekly (1W) timeframe.
When analyzing pure market structure, the strongest macro setups occur when a stock undergoes a healthy, multi-month consolidation right beneath its lifetime highs. Look at the comprehensive structural development displayed in edited-image.png. After carving out a major top in mid-2024, the stock underwent an extensive corrective digestion phase. This structural reset allowed the moving averages to flatten out and form a massive launchpad. Instead of breaking down into a structural downtrend, heavy institutional accumulation stepped in to build a solid floor, quietly transferring shares from weak hands to strong hands in anticipation of the next major markup phase.
2. The Educational Setup: Layered Support and Volatility Compression
To understand the technical validity behind this massive breakout structure, we examine the clear horizontal zones and dynamic buffers acting across the chart:
The Layered Support Cushion: Look at the two lower black horizontal lines sitting at 1,914.30 and 1,955.10. During the recent corrective pullbacks in early 2026, institutional buyers aggressively stepped in to defend this zone, refusing to let the stock slide back into the core of its older base. This cluster acted as an unbreakable structural floor.
The 20 SMA Springboard: Notice how beautifully the price structure interactively used the rising weekly 20 SMA (the middle blue line of your Bollinger Bands) right before the launch. The moving average acted as a dynamic rising cushion, coiling the price action tightly against the ultimate horizontal resistance line at 2,172.50. This extreme tightening represents classic volatility compression—a coiled spring gathering immense kinetic energy before an expansion.
3. Current Price Action: Blue Sky Territory and Volatility Expansion
Look at the most recent weekly candle on the far right of the chart. The technical pressure cooker has officially blown its lid off. Buyers have stepped in with massive conviction, printing a stellar, full-bodied green expansion candle that has effortlessly cleared the 2,172.50 macro resistance ceiling. By closing decisively above this key line, JBCHEPHARM has officially entered "Blue Sky Territory" (pure price discovery). All historical overhead supply has been completely eliminated. Furthermore, the candle has pierced and begun riding outside the upper Bollinger Band, confirming that the stock has officially transitioned out of compression and into a high-volatility vertical markup phase.
4. The Trade Plan: Entries, Targets, and Risk Management
Entry Strategy: Momentum is incredibly strong right now with the price trading out in the open. Chasing a massive vertical weekly expansion candle closing outside the upper Bollinger Band carries an inherent risk of a short-term lower-timeframe mean-reversion pullback. The highest-probability, lowest-risk entry involves letting the immediate excitement settle. Look to scale into long positions or place limit orders on a structural retest of the broken 2,150.00 to 2,180.00 zone. Letting old historical resistance prove itself as a concrete new support floor provides an exceptional risk-to-reward ratio.
Take Profit (Targets): Because the stock is breaking out into unchartered sky territory with no overhead resistance, we use classical measured moves. By taking the depth of the high-level base (roughly 240 points from the 1,930 support cluster up to the 2,172 breakout line) and projecting it upward, our primary structural macro target sits comfortably in the 2,420.00 to 2,450.00 zone. The ultimate psychological round number of 2,500.00 will act as the macro magnet.
Invalidation (Stop Loss): An explosive breakout thesis is completely invalidated if the asset fails to hold its newly claimed structural floor. A hard stop loss should be placed safely below the weekly 20 SMA and the lower consolidation support line, specifically around the 1,890.00 to 1,920.00 level. A definitive weekly close completely back below 1,900 would act as a massive warning sign of a failed breakout and a severe macro bull trap.
5. Time Horizon:
Because this technical setup is engineered on a 1-Week chart capturing a massive structural phase transition and an ultimate lifetime high breakout, this is a medium-to-longer-term position trade designed to capture a sustained markup trend over the coming months. Let the macro trend run! NIFTY 50 – Week Expiry Technical OutlookNIFTY 50 – Week Expiry Technical Outlook
Technical Analysis | Price Action & Key Levels
Overview
Nifty remains below key resistance levels following the recent breakdown, suggesting that short-term momentum remains weak. Price is trading below the Pivot and Buy Reversal zones, while buyers have yet to demonstrate a strong recovery signal.
Key Levels
Support Zones:
▸ 23,176- 23,100
Resistance Zone:
▸ 23,208 – 23,282
Technical View
▸ The recent decline reflects continued selling pressure.
▸ If price remains below 23,282 , the current bearish structure may remain intact.
▸ A sustained move above 23,282 could improve short-term sentiment.
▸ Reclaiming 23,346 may indicate stronger buyer participation.
Week Expiry Considerations
▸ Weekly expiry may increase volatility and lead to sharp intraday swings.
▸ Traders may consider monitoring price behavior around key support and resistance levels rather than anticipating a fixed directional move.
Summary
Below 23,282 → Selling pressure may persist.
Above 23,346 → Market structure could improve.
Disclaimer: This publication is for educational purposes only and reflects personal analysis based on price action and technical levels. It is not financial advice. Please conduct your own research and use appropriate risk management before making any trading decisions. SANSERA: The Perfect Ascending Channel and Confluence Bounce1. The Macro Perspective: The Institutional Staircase
I am taking a LONG bias on Sansera Engineering Limited (SANSERA) on the daily (1D) timeframe.
When analyzing pure market structure, the most sustainable and lucrative trends do not go straight up vertically; they move in structured waves. Look at the massive structural development spanning this chart. I have highlighted a textbook "Ascending Channel." This pattern is the ultimate footprint of methodical, long-term institutional accumulation. For months, heavy capital has been systematically walking this stock higher. They aggressively step in to buy every time the price touches the lower trendline (support), and they gracefully take partial profits every time it reaches the upper trendline (resistance), creating a beautiful, rhythmic upward staircase.
2. The Educational Setup: The Power of Confluence
To understand the sheer strength of this current setup, look closely at the mechanics of the recent pullbacks:
The Mid-Line Pivot: Notice how the price frequently interacts with the invisible mid-line of this channel, chopping around the rising 20 SMA (the middle blue line of your Bollinger Bands). This shows a very healthy, balanced trend.
The Concrete Floor: Every major dip that approaches the bottom solid black trendline is met with immediate, aggressive buying pressure. The lower boundary acts as an indestructible structural floor, proving that the underlying macro trend remains entirely intact.
3. Current Price Action: The Golden Bounce
Look at the most recent daily candles on the far right. After reaching the top of the channel near the 2,600 level, the stock suffered a healthy, necessary corrective pullback. But look exactly where the bleeding stopped. The price pulled back to perfectly touch the lower boundary of the ascending channel. Furthermore, notice how the rising 20 SMA perfectly intersected with that trendline. This is a textbook "Confluence Bounce." By printing strong green candles right off this intersection, buyers are loudly confirming that the channel is still dictating the trend.
4. The Trade Plan: Entries, Targets, and Risk Management
Entry Strategy: We are currently sitting right in the "golden entry" zone. The highest-probability, lowest-risk entry involves stepping in right here as the stock launches off this structural confluence in the 2,350.00 to 2,400.00 zone. Buying the confirmed bounce at the bottom of an ascending channel offers a phenomenal risk-to-reward ratio.
Take Profit (Targets): Our targets are dictated entirely by the structure of the channel. The primary structural swing target is a full measured move back up to the upper boundary of the channel, which currently projects comfortably into the 2,800.00 to 2,900.00 zone over the coming weeks. The immediate hurdle will be reclaiming the recent swing high near 2,600.
Invalidation (Stop Loss): A channel-bounce thesis is only valid if the channel holds. A hard stop loss should be placed safely below the lower trendline and the 20 SMA, around the 2,200.00 to 2,250.00 level. A definitive daily close completely breaking down out of the bottom of the channel would act as a massive warning sign of a trend reversal and a severe structural failure.
5. Time Horizon:
Because this technical setup is built on a 1-Day chart capturing a massive structural channel bounce, this is a medium-term swing trade designed to ride the wave back up to the top of the range. Let the channel dictate the trend!  Long
Long
 Long
Long
PRECOT has explosively broken out of a massive multi-year macro 1. The Macro Perspective: The Multi-Year Secular Base
I am taking a LONG bias on Precot Limited (PRECOT) on the absolute macro monthly (1M) timeframe.
When analyzing pure market structure on a monthly chart, we are observing the true footprints of heavy institutional capital. Look at the staggering structural development spanning this entire chart. After a dormant decade of accumulation, the stock initiated a violent markup phase in 2021-2022. However, parabolic runs require deep digestion. Over the last two to three years, the stock has been locked in a massive high-level accumulation and shakeout zone. It repeatedly faced supply at the dashed 632.80 resistance line, shaking out impatient retail traders while strong-handed institutional buyers quietly absorbed all available liquidity at higher structural lows.
2. The Educational Setup: Dynamic Support and the Bollinger Band Squeeze
To understand the sheer technical validity of this macro breakout, we look at how beautifully the price structure aligned right before the launch:
The 20 SMA Defense: During the deep, multi-month shakeout phases, look at exactly where the bleeding stopped. The stock found perfect, concrete structural support right around the rising monthly 20 SMA (the middle blue line of your Bollinger Bands). Institutional capital aggressively defended this dynamic floor, refusing to let the secular bull trend break.
The Volatility Squeeze: After establishing that floor, the price chopped and compressed heavily. This tight consolidation acted like a pressure cooker, coiling the spring and storing immense kinetic energy under the surface. Volatility is entirely cyclical, and a deep compression on a monthly timeframe is the ultimate precursor to a monumental expansion.
3. Current Price Action: Entering Pure Price Discovery
Look at the most recent monthly candle on the far right. The high-level pressure cooker has absolutely exploded. Buyers have stepped in with massive conviction, printing a powerhouse of a green monthly expansion candle. This single candle has effortlessly obliterated the 632.80 multi-year ceiling, pushing the price well into the 700s. Furthermore, the price has violently pierced the upper Bollinger Band, forcing the bands to rapidly expand upward. By decisively clearing this multi-year accumulation zone, PRECOT has officially entered "Blue Sky Territory" (pure price discovery). All historical overhead supply has been completely eliminated.
4. The Trade Plan: Entries, Targets, and Risk Management
Entry Strategy: Macro momentum is exceptionally strong with the stock trading near 769.40. Chasing a massive vertical monthly candle closing entirely outside the upper Bollinger Band carries a risk of agonizing short-term drawdowns if the stock naturally breathes on lower timeframes. The highest-probability, lowest-risk entry involves stepping down to a weekly or daily timeframe and waiting for the initial excitement to cool off. Look to place limit orders to catch a potential structural pullback to perfectly retest the 630.00 to 660.00 broken resistance zone. Letting old macro resistance prove itself as a concrete new support floor offers a phenomenal risk-to-reward ratio.
Take Profit (Targets): Because the stock is breaking out of a massive multi-year structure into uncharted territory, we use a measured move strategy based on the depth of the high-level base. By taking the depth of this consolidation (roughly 330 points from the ~300 floor up to the 632.80 ceiling) and projecting it upward from the breakout point, our primary structural macro target sits comfortably in the 950.00 to 980.00 zone. The ultimate psychological round number of 1,000.00 acts as the macro magnet.
Invalidation (Stop Loss): An explosive macro breakout thesis is completely invalidated if the stock crashes back deep inside the old consolidation boundaries. A hard stop loss should be placed safely below the 20 SMA and the mid-level structural pivots, around the 480.00 to 500.00 level. A definitive monthly close completely back below the moving average would confirm a massive failed breakout and a severe macro bull trap.
5. Time Horizon:
Because this technical setup is built on a 1-Month chart capturing a massive structural phase transition and multi-year All-Time High breakout, this is a longer-term position trade designed to capture a secular markup phase over the coming months and quarters. Let the macro trend run!  Long
Long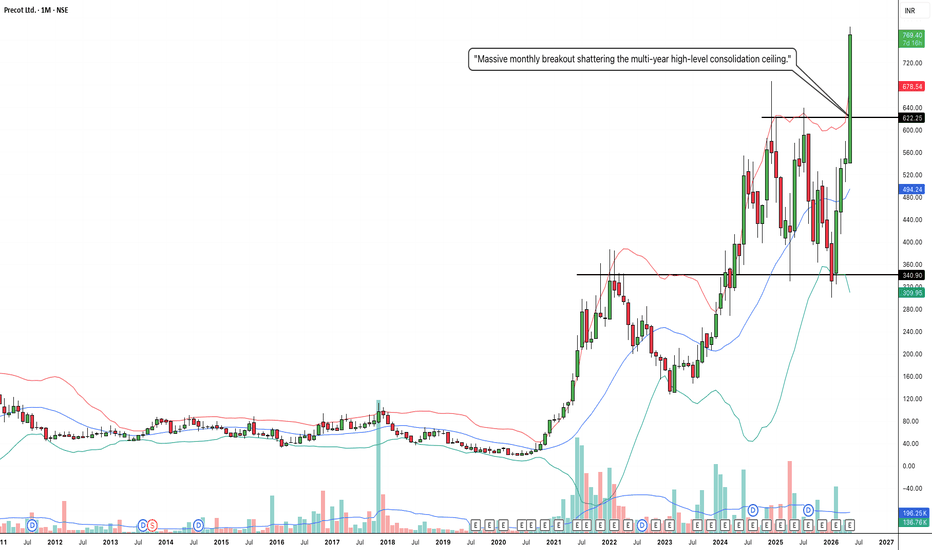
CANBK: Multi-Year Rounding Bottom and Textbook Macro Retest1. The Macro Perspective: The Decade-Long Washout and Recovery
I am taking a LONG bias on Canara Bank (CANBK) on the absolute macro monthly (1M) timeframe.
When analyzing pure market structure on a monthly chart, we are looking at cycles that take years to play out. Look at the massive structural development spanning the entire chart. The stock suffered a brutal, agonizing markdown phase that lasted for years, dragging the price all the way down to a concrete floor near the 10-20 zone. This deep, prolonged correction completely decimated weak hands and forced mass capitulation. However, instead of bleeding into a permanent bear market, heavy institutional capital stepped in. Over the last three years, the stock has been quietly carving out an enormous "Rounding Bottom" accumulation phase, systematically riding the 20 SMA (the middle Bollinger Band) to march right back up the chart.
2. The Educational Setup: Conquering the Macro Neckline
To understand the sheer strength of this current setup, look at how the price systematically transitioned from accumulation back into a markup phase:
The Resistance: For years, the ultimate macro ceiling was defined by the solid black resistance line at 121.06.
The Breakout: Recently, buyers aggressively shattered this 121.06 ceiling, forcing the upper Bollinger Band to expand rapidly and pushing the price all the way up to the 160 zone. This initial breakout signaled a definitive shift in the secular trend.
3. Current Price Action: The Ultimate Confirmation
In technical analysis, breaking a major resistance line is only half the battle. The most lucrative, high-probability entries occur when a stock proves it can defend its newly claimed territory. Look at the current monthly candle on the far right. After a massive vertical run, the stock is taking a healthy, necessary breather, pulling back to perfectly test that 121.06 line (and the dashed 128.58 pivot) from above. To amateur traders, massive red monthly candles look like a crash. To structural traders, this is a textbook "Break and Retest." By holding its ground here, that old, heavy resistance ceiling is officially being flipped into a brand-new, rock-solid macro launchpad.
4. The Trade Plan: Entries, Targets, and Risk Management
Entry Strategy: We are currently sitting right in the "golden entry" zone near 124.90. The highest-probability, lowest-risk entry involves stepping down to a weekly or daily timeframe and waiting for bullish reversal candles to form exactly in this 121.00 to 128.00 structural retest zone. Letting that newly broken macro neckline prove itself as an indestructible support floor offers a phenomenal risk-to-reward ratio before the next multi-month momentum expansion.
Take Profit (Targets): Because the stock is systematically working its way out of a massive multi-year base, we have crystal clear measured targets. By taking the depth of the rounding bottom (roughly 100+ points from the extreme lows up to the 121.06 neckline) and projecting it upward, our primary structural macro target sits beautifully in the 220.00 to 230.00 zone. The immediate hurdle is reclaiming the recent 160.00 swing high.
Invalidation (Stop Loss): A macro reversal thesis is only valid if the new market structure holds. A hard stop loss should be placed safely below the 121.06 breakout line and the rising 20 SMA, around the 95.00 to 100.00 level. A definitive monthly close completely back inside the old accumulation bowl (below 100) would invalidate the immediate reversal thesis and signal a severe macro bull trap.
5. Time Horizon:
Because this technical setup is built on a 1-Month chart capturing a massive structural phase transition and textbook macro retest, this is a long-term position trade designed to capture a secular markup phase over the coming months and years. Let the macro trend run!
 Long
Long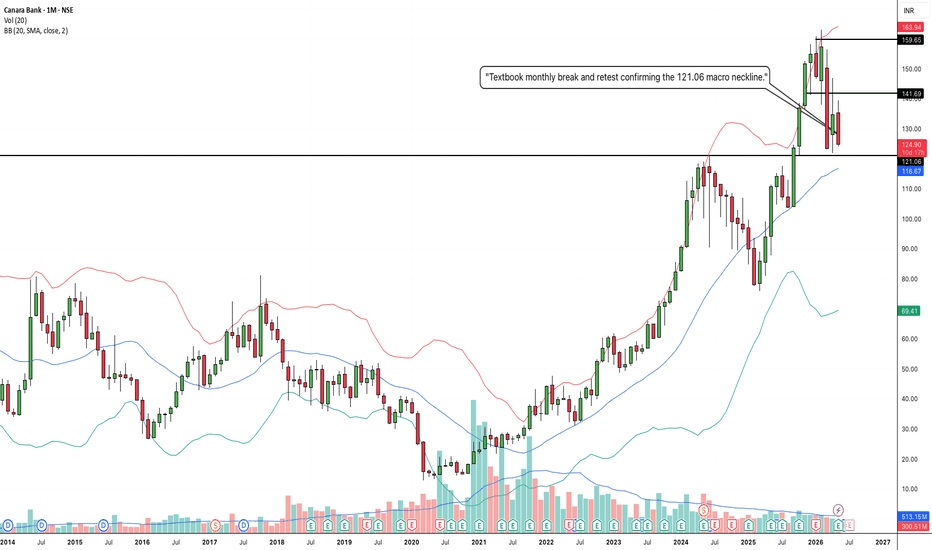
BIOCON: Ascending Triangle Breakout1. The Macro Perspective: The Secular Trendline Defense
I am taking a LONG bias on Biocon Limited (BIOCON) on the weekly (1W) timeframe.
When analyzing pure market structure, the most powerful and sustainable breakouts occur in alignment with an established macro trend. Look at the massive structural development on this chart. The defining feature is the steep, unbroken ascending trendline originating from the bottom left. Every single time the stock experienced a deep, agonizing pullback, institutional buyers aggressively stepped in exactly at this dynamic support line. They refused to let the secular bull trend break, indicating massive, systemic accumulation over the long term.
2. The Educational Setup: The Squeeze and The Ceiling
To understand the sheer strength of this current breakout, look at how the price systematically squeezed historical resistance to form a textbook "Ascending Triangle," confirmed by the Bollinger Bands:
The Concrete Ceiling: The stock's recovery was heavily capped by a formidable horizontal resistance line at 404.75. Sellers repeatedly swatted the price down from this level.
The Volatility Contraction: Notice how the pullbacks became shallower over time, riding the 20 SMA (the middle blue line of your Bollinger Bands). The upper and lower bands began to pinch together right below the 404.75 ceiling. In technical analysis, volatility is cyclical; a massive contraction (a squeeze) is almost always followed by a violent expansion. By pressing up against the horizontal ceiling while forming higher lows, the stock acted like the ultimate pressure cooker.
3. Current Price Action: Riding the Upper Band
Look at the most recent weekly candle on the far right, accompanied by a massive surge in buying volume. The high-level pressure cooker has absolutely exploded. Buyers have effortlessly shattered the 404.75 macro ceiling with a massive, full-bodied green momentum thrust. Furthermore, the price has violently pierced the upper Bollinger Band (currently near 401.69), forcing the bands to rapidly expand. This confirms that a powerful new momentum phase has been initiated, and historical overhead supply has been eliminated.
4. The Trade Plan: Entries, Targets, and Risk Management
Entry Strategy: Momentum is exceptionally strong right now near 426.25. Chasing a massive vertical expansion candle that is riding outside the weekly Bollinger Bands always carries a higher risk of an immediate intraday or daily mean-reversion pullback. The highest-probability, lowest-risk entry involves stepping down to a daily timeframe and waiting for the dust to settle. Look to place limit orders to catch a potential structural pullback to perfectly retest the 400.00 to 405.00 breakout zone. Letting that heavy historical resistance prove itself as a new, indestructible support floor offers a phenomenal risk-to-reward ratio.
Take Profit (Targets): Because the stock is breaking out of a massive macro structure, we use measured targets based on the depth of the pattern. By taking the widest part of the ascending triangle and projecting it upward from the 404.75 breakout line, our primary structural macro target sits comfortably in the 520.00 to 530.00 zone. The immediate psychological milestones are 450.00 and 480.00.
Invalidation (Stop Loss): A trade thesis is only valid if the new market structure holds. A hard stop loss should be placed safely below the breakout line and the most recent structural pivot, around the 370.00 to 375.00 level (just below the 20 SMA). A definitive weekly close completely back inside the triangle and breaking below the ascending trendline would invalidate the immediate continuation thesis and signal a severe macro bull trap.
5. Time Horizon:
Because this technical setup is built on a 1-Week chart capturing a massive structural phase transition and volatility expansion, this is a medium-to-longer-term position trade designed to capture the explosive new markup phase. Let the new trend run!  Long
Long
 Long
Long
 Long
Long
MARAL — Dynamic Risk MapperMARAL — Dynamic Risk Mapper- New script
From static trade levels to live execution intelligence
Most trade-management tools stop at drawing a few levels.
They show an entry, a stop, a target, and leave the trader alone once price starts moving.
But in live markets, that is exactly where the real problem begins.
A trader does not struggle only with where to enter.
A trader struggles with what happens after the trade is mapped:
Is price still respecting the entry zone?
Is invalidation pressure increasing?
Is TP1 close enough to require management?
Is the trade still healthy, or is momentum fading?
If price moved toward SL and came back, is that a real recovery or just noise?
Should the trader hold, protect, reduce, or exit?
That is the purpose of MARAL — Dynamic Risk Mapper Pro.
This script is built as a discretionary trade-mapping and management-support framework designed to help traders read the evolving condition of a mapped trade in a more structured and practical way.
It is not an automated system.
It does not place orders.
It does not guarantee outcomes.
It is a workflow tool built to improve clarity, execution discipline, and live management awareness.
Why this tool was built
Most traders already have enough chart tools.
What they often do not have is a system that can help them read the relationship between:
entry
invalidation
managed stop
target structure
pressure
recovery behavior
action response
in one live framework.
The goal of MARAL — Dynamic Risk Mapper Pro is to convert a manually planned trade into a living management map.
The trader provides only two core inputs:
Trade Side
Manual Entry Price
From there, the script organizes the trade into a dynamic map that continuously evaluates how price is behaving relative to that trade.
This makes the chart less about static lines and more about execution interpretation.
What the script does
Once a trade is defined, the script can map:
Base SL
Managed SL
TP1 / TP2 / TP3
invalidiation zone
momentum condition
confidence context
recovery behavior
live management posture
Instead of only asking, “Where is my stop?”, the script helps the trader ask:
What is this trade doing right now?
That shift matters.
Because a trade is not only a price level.
It is a condition that changes over time.
The example chart
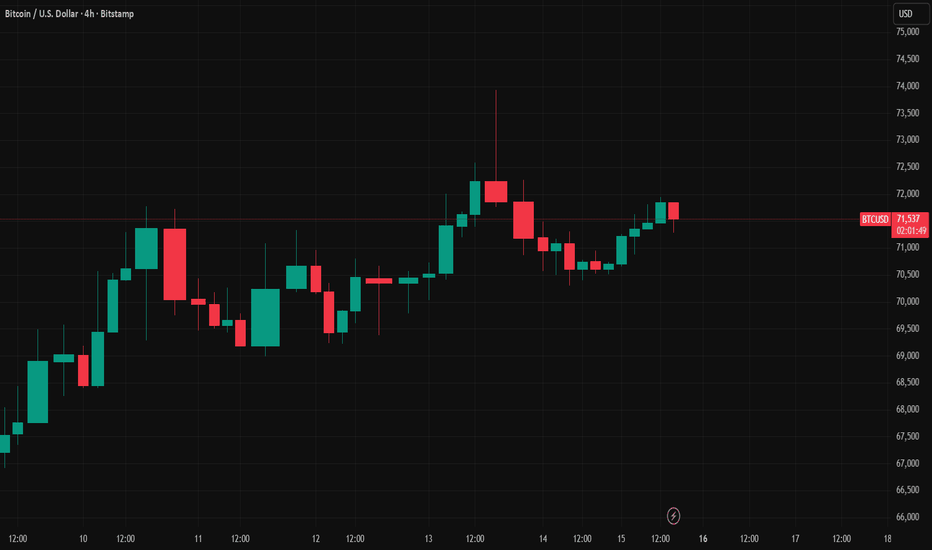
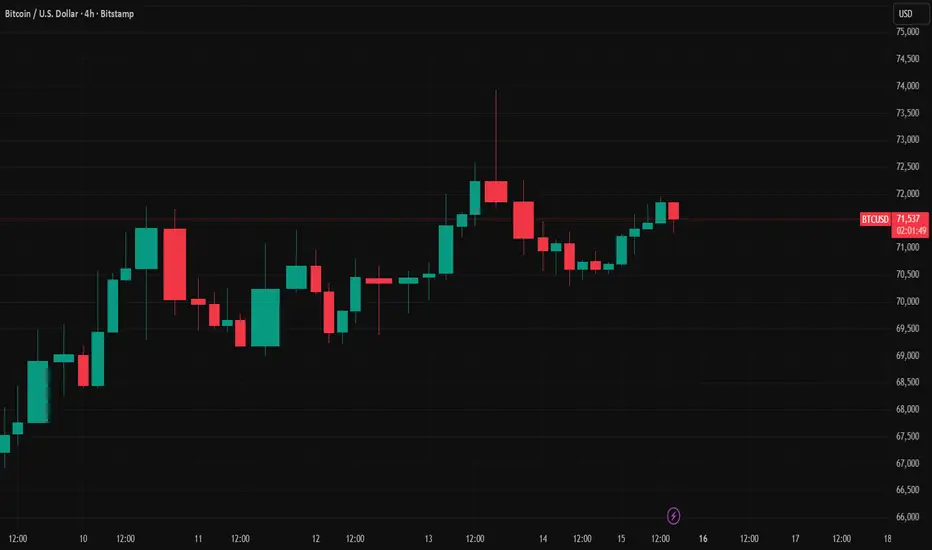
This example uses BTCUSD on the 4-hour chart with a manually defined Long entry at 71,200.00.
The script has mapped:
Entry at 71,200.00
Managed SL below the trade
higher target structure above price
live panel output on the right side of the chart
What makes this example useful is that it is not showing a fully expanded winner.
It is showing a more realistic live situation:
price is still around the entry area,
momentum is not yet cleanly expanding,
the trade remains valid,
but stronger acceptance is still needed.
That is exactly the kind of situation where traders usually become emotional or impatient.
This is where the script adds value.
Panel 1 — Dynamic Risk Mapper
The first panel is the live location panel.
It explains where price is relative to the mapped trade.
In this example it shows:
Side = Long
Entry State = Near Entry
Candle Bias = Bear
Zone = Entry Zone
SL State = Safe
TP1 State = TP1 Far
Event = Trail Update
Confidence = 6.3 / 10 | Moderate
What this means
The trade is mapped for a long-side idea, but price is still working around the entry region.
The chart is not showing a clean breakout away from entry yet.
That is why the script classifies the trade as Near Entry and Entry Zone rather than “cleared” or “expanding”.
The Candle Bias = Bear reading is important.
It means the immediate candle behavior is not fully aligned with the long-side trade.
That does not automatically invalidate the map, but it does reduce short-term conviction.
At the same time, SL State = Safe tells the trader that price is not yet under immediate stop-pressure conditions.
So this is not a panic state.
It is a patience state.
TP1 State = TP1 Far also matters.
It means the trade has not reached the stage where active target-management should dominate the trader’s decision.
And the Confidence = Moderate reading communicates the exact balance of the situation:
the map is active,
the trade is still usable,
but the environment is not yet strong enough to justify aggressive confidence.
This is one of the main advantages of the tool:
it gives the trader a structured way to recognize the difference between valid and fully favored.
Those are not the same thing.
Panel 2 — Management Response Desk
The second panel is the behavior panel.
It does not focus on where price is.
It focuses on how the mapped trade is behaving.
In the example it shows:
Trade Status = Valid
Momentum = Weakening
Pressure = Low
TP1 Response = Wait
Action = Hold
What this means
The trade has not failed.
The structure is still valid.
But price is not yet delivering the kind of strong follow-through that would justify more aggressive trade confidence.
That is why Momentum = Weakening is an important reading here.
The script is not saying the trade is broken.
It is saying the trader should not confuse a valid map with a strong expansion.
This is a critical distinction in real trade management.
The Pressure = Low output is also important.
It tells the trader that while momentum is softer, the trade is not yet under high invalidation stress.
The script therefore avoids overreacting.
Then the panel shows:
TP1 Response = Wait
Action = Hold
This is another major design advantage of the tool.
Instead of forcing premature management decisions, the script recognizes that TP1 is not yet the dominant problem in this chart state.
So it does not push unnecessary partial exits or over-management.
The posture remains calm:
the map is valid,
pressure is controlled,
but stronger confirmation is still needed.
Panel 3 — Trader Guidance Panel
This is where the script becomes especially practical.
The third panel translates the live state into clear sentence-style guidance.
In the example it says:
Comment: Price is testing the entry zone.
Risk Note: The entry is active only if the zone is respected.
Next Step: Wait for acceptance before holding with confidence.
This is one of the strongest practical advantages of the script.
Most tools give technical status.
Very few tools convert that status into a readable live instruction.
This panel is designed to reduce confusion and emotional overreaction by turning technical conditions into operator guidance.
Not signals.
Not promises.
Not predictions.
Guidance.
That is a very important difference.
What this example really teaches
This example is not a chart where everything is already perfect.
That is why it is a good example.
It shows a mapped long trade that is:
still structurally valid
not under immediate stop pressure
not close enough to TP1 for target-driven management
but still lacking clean expansion away from entry
That is a realistic condition many traders face.
Without a structured map, this is exactly where traders start making mistakes:
entering too aggressively
doubting too early
tightening too soon
taking profit too early
holding with false confidence
confusing survival with strength
The script helps separate these conditions.
It helps the trader understand that:
a trade can still be valid without yet being strong.
That single distinction can improve trade-management discipline significantly.
Advantages for traders
1) Better live trade awareness
The script helps traders understand where price is relative to entry, SL, and TP structure without relying only on visual estimation.
2) More disciplined invalidation reading
Instead of reacting emotionally when price moves toward risk, traders get structured context around:
stop pressure
risk zone behavior
recovery watch
recovery confirmation
3) Clearer target-management timing
The script does not treat all target conditions the same.
It helps traders distinguish between:
TP still far
TP approaching
TP reached
target response required
4) Stronger post-entry clarity
Many tools are strongest before entry and weakest after entry.
This script is designed to stay useful after the map is active.
5) Plain-language guidance
The commentary panel reduces mental noise by converting market condition into direct trade-management language.
6) Engineering-style workflow
The structure is designed to feel more like a management console than a simple indicator stack.
That helps traders work with process, not impulse.
What this tool is not
This script is not:
a broker-connected system
an automated execution engine
a guaranteed target model
a buy/sell recommendation service
a replacement for personal judgment
It is a trade-mapping and management-support framework built to help traders operate with more structure.
Final note
Markets do not become easier because a few lines are drawn on the chart.
They become more manageable when the trader can understand:
where the trade is
what condition it is in
what pressure is changing
what response is appropriate now
That is the purpose of MARAL — Dynamic Risk Mapper
It is built to help traders move from static trade marking
to live execution intelligence.
Note : Education purpose only
 Education