#CERACera Sanitaryware Limited (CERA) on the weekly timeframe is currently trading around 5,654.50 INR (−3.60%), showing signs of a corrective pullback after testing overhead resistance.
Price Action & Structure: The stock opened at 5,865.50, reached a high of 5,938.50, and dropped to a low of 5,600.00, following a recent "SELL 6047" signal near the swing peak.
Key Support Levels: Immediate downside support levels sit at T1 (5,667.2), followed by T2 (5,485.0) and T3 (5,190.2), with major structural support near the previous low around 4,400.00 (OL). #RELIANCEReliance Industries Limited (RELIANCE) is currently trading near 1,287.0 INR, reflecting a short-term bearish pull-back (−2.20%) on the 5-minute/short-term chart.
Key Levels & Price Action: The stock opened at 1,316.6 and hit a high of 1,320.0 before dropping to a session low of 1,280.0, where immediate support is currently holding.
Overhead Resistance: Immediate dynamic resistance lies at 1,298.1 (middle range) and higher up at 1,316.6–1,320.0.
Downside Targets & Support: A sustained breakdown below the 1,280.0 support level risks further weakness toward T1 at 1279.25 and down into the 1,260–1,270 zone. The Hidden Trap Behind “Healthy” PullbacksA market rarely moves in a straight line. Even strong trends pause, retrace, and test previous levels before continuing. That retracement is where many traders look for an entry, but it is also where things can get confusing.
A reversal can look like an ordinary pullback in its early stages. If you enter simply because price has reached a support, resistance, or Fibonacci level, you may end up entering just as the market is preparing to move in the opposite direction.
The key is not finding the perfect pullback level. It is understanding what price is doing during the retracement.
Start by Comparing the Moves:
One of the easiest ways to judge a pullback is to compare it with the move that came before it. Suppose gold makes a strong move higher with large candles and little hesitation, then begins moving lower.
If that decline is slow, overlapping, and full of pauses, sellers are not showing the same urgency that buyers showed during the rally. But if the decline suddenly becomes aggressive, with large candles pushing through levels quickly, the situation deserves much more attention.
A correction should not automatically be expected to behave like a weak move. Sometimes it becomes the strongest move on the chart.
Pay Attention to the Swing Points
The important question during a pullback is whether the original market structure is still alive. In an uptrend, the previous significant low matters because it represents an area where buyers previously managed to defend price.
If price pulls back toward that level and holds, the bullish structure remains intact. But if sellers break through it with conviction, continuing to call the move a “pullback” can become an excuse to hold onto a trade idea that is no longer valid.
The same logic applies to a downtrend. If buyers break an important previous high, the bearish structure is being challenged.
The Level Is Not the Signal:
This is where many traders get trapped. They mark a support zone, wait for price to reach it, and immediately buy because the chart looks “perfect.”
But a level only tells you where something could happen. It does not tell you what will happen.
When price reaches the area, watch the reaction. Is there rejection? Does selling pressure slow down? Does price form a higher low and reclaim a nearby swing? Those clues tell you much more than simply seeing price touch a support line.
Watch the Effort and the Result:
Another useful clue is the relationship between how aggressively price moves and how much progress it actually makes.
Imagine sellers produce several strong-looking candles, but price barely manages to move lower before buyers start absorbing the pressure. That is different from a few aggressive candles that push price through multiple important levels.
The market is constantly showing you a relationship between **effort and result**. When the opposite side puts in a lot of effort but achieves very little, the pullback may be losing strength. When the opposite side achieves a lot with little hesitation, the original trend may be in trouble.
Stop Trying to Catch the Exact Bottom:
Many traders try to predict the exact candle where a pullback will finish. They see a familiar support level and enter immediately, hoping to catch the reversal from the lowest possible price.
You don't need to predict the bottom.
Your job is to wait until the market provides enough evidence that the original trend is becoming active again. That could be a rejection followed by a higher low, a small structure break and retest, or a strong continuation move after the level holds.
You might enter slightly later, but you are making the decision with more information.
Think of Every Pullback as a Test:
A useful way to look at a pullback is to treat it as a test between the two sides of the market.
The trend is essentially being challenged. If the counter-trend move remains weak and the important structure survives, continuation becomes more believable. If the opposing side becomes increasingly aggressive and starts creating structure in the opposite direction, the original trend is losing control.
This is why a pullback should never be judged by depth alone. A 50% retracement can be completely healthy in one situation and extremely dangerous in another.
The Simple Rule:
Before entering a pullback, don't ask, “Where should I buy or sell?”
Ask, “What evidence would prove that this pullback is actually ending?”
That change in thinking forces you to read the market instead of blindly trading a level.
The best pullbacks are not necessarily the deepest ones or the ones that touch the most popular Fibonacci number. They are the ones where the trend survives the correction and price gives you evidence that the original direction is returning .
By @BrightRally_Research on @TradingView  Education
XAUUSD — 4,686 Looks Like the Trap XAUUSD — 4,686 Looks Like the Trap
Gold is finally showing that tired feeling after such a strong run into the three-month high area.
Price pushed higher inside a clean bullish structure through August, with several BOS moves showing buyers were in control. But after gold stretched into the upper channel and started holding below the 4,686.140 liquidity area, the rhythm changed. The market is no longer climbing smoothly. It is moving sideways under resistance, almost like price is catching its breath while sellers quietly test buyer strength.
For newer traders, this is the important part: after a big bullish expansion, a pullback does not mean the whole trend is finished. But when price fails to hold above 4,600 and keeps rejecting below the upper liquidity zone, the market often wants to rebalance lower before the next clean move.
My main view is bearish for a correction while gold stays below 4,686.140. The macro background also supports caution, with US inflation matching expectations, Fed rate-hike risk still alive, and traders waiting for the Fed Chair’s Jackson Hole speech. That kind of environment can make buyers hesitate near the highs.
If gold pushes back toward 4,640 - 4,686 and rejects, I would see that as a possible liquidity trap before price pulls toward the major pullback support around 4,450 - 4,480. That zone is important because it sits under the previous bullish leg and may be where buyers try to reload.
This bearish correction idea becomes weak only if gold reclaims 4,686.140 and holds above it. Until then, I see the upper zone as resistance, not clean continuation.
Key price zones to watch
Current reaction area: 4,600 - 4,610
Main supply / liquidity trap zone: 4,640 - 4,686.140
Bearish confirmation zone: clean hold below 4,600
First downside target: 4,563 - 4,570
Main pullback support: 4,450 - 4,480
Deep demand reaction zone: 4,000 - 4,020
Upper liquidity if buyers recover: 4,686.140
Invalidation: clean reclaim and hold above 4,686.140
Do you see this as gold preparing for a healthy pullback into 4,450 - 4,480, or do buyers still have one more sweep above 4,686 before the correction starts? Short 
XAUUSD – Gold Below 4,600, Decision Zone Ahead XAUUSD – Gold Below 4,600, Decision Zone Ahead
Gold is entering a very important short-term decision area after losing momentum near the upper part of the rising channel.
Price is currently trading around 4,602 after a failed continuation above the recent resistance area. The market is still inside the broader bullish channel, but the short-term structure is no longer clean. Buyers need to defend the next demand zone, or gold may move into a deeper correction.
FUNDAMENTAL VIEW
Gold slipped below the 4,600 area during the early European session as traders focused on U.S. PCE inflation data and the Jackson Hole event.
Stronger inflation expectations can support the idea of a more hawkish Fed, which may lift the U.S. dollar and Treasury yields. This usually puts pressure on gold because gold does not offer yield.
At the same time, geopolitical headlines remain important. Iran’s conditions for reopening the Hormuz route may affect oil prices and inflation expectations, which can create sharp volatility for gold.
So the current market is not simple. Gold has bullish structure from the previous rally, but short-term pressure is building before the next big catalyst.
TECHNICAL VIEW – SMC + FIBONACCI
From an SMC perspective, gold has failed to hold the recent upside momentum after reaching the upper section of the channel.
The chart shows a short-term market structure shift around the 4,600 area, with price now moving sideways after a bearish reaction. This means buyers are no longer fully in control in the very short term.
The first important downside area is the expected buy zone around 4,528 – 4,544. This is the zone where buyers may try to defend the broader bullish channel. If price sweeps into this area and reacts strongly, gold may recover toward the expected selling zone above.
The expected selling zone is around 4,650 – 4,670. If gold retests this area and fails to break higher, sellers may step in again.
The larger structure remains bullish while price stays inside the rising channel, but if 4,528 fails, the correction may extend deeper.
KEY PRICE ZONES
Current price: 4,602
Immediate decision area: 4,600
Expected buy zone: 4,528 – 4,544
Expected selling zone: 4,650 – 4,670
Upper resistance: 4,700 area
Major lower liquidity: 4,300 – 4,320
Bullish reaction valid: Above 4,528
Short-term recovery confirmation: Above 4,625
Stronger bullish continuation: Above 4,670
Invalidation for short-term bullish reaction: Below 4,528
TRADING SCENARIOS
Buy Scenario – Support Reaction
Buy Zone: 4,528 – 4,544
Entry: Bullish rejection, liquidity sweep, lower-timeframe CHoCH, or strong reaction from the demand zone
SL: Below 4,528 or below the nearest swing low
TP1: 4,600
TP2: 4,650 – 4,670
Sell Scenario – Resistance Reaction
Sell Zone: 4,650 – 4,670
Entry: Bearish rejection, failed breakout, or lower-timeframe bearish CHoCH
SL: Above the rejection swing high
TP1: 4,600
TP2: 4,544
TP3: 4,528
Breakdown Scenario
Condition: Clean break and hold below 4,528
Target: Deeper correction toward the lower channel and liquidity zones
MY VIEW
Gold is not fully bearish yet, but short-term momentum has weakened.
The key area for me is 4,528 – 4,544. If buyers defend this zone, gold may recover and retest 4,650 – 4,670.
But if gold loses this buy area, the current correction may become deeper and the market may look for lower liquidity before buyers return.
I do not want to chase gold in the middle around 4,600. I prefer waiting for price to either sweep the buy zone or reject clearly from the selling zone.
Gold is still inside the bigger bullish channel — but the next reaction around 4,528 – 4,544 will decide if buyers are ready to continue.
Do you think gold will defend the buy zone and recover, or will sellers force a deeper correction first?
Short 
XAUUSD — Bullish Wave 5 Setup From Buy FVGXAUUSD — Bullish Wave 5 Setup From Buy FVG
Gold is starting to build a bullish recovery structure after defending the lower area near 4,570–4,580. From Kelly’s view, the current chart suggests that XAUUSD may be forming a new Elliott Wave upside sequence, with the latest pullback acting as wave (2) before price attempts to continue higher into wave (3), wave (4), and finally wave (5).
The key idea is simple: if gold continues to hold above the Buy FVG zone, the bullish structure remains valid and the next upside target may open toward 4,655 first, then 4,705–4,712.
⟡ Market Structure
Gold previously moved inside a descending correction channel, but the latest reaction from the lower zone shows that sellers are starting to lose pressure. Price is now trading around 4,603, right above the Buy FVG zone near 4,590–4,598.
If buyers continue to defend this area, gold may complete wave (2) and start pushing into wave (3). The first breakout area to watch is the Buy zone wave 5 / reaction zone around 4,622–4,628. A clean break above this zone would confirm stronger bullish momentum.
Above that, the next important target is the Fibonacci + FVG zone around 4,654–4,660, which also matches the projected wave (3) area. If price later pulls back and holds above structure, the final upside target remains the Target wave 5 zone near 4,705–4,712.
➤ Key Levels
◌ Current price area: 4,603
◌ Buy FVG support: 4,590–4,598
◌ Wave (2) invalidation area: below 4,570
◌ Buy zone wave 5 / breakout zone: 4,622–4,628
◌ Fibonacci + FVG target: 4,654–4,660
◌ Main wave 5 target: 4,705–4,712
⌁ Elliott Wave View
The chart is showing a possible bullish 5-wave recovery structure.
Wave (1) may have formed from the lower reaction zone toward 4,615–4,620.
Wave (2) appears to have corrected back into the lower FVG area near 4,570–4,580.
If this low holds, wave (3) can develop toward 4,654–4,660.
After that, wave (4) may create a small pullback toward 4,622–4,628.
The final wave (5) target remains near 4,705–4,712.
This is why Kelly is not focusing on chasing sells at the current level. The cleaner plan is to wait for confirmation that buyers are defending the FVG and that price can break back above the short-term correction structure.
▸ Trading Scenario
Preferred bullish scenario
Entry: Buy around 4,590–4,598 if price gives bullish confirmation from the Buy FVG zone
Stop Loss: Below 4,570
Take Profit 1: 4,622–4,628
Take Profit 2: 4,654–4,660
Take Profit 3: 4,705–4,712
Alternative entry: If gold breaks above 4,622–4,628 and retests this zone as support, buyers may look for continuation toward the Fibonacci + FVG zone.
◌ Invalidation
The bullish view becomes weaker if gold breaks below 4,570 and fails to reclaim the Buy FVG zone. In that case, the wave (2) structure may fail and price could continue the correction lower before any new bullish setup appears.
⌁ Kelly’s View
Kelly’s main view is bullish as long as gold holds above the lower FVG support. The market is still inside a recovery attempt, and the Elliott Wave structure suggests that a new upside sequence may be forming.
If buyers defend 4,590–4,598 and price breaks above 4,622–4,628, gold may continue toward 4,654–4,660, then potentially complete wave (5) near 4,705–4,712.
Do you think gold will confirm wave (3) from here, or will price retest the Buy FVG one more time first? Long 
XAUUSD: 4,600 Trap Before the Next Move XAUUSD: 4,600 Trap Before the Next Move
Market Context
Gold remains technically positive on the daily chart, holding above the 100-day SMA and the middle Bollinger structure. RSI is still around the bullish zone, showing that buyers have not fully lost control yet.
However, the short-term chart is telling a different story. Gold has pulled back from the recent high and is now struggling around 4,600. This level is no longer just a number — it is the line that decides whether buyers recover or sellers extend the correction.
Key point: the higher-timeframe bias is still constructive, but below 4,600, short-term sellers still have the advantage.
Technical Structure
Gold is trading around 4,602 after a sharp correction from the upper structure. The recent bullish trend is not fully broken, but momentum has clearly slowed after price failed to continue from the high area.
The nearest resistance is 4,600. Buyers need to reclaim and hold above this level to reduce selling pressure.
Above that, 4,660 - 4,675 is the Bearish Reload Zone. If gold rebounds into this area and rejects, sellers may defend strongly again.
The important downside level is 4,559. This is the Bearish Pressure Line. A break below this level could confirm stronger selling pressure and open the way toward 4,531.
The 4,531 zone is the Liquidity Sweep Zone, and the next major reaction area sits around 4,455 - 4,490. This is where buyers may attempt a stronger rebound if the correction expands.
Key Levels
Current Price: 4,602
Near Resistance: 4,600
Bearish Reload Zone: 4,660 - 4,675
Bearish Pressure Line: 4,559
Liquidity Sweep Zone: 4,531
Liquidity Reaction Pocket: 4,455 - 4,490
Institutional Demand Floor: 4,320 - 4,360
Bullish Recovery: Above 4,600
Bearish Continuation: Below 4,559
Trading Plan
Sell Scenario
Entry: 4,660 - 4,675 after bearish confirmation
SL: Above 4,700
TP: 4,600 / 4,559 / 4,531
Condition: Price rebounds into the Bearish Reload Zone and fails to continue higher. Sellers remain in control if gold rejects from this area.
Early Sell Scenario
Entry: Below 4,559 after breakdown and retest
SL: Above 4,600
TP: 4,531 / 4,490 / 4,455
Condition: Price breaks the Bearish Pressure Line and fails to reclaim it. This would confirm that the current correction is still active.
Buy Reaction
Entry: 4,531 after bullish confirmation
SL: Below 4,505
TP: 4,559 / 4,600 / 4,660
Condition: Price sweeps liquidity near 4,531 and shows a strong bullish reaction. This is only a reaction buy, not a full reversal unless gold reclaims 4,600.
Deep Buy Re-entry
Entry: 4,455 - 4,490 after bullish confirmation
SL: Below 4,320
TP: 4,531 / 4,600 / 4,660
Condition: If gold corrects deeper, this pocket becomes the stronger zone to watch for buyers. A clean rejection here would show that the larger bullish structure is still alive.
Buy Breakout
Entry: Above 4,600 after breakout and retest
SL: Below 4,559
TP: 4,640 / 4,660 / 4,675
Condition: Buyers must reclaim 4,600 with strength and hold the retest. Without this confirmation, buying remains risky because price is still under short-term sell pressure.
Overall Bias
Gold remains positive on the higher timeframe, but the short-term structure is weak below 4,600.
If buyers reclaim 4,600, gold can recover toward 4,660 - 4,675. But if price breaks below 4,559, the correction may extend toward 4,531 and possibly 4,455 - 4,490.
Best approach: wait for confirmation. Do not chase buys below 4,600, and do not sell directly into liquidity without a clean breakdown.
Will buyers reclaim 4,600, or will sellers drag gold into the 4,531 liquidity zone first?
Short 
BRIAN XAUUSD – GOLD BELOW 4,600, POC DECIDES THE NEXT MOVE BRIAN XAUUSD – GOLD BELOW 4,600, POC DECIDES THE NEXT MOVE
Gold is entering the final trading day of the week with pressure returning below the 4,600 area.
After several sessions of strong bullish expansion, price is now slowing near the upper value structure. This is not a full bearish reversal yet, but the chart is clearly showing hesitation. Buyers are no longer pushing cleanly, while sellers are starting to defend the higher resistance zones.
Fundamentally, the market is also waiting for confirmation. US PCE data continues to support the idea that the Fed may keep a tighter policy stance, while traders are focused on Jackson Hole for the next policy signal. At the same time, headlines from Iran about conditions to reopen the Strait of Hormuz keep geopolitical risk active.
So gold is now sitting between two forces:
Fed pressure and stronger USD risk on one side.
Geopolitical uncertainty and safe-haven demand on the other side.
Technical structure
On the H1 chart, gold is trading around 4,600 after losing momentum from the upper consolidation area.
The key resistance is the POC Value Resistance around 4,630 - 4,640. This is the zone where sellers may continue to defend if price rebounds. As long as gold stays below this area, the short-term structure remains heavy.
The current reaction zone is around 4,585 - 4,595. Price is trying to hold here, but the reaction is still weak. If buyers cannot defend this zone, the next downside area is the Liquidity Test Zone near 4,546.
Below that, the HVN Acceptance Zone around 4,486 is the larger value area where stronger buyers may appear again.
Important zones
Current price area: 4,595 - 4,605
Gold is sitting in a short-term decision zone.
POC Value Resistance: 4,630 - 4,640
Main resistance if price rebounds.
Sell zone: 4,670 - 4,672
Upper liquidity / rejection area.
Liquidity Test Zone: 4,546
First downside target if 4,585 fails.
HVN Acceptance Zone: 4,480 - 4,490
Major deeper value support.
VAL Lower Support: 4,420 - 4,430
Wider structural support if selling pressure expands.
Trading scenario
Sell reaction from POC Value Resistance 4,630 - 4,640
Entry:
Look for sell positions only if gold rebounds into 4,630 - 4,640 and shows clear rejection.
Stop Loss:
Above the rejection high or above the 4,672 sell zone.
Take Profit:
TP1: 4,585 - 4,595
TP2: 4,546
TP3: 4,486 if sellers keep control
This setup follows the current short-term weakness while respecting the larger bullish structure.
Alternative buy scenario
If gold drops into 4,546 and shows strong bullish rejection, a short-term buy reaction can appear.
But I would treat that only as a reaction trade unless price reclaims 4,630 - 4,640 with strong acceptance.
Final view
Gold is still inside a larger bullish recovery structure, but short-term momentum is weakening below 4,600.
For now, the chart is not clean for chasing buy. The better plan is to watch whether gold can reclaim 4,630 - 4,640 or fail there again.
If 4,630 - 4,640 rejects, gold can rotate lower towards 4,546 and 4,486.
If price breaks and accepts above 4,640, buyers may try to retest 4,672.
If 4,546 holds strongly, a reaction bounce can appear before the next decision.
For me, the key level is simple:
Below 4,640 = sellers still have room to pressure.
Above 4,640 = buyers regain short-term control.
Lose 4,546 = deeper value test likely.
Will gold reclaim the POC resistance before Jackson Hole, or will sellers force a deeper liquidity sweep first? Long 
Nifty Elliott Wave Analysis | 31 Aug – 30 Sep, 2026Wrap-up:-
As discussed in my previous Mid-Term NIFTY Analysis (Weekly Chart published on 11 July 2026 ), the market continues to trade within Wave Y of Wave X of the larger Major Wave 4 corrective structure .
Within Wave Y, Wave A concluded at 24,601, while Wave B is currently unfolding.
Based on the latest price structure, Wave B appears to be developing as an ABC Irregular Correction.
The internal structure is currently interpreted as follows:
Internal Wave A of Wave B completed at 23,070.
Internal Wave B is currently unfolding.
Within this Internal Wave B :
Internal Wave W concluded at 24,261.
Internal Wave X concluded at 23,606.
Internal Wave Y is currently unfolding.
Within this Internal Wave Y :
Internal Wave A concluded at 24,602.
Internal Wave B is approaching completion and will be considered confirmed only after NIFTY registers a decisive breakout and sustains above 24,311 .
Upon confirmation of Internal Wave B , the market is expected to transition into Internal Wave C , with a projected upside objective in the 25,500-26,500 Range .
What I'm Watching | 31 Aug – 30 Sep 2026
The immediate focus remains on the completion and confirmation of Internal Wave B .
If the current Elliott Wave count remains valid and NIFTY sustains above 24,311 , it would increase the probability of Internal Wave C commencing.
Historically, Wave C often develops as the strongest and most directional leg within an ABC corrective sequence, making this an important phase to monitor.
A sustained move above the identified resistance levels would further strengthen the bullish outlook.
Key Levels to Watch
Immediate Resistance: 24,311
Major Resistance: 24,772-25116 Range
Bullish Projection: 25,500–26,500 (subject to wave confirmation)
Trend Bias: Bullish , unless the current Elliott Wave structure is invalidated.
Professional View:
The broader Elliott Wave structure continues to favour a bullish outlook, provided the current wave count remains valid. While short-term volatility may persist during the completion of Internal Wave B , a decisive breakout above 24,311 would significantly improve the probability of an impulsive advance toward the 25,500–26,500 region.
As always, confirmation through price action should take precedence over anticipation. Traders should monitor key validation levels, remain flexible if the wave structure changes, and apply disciplined risk management.
Disclaimer: This analysis reflects my personal interpretation of the market using Elliott Wave Theory and is shared strictly for educational purposes only. It should not be considered financial or investment advice.
"Don't predict the market. Decode it."  Long
Long
Flag Patterns: 4 Setups Traders Should KnowFlag patterns are continuation setups that usually appear after a strong directional move. The key is not the shape alone, but the sequence behind it:
Impulse → Consolidation → Breakout → Continuation
1. Bull Flag
A strong bullish impulse is followed by a controlled pullback inside a small downward or sideways channel. If buyers break the upper boundary while the broader trend remains bullish, continuation becomes more likely.
Strong push → controlled pullback → breakout higher
2. Bear Flag
After a sharp selloff, price recovers inside a small rising channel. The bounce can look bullish, but if the larger structure remains weak and price breaks the lower boundary, sellers may regain control.
Strong selloff → weak recovery → breakdown
3. Bull Pennant
Instead of forming a parallel channel, price compresses into a small triangle after a bullish impulse. Lower highs and higher lows show tightening conditions. A breakout higher can restart the original bullish move.
4. Bear Pennant
A strong bearish move is followed by tightening consolidation. If price breaks below the pennant while the broader bearish structure remains intact, continuation lower becomes the main scenario.
How AURICVERSE Reads Flags
1. A real impulse — weak momentum before the pattern usually means a weaker setup.
2. Controlled consolidation — not a messy, volatile range.
3. Trend alignment — continuation setups work better when they follow the larger structure.
4. A confirmed breakout — recognizing the pattern is not the same as having an entry.
My preferred sequence is:
Impulse → Pause → Breakout → Confirmation → Execution
Not:
Looks like a Flag → Enter immediately.
Flags can still fail. I become cautious when the pullback retraces too much of the original move, the breakout quickly returns inside the pattern, or the setup forms directly into major support or resistance.
AURICVERSE Takeaway
The Flag itself is not the edge.
The edge is recognizing when momentum pauses without losing structure.
Strong move. Controlled pause. Clean breakout. Clear invalidation.
Good traders do not trade every pattern they recognize. They wait for the ones that make sense in context. Education 
XAUUSD 4619 fake bounce — 4509 still open XAUUSD 4619 fake bounce — 4509 still open
That bounce into 4,619 is not convincing yet.
Gold is still holding the bigger bullish story, yeah. The India price data shows demand is not dead, and gold is still getting support from buyers in the background.
But the chart here? Short-term looks tired.
Price already pushed hard from the sellside liquidity low, climbed inside that rising channel, then ran straight into the FVG around 4,640 - 4,655. That zone is acting like a lid now. Above it, the small OB near 4,660 - 4,675 is the real trap area.
This is where late buyers usually get baited.
Main bias is bearish pullback while gold stays below 4,655 - 4,675.
The key floor is 4,600 - 4,582. Price already swept liquidity around that area once. If gold breaks back under 4,582 with pressure, the next draw is clear: 4,509. That sellside liquidity target is sitting clean. Too clean, honestly.
I’m not shorting randomly at the low though. Need either rejection from the FVG or a clean breakdown.
Trading scenario:
Sell idea only if gold rejects 4,640 - 4,675 or breaks below 4,582 with strong candles.
Entry zone: 4,640 - 4,675 after rejection
Alternative entry: below 4,582 after breakdown confirmation
Stop loss: above 4,690
TP1: 4,600
TP2: 4,582
TP3: 4,509
No rejection, no sell. No breakdown, no chase.
If gold closes strong above 4,690, this pullback idea is cooked. Then buyers can try to squeeze back toward 4,720.
For now, I’m reading this as FVG rejection first, 4,509 liquidity next.
You think 4,640 rejects again, or does gold fake one more push into 4,675?
Short 
Buy Low, Sell High — The Part That Makes Profit“Buy low, sell high” sounds like the perfect trading rule. The problem is that most traders focus on the price and ignore the location. A market can look cheap and still keep falling. It can look expensive and continue making new highs. The edge comes from understanding where that low or high appears inside the market structure.
1. Lower Price Does Not Mean Better Opportunity
Imagine BTCUSDT falling from $80K to $75K, then $70K and eventually $65K. At $65K, Bitcoin is obviously cheaper than it was at $80K, but if price is still producing Lower Highs and Lower Lows, sellers are still controlling the market.
This is where many traders lose money. They see a large discount and automatically assume the market is offering value. But before buying, I want to see something actually change: a major support holding, liquidity being swept and reclaimed, a Lower High being broken, or buyers beginning to create a Higher Low.
The better question is not “Has price fallen enough?” It is “Has the market given buyers a real advantage yet?”
2. The Better Buy Often Comes After the Breakout
One of the most useful lessons in trading is that you do not always want to buy before the move starts. Sometimes the safer opportunity appears after the market has already shown strength.
Suppose BTC spends hours below $75K, finally breaks through it and rallies toward $80K. Chasing the move at $80K may offer poor risk-to-reward. But if price later pulls back toward $75K–$76K and that old resistance begins acting as support, the situation becomes far more interesting.
A simple sequence to remember is:
Breakout → Pullback → Support Holds → Continuation
Now you are buying lower, but you are doing it after buyers have already proved themselves. The same concept works on XAUUSD, EURUSD, ETHUSDT, SOLUSDT and most liquid markets.
3. Selling High Is Not the Same as Shorting a Strong Market
The opposite mistake happens when price rallies aggressively. Traders see a new high and immediately think: “This is too expensive. It has to fall.”
Not necessarily.
A strong bullish market can remain overextended for much longer than expected. If BTC keeps making Higher Highs and Higher Lows, defending support and breaking resistance, shorting simply because the price looks high means fighting the dominant order flow.
A sell becomes much more interesting when the market starts showing failure:
Resistance → Failed Breakout → Lower High → Structure Break
That sequence tells you something has actually changed. Without it, “sell high” can become nothing more than trying to guess the exact top.
4. Location Changes the Probability
This is the part that matters most.
Two identical candles can produce completely different trades depending on where they appear. A bullish candle directly below major resistance after a long rally may offer very little upside. The exact same candle appearing after a liquidity sweep into strong support can be far more valuable.
Same candle. Different location. Different trade.
Before entering, I want four things to make sense:
Trend: Who currently has control?
Location: Is price near meaningful support or resistance?
Reaction: Is the market actually responding there?
Invalidation: At what point is my idea clearly wrong?
That last question is crucial. A trade is easier to manage when you know not only where price could go, but also where your reasoning stops being valid.
5. A More Practical Way to “Buy Low, Sell High”
Instead of trying to catch exact tops and bottoms, think in terms of better prices within the current trend.
In a bullish market, wait for a pullback toward support, previous resistance, demand, EMA structure or a Higher Low. Then look for buyers to return.
Bullish Structure + Pullback + Support Reaction = Potential Buy
In a bearish market, wait for price to rebound toward resistance, supply, broken support or a Lower High. Then watch whether sellers regain control.
Bearish Structure + Rally + Resistance Reaction = Potential Sell
This also improves risk-to-reward. Buying closer to support gives you a clearer invalidation and more room toward the next resistance. Selling closer to resistance does the same thing in reverse.
Final Thought
The money is not made because you bought something cheaper than yesterday or sold something higher than last week. It is made when price, structure, location and risk all line up in your favor.  Education
Long 
 Long
Long
NIFTY : INTRADAY TRADING PLAN — 28-AUG-2026Prepared for Educational Purposes Only
═══════════════════════════════════
🔍 MARKET SNAPSHOT (Previous Session)
═══════════════════════════════════
Previous Close : 24,090.85
Last Intraday Res. : 24,465.00 🔴
Opening Resistance : 24,202 – 24,234 🟠
Opening Support/Res : 24,044 – 24,100 🟢
Last Intraday Support: 23,854.00 🟢
Gap Criteria Considered: 100+ points (Gap Up / Gap Down)
- Gap Up Zone : Open above 24,190
- Flat Zone : Open between 23,990 – 24,190
- Gap Down Zone : Open below 23,990
═══════════════════════════════════
🟢 SCENARIO 1: GAP UP OPENING (100+ pts, Open > 24,190)
═══════════════════════════════════
📘 Explanation:
A gap up of 100+ points shows strong overnight positive sentiment (global cues/FII flows). However, gap-ups often get tested for "gap-fill" in the first 15-30 mins, so patience is key before committing.
🎯 Plan of Action:
1️⃣ Wait for first 15-min candle to close before entry — avoid impulsive trades.
2️⃣ If price sustains ABOVE 24,234 with volume → Bullish continuation likely toward 24,315 → 24,465 (Last Intraday Resistance).
3️⃣ If price REJECTS at 24,202–24,234 zone and slips back below 24,100 → Expect gap-fill move toward 24,044.
4️⃣ Aggressive Traders: Buy CE (Call Option) on confirmed breakout above 24,234 with SL below 24,190.
5️⃣ Conservative Traders: Wait for retest of 24,202–24,234 as support before entering longs.
🛑 Invalidation: Close below 24,090 (previous close) negates bullish bias — flip to neutral/bearish watch.
═══════════════════════════════════
⚪ SCENARIO 2: FLAT OPENING (Open within 23,990 – 24,190)
═══════════════════════════════════
📘 Explanation:
Flat opening indicates indecision — market awaits a trigger. Best approach is to let price action define direction using the Opening Support/Resistance zone (24,044–24,100) as the pivot.
🎯 Plan of Action:
1️⃣ Use 24,044–24,100 as the "decision zone."
2️⃣ Bullish Trigger: Sustained trade above 24,100 → Target 24,202 → 24,234 → 24,315.
- Buy CE on 15-min close above 24,100, SL 24,044.
3️⃣ Bearish Trigger: Sustained trade below 24,044 → Target 23,940 → 23,854 (Last Intraday Support).
- Buy PE (Put Option) on 15-min close below 24,044, SL 24,100.
4️⃣ Avoid trading INSIDE the 24,044–24,100 range — this is a chop zone, low reward-to-risk.
🛑 Invalidation: Repeated whipsaws across the zone = stay OUT, let market pick a side.
═══════════════════════════════════
🔴 SCENARIO 3: GAP DOWN OPENING (100+ pts, Open < 23,990)
═══════════════════════════════════
📘 Explanation:
A gap down of 100+ points reflects negative overnight sentiment. Like gap-ups, gap-downs often see a "pullback/retest" toward the gap zone before continuation — don't chase the first candle.
🎯 Plan of Action:
1️⃣ Wait for first 15-min candle close for confirmation.
2️⃣ If price sustains BELOW 23,940 → Bearish continuation likely toward 23,854 (Last Intraday Support) and further downside.
3️⃣ If price PULLS BACK toward 24,044–24,100 zone and gets rejected → Re-enter shorts (Buy PE) with SL above 24,100.
4️⃣ If price reclaims ABOVE 24,100 → Gap-down invalidated, expect recovery toward 24,202.
5️⃣ Aggressive Traders: Buy PE on breakdown below 23,940, SL above 23,990.
6️⃣ Conservative Traders: Wait for pullback rejection at 24,044–24,100 before shorting.
🛑 Invalidation: Strong reclaim & 15-min close above 24,100 flips bias to neutral/bullish.
═══════════════════════════════════
⚠️ OPTIONS TRADING RISK MANAGEMENT TIPS
═══════════════════════════════════
✅ Position Sizing: Risk only 1–2% of capital per trade — options can move fast both ways.
✅ Always Use Stop Loss: Pre-define SL before entry; never average a losing option position.
✅ Avoid Overtrading: Stick to max 2–3 quality setups per day; avoid revenge trading.
✅ Theta Decay Awareness: Options lose value over time — avoid holding OTM options overnight without conviction.
✅ IV Check: Avoid buying options when Implied Volatility (IV) is unusually high (expensive premiums).
✅ Book Partial Profits: Scale out at first target, trail SL to cost on remaining quantity.
✅ Avoid Naked Option Selling without hedge — unlimited risk potential.
✅ News/Event Risk: Avoid fresh positions minutes before major economic data or RBI/Fed announcements.
═══════════════════════════════════
📝 SUMMARY
═══════════════════════════════════
• Gap Up (>24,190): Watch 24,202–24,234 zone; breakout → bullish toward 24,315/24,465.
• Flat (23,990–24,190): Let 24,044–24,100 zone decide direction; trade the breakout, not the range.
• Gap Down (<23,990): Watch 23,940 breakdown; bearish toward 23,854; pullback to 24,044–24,100 is a shorting opportunity if rejected.
• Key Support: 23,854 | Key Resistance: 24,465
═══════════════════════════════════
🎓 CONCLUSION
═══════════════════════════════════
Markets can open in any of the three scenarios, and having a pre-defined plan for each helps traders act with discipline rather than emotion. Always wait for confirmation candles, respect stop losses, and align position sizing with risk appetite. This plan is a structured framework to assist decision-making — not a guaranteed prediction of market movement.
═══════════════════════════════════
⚠️ DISCLAIMER
═══════════════════════════════════
I am NOT a SEBI Registered Analyst. This content is shared purely for EDUCATIONAL PURPOSES ONLY and should not be construed as investment/trading advice. Please consult a SEBI-registered financial advisor before making any trading or investment decisions. Trading in equities/options involves substantial risk of loss.
📌 Trade Safe | Manage Risk | Stay Disciplined 📌
``` Flipping the Fibonacci ( Concept and Price action ) This post is educational and observational in nature based on historical price action. It is not a forecast or a trading recommendation.
The Reverse Fibonacci Approach
In a typical Fibonacci retracement, the swing low is anchored as the zero point and the swing high as the one point, measuring a retracement within an upward move. In this chart, that logic has been reversed. Since this stock is in a downtrend, the swing high has been anchored as the zero point and the swing low as the one point, creating what can be called a reverse Fibonacci. This reframes the retracement zones to reflect a corrective bounce within a broader downward structure rather than a pullback within an uptrend.
The 38.2% to 50% Zone
Within this reversed framework, the 38.2% to 50% zone has been marked on the chart. Even measured this way, this area remains within what is generally considered bearish territory for the overall structure, since the broader trend has not shown a decisive reversal beyond this zone.
The Supply Conversion
Marked in green is a zone that tells its own story. During 2022 and 2023, price recovered into this area, and what had previously acted as a solid resistance zone showed signs of conversion, with the market beginning to treat it differently on subsequent visits. This shift is worth observing closely, since a resistance area evolving in this way often reflects a change in how buyers and sellers are interacting at that level.  Long
Long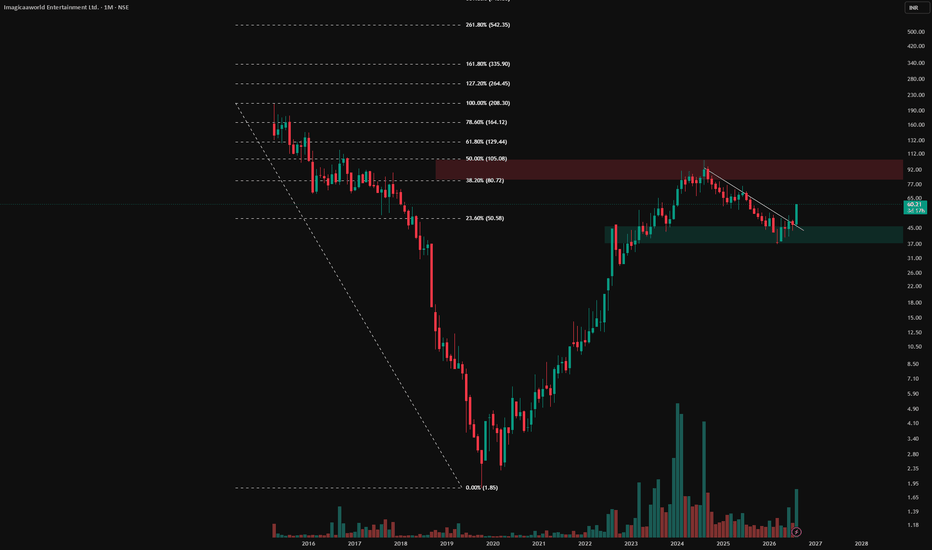
Channels Stacked on Channels ( Something New ) This post is educational and observational in nature based on historical price action. It is not a forecast or a trading recommendation
The First Channel: 2015 to 2020
In 2015, this stock delivered a strong rally, after which it settled into an extended consolidation lasting over five years. Within this consolidation, price formed a well defined ascending parallel channel, marked by a consistent sequence of higher highs and higher lows, contained between two rising parallel boundaries.
The Breakout and the Flip
Price eventually broke above the upper boundary of this channel, then pulled back down to it. Instead of breaking back inside, the level held, and what had been the resistance line of the original parallel channel converted into support. This flip occurred around 2022 and 2023, during a fresh rally that used the old channel boundary as its new foundation.
The Second Channel: 2024 Onward
From that flipped support, a new parallel channel began forming in 2024, an entirely separate structure built directly on top of the first one. The resistance line of the earlier channel effectively became the base for this next channel to develop.
 Long
Long
Education

 Education

 Education


